Mga Batayang Estadistika
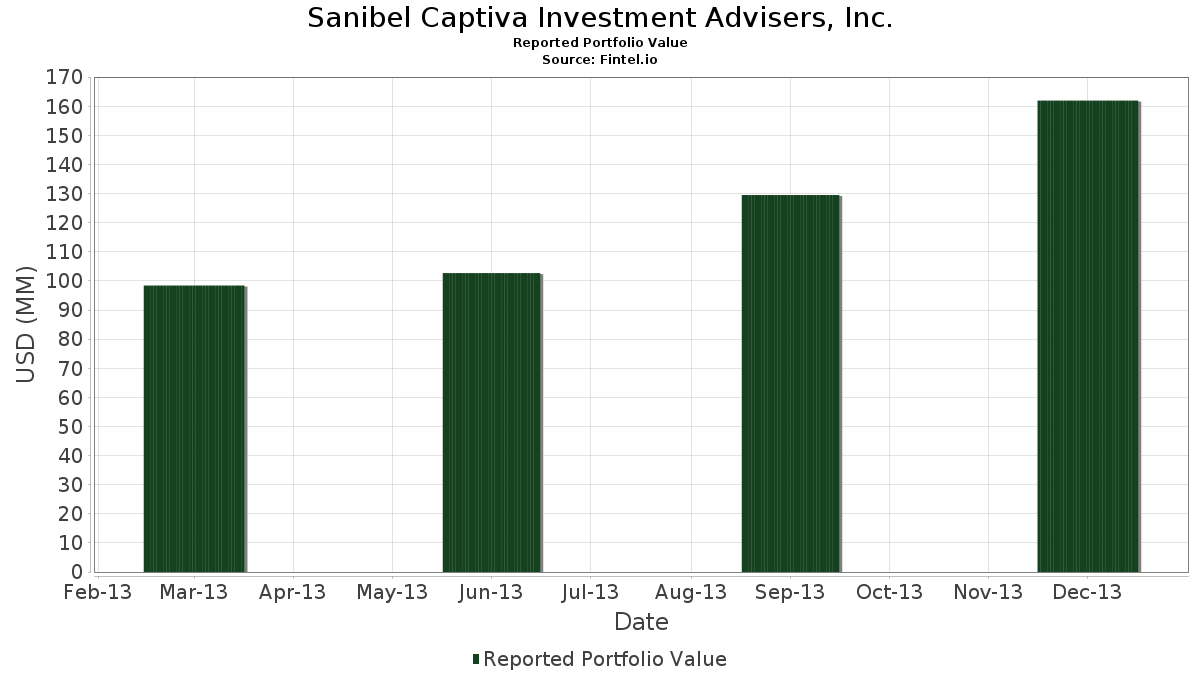
| Nilai Portofolio | $ 161,971,000 |
| Posisi Saat Ini | 100 |
Kepemilikan Terbaru, Kinerja, AUM (dari 13F, 13D)
Sanibel Captiva Investment Advisers, Inc. telah mengungkapkan total kepemilikan 100 dalam pengajuan SEC terbaru mereka. Nilai portofolio terbaru dihitung sebesar $ 161,971,000 USD. Aset yang Dikelola (AUM) sebenarnya adalah nilai ini ditambah kas (yang tidak diungkapkan). Aset-aset utama Sanibel Captiva Investment Advisers, Inc. adalah Kinder Morgan, Inc. (US:KMI) , The Williams Companies, Inc. (US:WMB) , General Electric Company (US:GE) , Magellan Midstream Partners L.P. (US:MMP) , and Brookfield Infrastructure Partners L.P. - Limited Partnership (US:BIP) . Posisi baru Sanibel Captiva Investment Advisers, Inc. meliputi: (US:PETM) , Check Point Software Technologies Ltd. (US:CHKP) , Costco Wholesale Corporation (US:COST) , Pfizer Inc. (US:PFE) , and (US:COV) .
Peningkatan Tertinggi Kuartal Ini
Kami menggunakan perubahan dalam alokasi portofolio karena ini adalah metrik yang paling bermakna. Perubahan dapat disebabkan oleh perdagangan atau perubahan harga saham.
| Keamanan | Saham (MM) |
Nilai (Juta Dolar AS) |
Portfolio % | ΔPorsyento ng Portfolio |
|---|---|---|---|---|
| 0.02 | 1.36 | 0.8378 | 0.8378 | |
| 0.01 | 1.22 | 0.7551 | 0.7551 | |
| 0.01 | 1.22 | 0.7545 | 0.7545 | |
| 0.01 | 1.12 | 0.6921 | 0.6921 | |
| 0.01 | 0.99 | 0.6118 | 0.6118 | |
| 0.01 | 0.97 | 0.5970 | 0.5970 | |
| 0.01 | 0.96 | 0.5902 | 0.5902 | |
| 0.01 | 0.93 | 0.5766 | 0.5766 | |
| 0.00 | 2.28 | 1.4083 | 0.5521 | |
| 0.03 | 1.91 | 1.1805 | 0.5397 |
Penurunan Tertinggi Kuartal Ini
Kami menggunakan perubahan dalam alokasi portofolio karena ini adalah metrik yang paling bermakna. Perubahan dapat disebabkan oleh perdagangan atau perubahan harga saham.
| Keamanan | Saham (MM) |
Nilai (Juta Dolar AS) |
Portfolio % | ΔPorsyento ng Portfolio |
|---|---|---|---|---|
| 0.01 | 0.45 | 0.2754 | -2.0867 | |
| 0.00 | 0.00 | -0.8454 | ||
| 0.00 | 0.00 | -0.8354 | ||
| 0.12 | 3.06 | 1.8874 | -0.6674 | |
| 0.20 | 7.11 | 4.3921 | -0.6008 | |
| 0.04 | 3.53 | 2.1794 | -0.3730 | |
| 0.07 | 1.47 | 0.9045 | -0.3640 | |
| 0.12 | 4.65 | 2.8727 | -0.3359 | |
| 0.00 | 0.00 | -0.3158 | ||
| 0.00 | 0.00 | -0.2934 |
Pengajuan 13F dan Dana
Formulir ini diajukan pada 2014-02-18 untuk periode pelaporan 2013-12-31. Klik ikon tautan untuk melihat riwayat transaksi selengkapnya.
Tingkatkan ke versi premium untuk membuka data premium dan ekspor ke Excel. ![]() .
.
| Keamanan | Ketik | Harga Saham Rata-rata | Saham (MM) |
ΔSaham (%) |
ΔSaham (%) |
Nilai ($MM) |
Portpolyo (%) |
ΔPortofolio (%) |
|
|---|---|---|---|---|---|---|---|---|---|
| KMI / Kinder Morgan, Inc. | 0.20 | 8.68 | 7.11 | 10.00 | 4.3921 | -0.6008 | |||
| WMB / The Williams Companies, Inc. | 0.14 | 10.10 | 5.54 | 16.78 | 3.4197 | -0.2421 | |||
| GE / General Electric Company | 0.18 | 29.49 | 4.92 | 51.96 | 3.0351 | 0.5375 | |||
| MMP / Magellan Midstream Partners L.P. | 0.07 | 9.93 | 4.74 | 23.26 | 2.9277 | -0.0424 | |||
| BIP / Brookfield Infrastructure Partners L.P. - Limited Partnership | 0.12 | 8.53 | 4.65 | 11.96 | 2.8727 | -0.3359 | |||
| ORCL / Oracle Corporation | 0.12 | 16.29 | 4.57 | 34.14 | 2.8190 | 0.1909 | |||
| ESRX / Express Scripts Holding Co. | 0.06 | 14.87 | 4.49 | 30.54 | 2.7709 | 0.1165 | |||
| BAMH / Brookfield Finance Inc - 4.625% NT REDEEM 16/10/2080 USD 25 | 0.11 | 11.02 | 4.26 | 15.28 | 2.6320 | -0.2231 | |||
| SYY / Sysco Corporation | 0.12 | 0.57 | 4.18 | 14.06 | 2.5801 | -0.2487 | |||
| AAPL / Apple Inc. | 0.01 | 25.66 | 4.06 | 47.85 | 2.5085 | 0.3869 | |||
| BPR / Brookfield Property REIT Inc. | 0.19 | 9.95 | 3.84 | 13.14 | 2.3708 | -0.2496 | |||
| NGG / National Grid plc - Depositary Receipt (Common Stock) | 0.06 | 6.51 | 3.80 | 17.80 | 2.3455 | -0.1444 | |||
| JNJ / Johnson & Johnson | 0.04 | 24.00 | 3.74 | 31.04 | 2.3066 | 0.1054 | |||
| PM / Philip Morris International Inc. | 0.04 | 6.11 | 3.53 | 6.78 | 2.1794 | -0.3730 | |||
| BRK.B / Berkshire Hathaway Inc. | 0.03 | 17.51 | 3.51 | 22.71 | 2.1652 | -0.0413 | |||
| SEP / Spectra Energy Partners LP | 0.07 | 7.34 | 3.17 | 10.94 | 1.9596 | -0.2492 | |||
| MKL / Markel Group Inc. | 0.01 | -1.93 | 3.09 | 9.92 | 1.9084 | -0.2627 | |||
| BWP / Boardwalk Pipeline Partners L.P | 0.12 | 9.96 | 3.06 | -7.62 | 1.8874 | -0.6674 | |||
| MCD / McDonald's Corporation | 0.03 | 38.49 | 2.99 | 39.66 | 1.8479 | 0.1933 | |||
| WFC / Wells Fargo & Company | 0.06 | 27.52 | 2.83 | 40.13 | 1.7485 | 0.1881 | |||
| ABB / ABB Ltd. - ADR | 0.10 | 8.55 | 2.75 | 22.26 | 1.6991 | -0.0388 | |||
| ABBV / AbbVie Inc. | 0.05 | 16.92 | 2.62 | 38.04 | 1.6176 | 0.1522 | |||
| VIG / Vanguard Specialized Funds - Vanguard Dividend Appreciation ETF | 0.03 | -0.55 | 2.40 | 7.49 | 1.4799 | -0.2418 | |||
| GOOGL / Alphabet Inc. | 0.00 | 60.74 | 2.28 | 105.68 | 1.4083 | 0.5521 | |||
| NOV / NOV Inc. | 0.03 | 8.17 | 2.27 | 10.15 | 1.4003 | -0.1894 | |||
| QCOM / QUALCOMM Incorporated | 0.03 | 35.40 | 2.23 | 49.36 | 1.3749 | 0.2238 | |||
| KO / The Coca-Cola Company | 0.05 | 56.13 | 2.17 | 70.31 | 1.3385 | 0.3557 | |||
| EMR / Emerson Electric Co. | 0.03 | 13.00 | 2.09 | 22.59 | 1.2897 | -0.0258 | |||
| DIS / The Walt Disney Company | 0.03 | 94.52 | 1.91 | 130.36 | 1.1805 | 0.5397 | |||
| GSK / GSK plc - Depositary Receipt (Common Stock) | 0.04 | 0.88 | 1.89 | 7.33 | 1.1656 | -0.1924 | |||
| XOM / Exxon Mobil Corporation | 0.02 | 37.49 | 1.83 | 61.74 | 1.1274 | 0.2557 | |||
| IBM / International Business Machines Corporation | 0.01 | 13.68 | 1.75 | 15.13 | 1.0804 | -0.0931 | |||
| BDX / Becton, Dickinson and Company | 0.01 | -1.48 | 1.65 | 8.83 | 1.0193 | -0.1519 | |||
| C.WSA / Citigroup, Inc. | 0.01 | 64.24 | 1.62 | 92.05 | 0.9996 | 0.3487 | |||
| PEP / PepsiCo, Inc. | 0.02 | 11.49 | 1.61 | 16.35 | 0.9971 | -0.0745 | |||
| ITW / Illinois Tool Works Inc. | 0.02 | 0.34 | 1.58 | 10.57 | 0.9755 | -0.1278 | |||
| MSFT / Microsoft Corporation | 0.04 | 1.97 | 1.58 | 14.61 | 0.9736 | -0.0887 | |||
| CSCO / Cisco Systems, Inc. | 0.07 | -6.88 | 1.47 | -10.83 | 0.9045 | -0.3640 | |||
| CME / CME Group Inc. | 0.02 | 0.00 | 1.45 | 6.22 | 0.8958 | -0.1588 | |||
| PETM / | 0.02 | 1.36 | 0.8378 | 0.8378 | |||||
| MMM / 3M Company | 0.01 | 155.01 | 1.36 | 199.34 | 0.8372 | 0.4874 | |||
| PAYX / Paychex, Inc. | 0.03 | 25.33 | 1.32 | 40.30 | 0.8168 | 0.0888 | |||
| ABT / Abbott Laboratories | 0.03 | 0.07 | 1.32 | 15.51 | 0.8137 | -0.0672 | |||
| WFC.WS / Wells Fargo & Co. (Warrant) | 0.08 | 0.00 | 1.24 | 13.23 | 0.7662 | -0.0800 | |||
| RDS.B / Shell Plc - ADR | 0.02 | 91.81 | 1.24 | 109.29 | 0.7650 | 0.3079 | |||
| RTX / RTX Corporation | 0.01 | 82.95 | 1.24 | 92.98 | 0.7637 | 0.2688 | |||
| NVS / Novartis AG - Depositary Receipt (Common Stock) | 0.02 | 36.83 | 1.23 | 43.44 | 0.7563 | 0.0970 | |||
| MCK / McKesson Corporation | 0.01 | 32.45 | 1.22 | 66.62 | 0.7551 | 0.7551 | |||
| GD / General Dynamics Corporation | 0.01 | 212.76 | 1.22 | 241.34 | 0.7545 | 0.7545 | |||
| CVX / Chevron Corporation | 0.01 | 138.84 | 1.12 | 145.83 | 0.6921 | 0.6921 | |||
| 847560109 / Spectra Energy Corp. | 0.03 | 47.82 | 1.05 | 53.89 | 0.6470 | 0.1213 | |||
| CL / Colgate-Palmolive Company | 0.02 | 63.48 | 1.00 | 79.79 | 0.6205 | 0.1889 | |||
| HD / The Home Depot, Inc. | 0.01 | 75.17 | 0.99 | 90.21 | 0.6118 | 0.6118 | |||
| T / AT&T Inc. | 0.03 | 21.60 | 0.98 | 26.48 | 0.6075 | 0.0069 | |||
| OMC / Omnicom Group Inc. | 0.01 | 90.93 | 0.97 | 123.84 | 0.5970 | 0.5970 | |||
| CHKP / Check Point Software Technologies Ltd. | 0.01 | 0.96 | 0.5902 | 0.5902 | |||||
| O / Realty Income Corporation | 0.03 | 13.41 | 0.95 | 6.49 | 0.5871 | -0.1023 | |||
| SLB / Schlumberger Limited | 0.01 | 204.71 | 0.93 | 211.33 | 0.5766 | 0.5766 | |||
| BH / Biglari Holdings Inc. | 0.00 | 5.92 | 0.91 | 29.99 | 0.5594 | 0.0212 | |||
| DHR / Danaher Corporation | 0.01 | 14.65 | 0.87 | 27.67 | 0.5384 | 0.0111 | |||
| VZ / Verizon Communications Inc. | 0.02 | 19.30 | 0.81 | 25.66 | 0.5019 | 0.0024 | |||
| ACN / Accenture plc | 0.01 | 199.20 | 0.80 | 233.61 | 0.4964 | 0.4964 | |||
| GILD / Gilead Sciences, Inc. | 0.01 | -5.82 | 0.79 | 12.38 | 0.4877 | 0.4877 | |||
| KMI.WS / Kinder Morgan, Inc. Warrants | 0.19 | 15.59 | 0.75 | -5.65 | 0.4643 | -0.1510 | |||
| INTC / Intel Corporation | 0.03 | -24.53 | 0.74 | -14.52 | 0.4581 | -0.2120 | |||
| WMT / Walmart Inc. | 0.01 | 4.75 | 0.74 | 11.48 | 0.4556 | -0.0555 | |||
| JOE / The St. Joe Company | 0.04 | 28.70 | 0.68 | 26.01 | 0.4217 | 0.0032 | |||
| BEN / Franklin Resources, Inc. | 0.01 | 63.73 | 0.68 | 86.98 | 0.4167 | 0.4167 | |||
| EBAY / eBay Inc. | 0.01 | 6.93 | 0.67 | 5.19 | 0.4130 | 0.4130 | |||
| V / Visa Inc. | 0.00 | 0.00 | 0.66 | 16.37 | 0.4081 | 0.4081 | |||
| COST / Costco Wholesale Corporation | 0.01 | 0.64 | 0.3970 | 0.3970 | |||||
| LMT / Lockheed Martin Corporation | 0.00 | -5.36 | 0.63 | 10.33 | 0.3890 | 0.3890 | |||
| PFE / Pfizer Inc. | 0.02 | 0.55 | 0.3389 | 0.3389 | |||||
| UPS / United Parcel Service, Inc. | 0.00 | 0.00 | 0.50 | 15.10 | 0.3105 | 0.3105 | |||
| COP / ConocoPhillips | 0.01 | 13.53 | 0.50 | 15.31 | 0.3068 | 0.3068 | |||
| KRFT / | 0.01 | 46.28 | 0.47 | 50.00 | 0.2926 | 0.0487 | |||
| ADP / Automatic Data Processing, Inc. | 0.01 | 80.06 | 0.47 | 100.86 | 0.2877 | 0.1086 | |||
| BUD / Anheuser-Busch InBev SA/NV - Depositary Receipt (Common Stock) | 0.00 | 47.46 | 0.46 | 58.02 | 0.2859 | 0.2859 | |||
| SPY / SPDR S&P 500 ETF | 0.00 | 0.00 | 0.46 | 9.83 | 0.2828 | -0.0392 | |||
| MDLZ / Mondelez International, Inc. | 0.01 | 33.52 | 0.45 | 50.00 | 0.2797 | 0.0465 | |||
| PG / The Procter & Gamble Company | 0.01 | 6.80 | 0.45 | 15.17 | 0.2766 | 0.2766 | |||
| JPM / JPMorgan Chase & Co. | 0.01 | -83.41 | 0.45 | -81.62 | 0.2754 | -2.0867 | |||
| DOW / Dow Inc. | 0.01 | 4.25 | 0.42 | 15.75 | 0.2587 | -0.0208 | |||
| AXP / American Express Company | 0.00 | 0.00 | 0.41 | 20.00 | 0.2556 | -0.0108 | |||
| POST / Post Holdings, Inc. | 0.01 | 12.90 | 0.41 | 38.00 | 0.2556 | 0.2556 | |||
| BK / The Bank of New York Mellon Corporation | 0.01 | -3.62 | 0.39 | 11.30 | 0.2433 | -0.0301 | |||
| COV / | 0.01 | 0.38 | 0.2315 | 0.2315 | |||||
| BAX / Baxter International Inc. | 0.01 | 0.37 | 0.2309 | 0.2309 | |||||
| CMCSA / Comcast Corporation | 0.01 | 0.00 | 0.37 | 15.05 | 0.2266 | -0.0197 | |||
| FAST / Fastenal Company | 0.01 | 0.85 | 0.34 | -4.76 | 0.2099 | 0.2099 | |||
| SBUX / Starbucks Corporation | 0.00 | 35.04 | 0.33 | 37.60 | 0.2056 | 0.2056 | |||
| UNH / UnitedHealth Group Incorporated | 0.00 | 0.00 | 0.33 | 5.16 | 0.2013 | -0.0381 | |||
| GWW / W.W. Grainger, Inc. | 0.00 | 0.32 | 0.2000 | 0.2000 | |||||
| CHRW / C.H. Robinson Worldwide, Inc. | 0.01 | 0.96 | 0.32 | -0.93 | 0.1982 | -0.0520 | |||
| GIS / General Mills, Inc. | 0.01 | 0.29 | 0.1778 | 0.1778 | |||||
| EPD / Enterprise Products Partners L.P. - Limited Partnership | 0.00 | 0.00 | 0.28 | 8.66 | 0.1704 | -0.0257 | |||
| ORLY / O'Reilly Automotive, Inc. | 0.00 | 0.26 | 0.1587 | 0.1587 | |||||
| / Weight Watchers International, Inc. | 0.01 | 1.25 | 0.25 | -10.68 | 0.1550 | -0.0620 | |||
| MDT / Medtronic plc | 0.00 | -27.78 | 0.22 | -22.22 | 0.1383 | -0.0841 | |||
| NSC / Norfolk Southern Corporation | 0.00 | 0.22 | 0.1377 | 0.1377 | |||||
| BP / BP p.l.c. - Depositary Receipt (Common Stock) | 0.00 | -100.00 | 0.00 | -100.00 | -0.8354 | ||||
| EXPD / Expeditors International of Washington, Inc. | 0.00 | -100.00 | 0.00 | -100.00 | -0.2934 | ||||
| TGT / Target Corporation | 0.00 | -100.00 | 0.00 | -100.00 | -0.8454 | ||||
| AMAT / Applied Materials, Inc. | 0.00 | -100.00 | 0.00 | -100.00 | -0.3158 | ||||
| MLM / Martin Marietta Materials, Inc. | 0.00 | -100.00 | 0.00 | -100.00 | -0.2447 |