Mga Batayang Estadistika
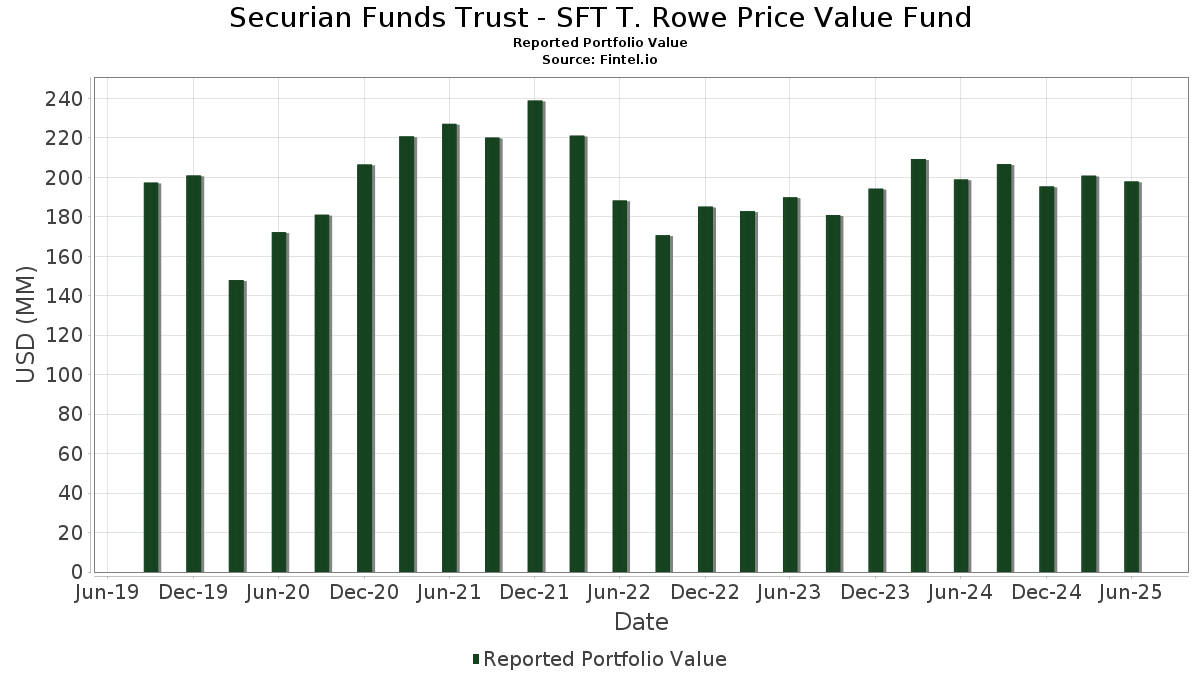
| Nilai Portofolio | $ 197,874,548 |
| Posisi Saat Ini | 102 |
Kepemilikan Terbaru, Kinerja, AUM (dari 13F, 13D)
Securian Funds Trust - SFT T. Rowe Price Value Fund telah mengungkapkan total kepemilikan 102 dalam pengajuan SEC terbaru mereka. Nilai portofolio terbaru dihitung sebesar $ 197,874,548 USD. Aset yang Dikelola (AUM) sebenarnya adalah nilai ini ditambah kas (yang tidak diungkapkan). Aset-aset utama Securian Funds Trust - SFT T. Rowe Price Value Fund adalah JPMorgan Chase & Co. (US:JPM) , Berkshire Hathaway Inc. (US:BRK.B) , Keysight Technologies, Inc. (US:KEYS) , Deere & Company (US:DE) , and The Charles Schwab Corporation (US:SCHW) . Posisi baru Securian Funds Trust - SFT T. Rowe Price Value Fund meliputi: Alphabet Inc. (US:GOOGL) , Quest Diagnostics Incorporated (IT:1QDX) , .
Peningkatan Tertinggi Kuartal Ini
Kami menggunakan perubahan dalam alokasi portofolio karena ini adalah metrik yang paling bermakna. Perubahan dapat disebabkan oleh perdagangan atau perubahan harga saham.
| Keamanan | Saham (MM) |
Nilai (Juta Dolar AS) |
Portfolio % | ΔPorsyento ng Portfolio |
|---|---|---|---|---|
| 0.02 | 3.66 | 1.8501 | 1.6049 | |
| 0.01 | 2.41 | 1.2167 | 1.2167 | |
| 0.00 | 1.74 | 0.8766 | 0.8766 | |
| 0.01 | 2.25 | 1.1376 | 0.7303 | |
| 0.03 | 7.63 | 3.8548 | 0.6074 | |
| 0.01 | 1.11 | 0.5610 | 0.5610 | |
| 0.02 | 3.39 | 1.7125 | 0.4842 | |
| 0.01 | 2.61 | 1.3170 | 0.4409 | |
| 0.01 | 2.70 | 1.3646 | 0.4127 | |
| 0.00 | 0.81 | 0.4083 | 0.4083 |
Penurunan Tertinggi Kuartal Ini
Kami menggunakan perubahan dalam alokasi portofolio karena ini adalah metrik yang paling bermakna. Perubahan dapat disebabkan oleh perdagangan atau perubahan harga saham.
| Keamanan | Saham (MM) |
Nilai (Juta Dolar AS) |
Portfolio % | ΔPorsyento ng Portfolio |
|---|---|---|---|---|
| 0.01 | 2.01 | 1.0165 | -1.2312 | |
| 0.01 | 2.28 | 1.1531 | -0.9729 | |
| 0.16 | 3.32 | 1.6771 | -0.9402 | |
| 0.03 | 1.92 | 0.9677 | -0.6009 | |
| 0.01 | 6.51 | 3.2884 | -0.5655 | |
| 0.01 | 1.32 | 0.6652 | -0.5222 | |
| 0.00 | 0.28 | 0.1420 | -0.4580 | |
| 0.01 | 1.10 | 0.5563 | -0.4302 | |
| 0.00 | 0.54 | 0.2717 | -0.3696 | |
| 0.01 | 0.73 | 0.3693 | -0.3434 |
Pengajuan 13F dan Dana
Formulir ini diajukan pada 2025-08-19 untuk periode pelaporan 2025-06-30. Klik ikon tautan untuk melihat riwayat transaksi selengkapnya.
Tingkatkan ke versi premium untuk membuka data premium dan ekspor ke Excel. ![]() .
.
| Keamanan | Ketik | Harga Saham Rata-rata | Saham (MM) |
ΔSaham (%) |
ΔSaham (%) |
Nilai ($MM) |
Portpolyo (%) |
ΔPortofolio (%) |
|
|---|---|---|---|---|---|---|---|---|---|
| JPM / JPMorgan Chase & Co. | 0.03 | -0.31 | 7.63 | 17.81 | 3.8548 | 0.6074 | |||
| BRK.B / Berkshire Hathaway Inc. | 0.01 | -7.15 | 6.51 | -15.31 | 3.2884 | -0.5655 | |||
| KEYS / Keysight Technologies, Inc. | 0.03 | 0.78 | 4.21 | 10.27 | 2.1253 | 0.2122 | |||
| DE / Deere & Company | 0.01 | 0.43 | 3.78 | 8.82 | 1.9070 | 0.1674 | |||
| SCHW / The Charles Schwab Corporation | 0.04 | -0.35 | 3.70 | 16.15 | 1.8701 | 0.2720 | |||
| AMZN / Amazon.com, Inc. | 0.02 | 377.14 | 3.66 | 725.00 | 1.8501 | 1.6049 | |||
| ALL / The Allstate Corporation | 0.02 | 13.31 | 3.58 | 10.14 | 1.8056 | 0.1787 | |||
| WAB / Westinghouse Air Brake Technologies Corporation | 0.02 | 0.86 | 3.52 | 16.43 | 1.7788 | 0.2624 | |||
| TXN / Texas Instruments Incorporated | 0.02 | 8.50 | 3.45 | 25.36 | 1.7398 | 0.3623 | |||
| AME / AMETEK, Inc. | 0.02 | -0.93 | 3.44 | 4.15 | 1.7353 | 0.0815 | |||
| ICE / Intercontinental Exchange, Inc. | 0.02 | 30.11 | 3.39 | 38.41 | 1.7125 | 0.4842 | |||
| KVUE / Kenvue Inc. | 0.16 | -27.13 | 3.32 | -36.39 | 1.6771 | -0.9402 | |||
| SHW / The Sherwin-Williams Company | 0.01 | 6.25 | 3.30 | 4.47 | 1.6652 | 0.0832 | |||
| PG / The Procter & Gamble Company | 0.02 | 17.17 | 3.13 | 9.56 | 1.5802 | 0.1483 | |||
| NSC / Norfolk Southern Corporation | 0.01 | -0.69 | 3.02 | 7.33 | 1.5238 | 0.1146 | |||
| PH / Parker-Hannifin Corporation | 0.00 | 3.78 | 2.88 | 19.27 | 1.4535 | 0.2437 | |||
| COR / Cencora, Inc. | 0.01 | -24.36 | 2.82 | -18.46 | 1.4239 | -0.3089 | |||
| XEL / Xcel Energy Inc. | 0.04 | -0.66 | 2.79 | -4.46 | 1.4082 | -0.0544 | |||
| COP / ConocoPhillips | 0.03 | 14.46 | 2.77 | -2.19 | 1.3999 | -0.0207 | |||
| MCD / McDonald's Corporation | 0.01 | -14.92 | 2.72 | -20.42 | 1.3741 | -0.3397 | |||
| TRV / The Travelers Companies, Inc. | 0.01 | 40.64 | 2.70 | 42.29 | 1.3646 | 0.4127 | |||
| LIN / Linde plc | 0.01 | 1.78 | 2.68 | 2.56 | 1.3552 | 0.0436 | |||
| AZO / AutoZone, Inc. | 0.00 | -0.42 | 2.66 | -3.06 | 1.3440 | -0.0319 | |||
| BAC / Bank of America Corporation | 0.06 | -4.64 | 2.63 | 8.15 | 1.3261 | 0.1089 | |||
| THC / Tenet Healthcare Corporation | 0.01 | 8.77 | 2.62 | 42.36 | 1.3223 | 0.4002 | |||
| GE / General Electric Company | 0.01 | 16.03 | 2.61 | 49.28 | 1.3170 | 0.4409 | |||
| HD / The Home Depot, Inc. | 0.01 | 12.68 | 2.61 | 12.76 | 1.3165 | 0.1573 | |||
| RRC / Range Resources Corporation | 0.06 | -2.47 | 2.57 | -0.66 | 1.2953 | 0.0010 | |||
| MDLZ / Mondelez International, Inc. | 0.04 | 6.45 | 2.56 | 5.79 | 1.2908 | 0.0799 | |||
| AXP / American Express Company | 0.01 | -4.89 | 2.48 | 12.76 | 1.2539 | 0.1502 | |||
| ELV / Elevance Health, Inc. | 0.01 | -12.47 | 2.47 | -21.73 | 1.2480 | -0.3345 | |||
| GILD / Gilead Sciences, Inc. | 0.02 | 45.42 | 2.47 | 43.87 | 1.2457 | 0.3864 | |||
| UNP / Union Pacific Corporation | 0.01 | 5.39 | 2.43 | 2.62 | 1.2254 | 0.0404 | |||
| GOOGL / Alphabet Inc. | 0.01 | 2.41 | 1.2167 | 1.2167 | |||||
| IP / International Paper Company | 0.05 | 1.39 | 2.37 | -11.02 | 1.1956 | -0.1377 | |||
| CVX / Chevron Corporation | 0.02 | 55.32 | 2.32 | 32.95 | 1.1737 | 0.2975 | |||
| AEE / Ameren Corporation | 0.02 | 4.42 | 2.32 | -0.13 | 1.1717 | 0.0074 | |||
| UNH / UnitedHealth Group Incorporated | 0.01 | -9.62 | 2.28 | -46.17 | 1.1531 | -0.9729 | |||
| GOOG / Alphabet Inc. | 0.01 | 126.10 | 2.25 | 184.70 | 1.1376 | 0.7303 | |||
| SLB / Schlumberger Limited | 0.06 | 19.64 | 2.16 | -3.23 | 1.0908 | -0.0283 | |||
| ADI / Analog Devices, Inc. | 0.01 | -3.38 | 2.04 | 14.04 | 1.0300 | 0.1335 | |||
| FI / Fiserv, Inc. | 0.01 | -42.51 | 2.01 | -55.11 | 1.0165 | -1.2312 | |||
| RSG / Republic Services, Inc. | 0.01 | -1.06 | 1.93 | 0.73 | 0.9733 | 0.0145 | |||
| AZN / AstraZeneca PLC - Depositary Receipt (Common Stock) | 0.03 | -35.59 | 1.92 | -38.77 | 0.9677 | -0.6009 | |||
| PSA / Public Storage | 0.01 | 0.00 | 1.91 | -1.95 | 0.9625 | -0.0119 | |||
| PKI / Revvity Inc. | 0.02 | -18.35 | 1.85 | -25.33 | 0.9347 | -0.3082 | |||
| CI / The Cigna Group | 0.01 | -11.48 | 1.79 | -11.02 | 0.9014 | -0.1044 | |||
| MSFT / Microsoft Corporation | 0.00 | 1.74 | 0.8766 | 0.8766 | |||||
| TMUS / T-Mobile US, Inc. | 0.01 | 14.26 | 1.72 | 2.08 | 0.8678 | 0.0239 | |||
| CL / Colgate-Palmolive Company | 0.02 | -25.69 | 1.71 | -27.89 | 0.8630 | -0.3252 | |||
| VLO / Valero Energy Corporation | 0.01 | 16.99 | 1.71 | 19.12 | 0.8620 | 0.1434 | |||
| US21871X1090 / Corebridge Financial, Inc. | 0.05 | -0.60 | 1.70 | 11.73 | 0.8562 | 0.0959 | |||
| ALC / Alcon Inc. | 0.02 | 44.34 | 1.67 | 34.27 | 0.8429 | 0.2196 | |||
| ODFL / Old Dominion Freight Line, Inc. | 0.01 | 3.66 | 1.62 | 1.69 | 0.8188 | 0.0196 | |||
| BDX / Becton, Dickinson and Company | 0.01 | 14.70 | 1.61 | -13.78 | 0.8125 | -0.1225 | |||
| LHX / L3Harris Technologies, Inc. | 0.01 | -15.91 | 1.59 | 0.82 | 0.8034 | 0.0121 | |||
| KEY / KeyCorp | 0.09 | 0.00 | 1.57 | 8.98 | 0.7910 | 0.0703 | |||
| KLAC / KLA Corporation | 0.00 | -0.18 | 1.51 | 31.53 | 0.7608 | 0.1867 | |||
| ROST / Ross Stores, Inc. | 0.01 | -25.81 | 1.47 | -25.91 | 0.7408 | -0.2519 | |||
| CMCSA / Comcast Corporation | 0.04 | 138.77 | 1.42 | 131.16 | 0.7159 | 0.4082 | |||
| WMT / Walmart Inc. | 0.01 | -7.25 | 1.41 | 3.30 | 0.7110 | 0.0278 | |||
| GS / The Goldman Sachs Group, Inc. | 0.00 | 0.00 | 1.34 | 29.50 | 0.6765 | 0.1582 | |||
| NOC / Northrop Grumman Corporation | 0.00 | 0.57 | 1.32 | -1.86 | 0.6660 | -0.0071 | |||
| FTI / TechnipFMC plc | 0.04 | 16.10 | 1.32 | 26.15 | 0.6654 | 0.1420 | |||
| XOM / Exxon Mobil Corporation | 0.01 | -38.65 | 1.32 | -44.41 | 0.6652 | -0.5222 | |||
| WELL / Welltower Inc. | 0.01 | 72.92 | 1.28 | 73.47 | 0.6443 | 0.2757 | |||
| DLTR / Dollar Tree, Inc. | 0.01 | -14.67 | 1.27 | 12.52 | 0.6401 | 0.0758 | |||
| BALL / Ball Corporation | 0.02 | 129.90 | 1.25 | 87.41 | 0.6316 | 0.2773 | |||
| C / Citigroup Inc. | 0.01 | -14.73 | 1.23 | 2.24 | 0.6223 | 0.0182 | |||
| CB / Chubb Limited | 0.00 | 20.47 | 1.22 | 15.61 | 0.6174 | 0.0872 | |||
| CPAY / Corpay, Inc. | 0.00 | 0.00 | 1.20 | -4.91 | 0.6069 | -0.0262 | |||
| ESS / Essex Property Trust, Inc. | 0.00 | 48.82 | 1.18 | 37.53 | 0.5963 | 0.1661 | |||
| FERG / Ferguson Enterprises Inc. | 0.01 | -37.64 | 1.15 | -15.27 | 0.5829 | -0.0998 | |||
| ATO / Atmos Energy Corporation | 0.01 | 0.00 | 1.15 | -0.26 | 0.5808 | 0.0026 | |||
| FCX / Freeport-McMoRan Inc. | 0.03 | 0.00 | 1.14 | 14.53 | 0.5735 | 0.0764 | |||
| 1QDX / Quest Diagnostics Incorporated | 0.01 | 1.11 | 0.5610 | 0.5610 | |||||
| ABT / Abbott Laboratories | 0.01 | -53.49 | 1.10 | -34.62 | 0.5563 | -0.4302 | |||
| PINS / Pinterest, Inc. | 0.03 | 6.39 | 1.07 | 23.02 | 0.5427 | 0.1050 | |||
| TSCO / Tractor Supply Company | 0.02 | -0.81 | 1.07 | -4.96 | 0.5413 | -0.0243 | |||
| CME / CME Group Inc. | 0.00 | 0.00 | 1.06 | 3.94 | 0.5335 | 0.0238 | |||
| TE Connectivity PLC / EC (IE000IVNQZ81) | 0.01 | -32.54 | 1.04 | -19.50 | 0.5255 | -0.1223 | |||
| NLY / Annaly Capital Management, Inc. | 0.05 | 0.00 | 1.02 | -7.33 | 0.5173 | -0.0368 | |||
| PPG / PPG Industries, Inc. | 0.01 | -18.98 | 1.02 | -15.72 | 0.5149 | -0.0915 | |||
| V / Visa Inc. | 0.00 | -37.92 | 1.01 | -37.11 | 0.5076 | -0.2934 | |||
| EFX / Equifax Inc. | 0.00 | -8.10 | 1.00 | -2.05 | 0.5056 | -0.0072 | |||
| VICI / VICI Properties Inc. | 0.03 | 0.00 | 1.00 | -0.10 | 0.5033 | 0.0034 | |||
| PSX / Phillips 66 | 0.01 | -3.58 | 0.98 | -6.86 | 0.4942 | -0.0324 | |||
| AWK / American Water Works Company, Inc. | 0.01 | -7.88 | 0.98 | -13.10 | 0.4924 | -0.0702 | |||
| OC / Owens Corning | 0.01 | 0.00 | 0.84 | -3.68 | 0.4233 | -0.0130 | |||
| COF / Capital One Financial Corporation | 0.00 | 0.81 | 0.4083 | 0.4083 | |||||
| INTC / Intel Corporation | 0.04 | -2.32 | 0.80 | -3.72 | 0.4054 | -0.0122 | |||
| FANG / Diamondback Energy, Inc. | 0.01 | -40.15 | 0.73 | -48.56 | 0.3693 | -0.3434 | |||
| DHR / Danaher Corporation | 0.00 | -22.06 | 0.73 | -24.95 | 0.3680 | -0.1183 | |||
| SO / The Southern Company | 0.01 | 160.01 | 0.70 | 233.49 | 0.3524 | 0.2523 | |||
| ROK / Rockwell Automation, Inc. | 0.00 | -48.93 | 0.64 | -34.29 | 0.3232 | -0.1654 | |||
| ACN / Accenture plc | 0.00 | -56.10 | 0.54 | -57.94 | 0.2717 | -0.3696 | |||
| META / Meta Platforms, Inc. | 0.00 | -50.00 | 0.52 | 173.02 | 0.2609 | 0.1497 | |||
| MET / MetLife, Inc. | 0.01 | -36.23 | 0.50 | -36.13 | 0.2502 | -0.1386 | |||
| GVMXX / State Street Institutional Investment Trust - State Street Institutional US Govt Money Market Fnd Premier Cls | 0.43 | 31.45 | 0.43 | 31.60 | 0.2167 | 0.0531 | |||
| PGR / The Progressive Corporation | 0.00 | 0.00 | 0.30 | -5.75 | 0.1492 | -0.0079 | |||
| FNV / Franco-Nevada Corporation | 0.00 | -77.43 | 0.28 | -76.51 | 0.1420 | -0.4580 | |||
| US76105Y1091 / T. Rowe Price Government Reserve Fund | 0.17 | 28,529.50 | 0.17 | 0.0867 | 0.0864 |