Mga Batayang Estadistika
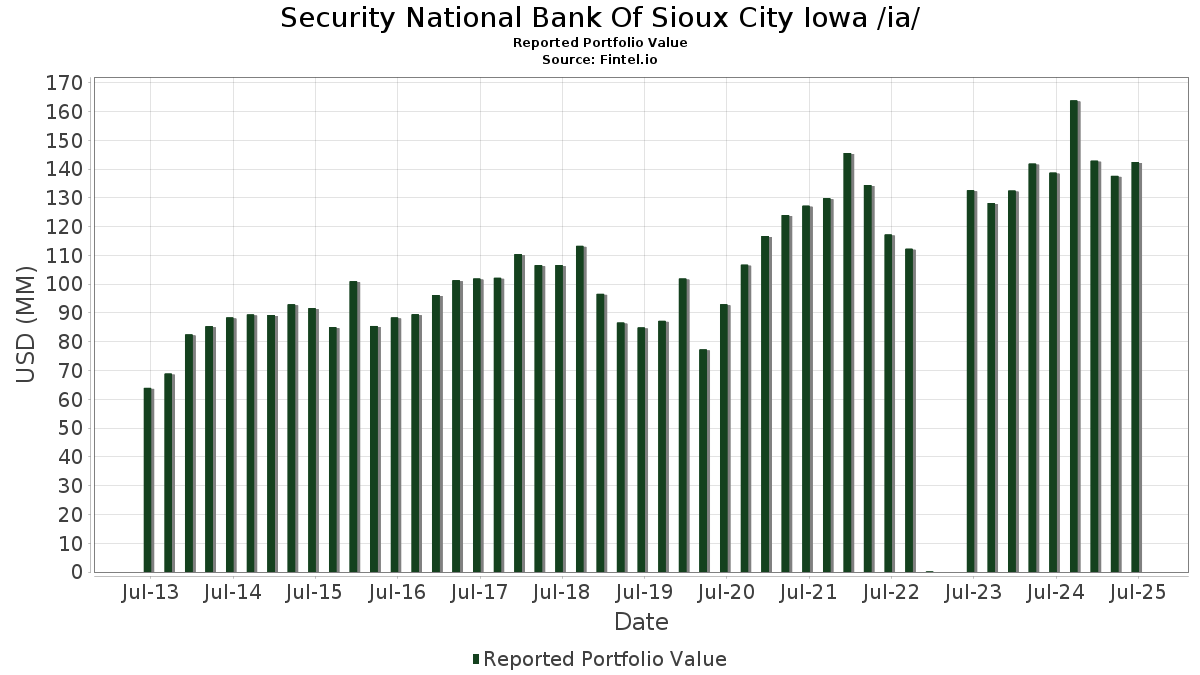
| Nilai Portofolio | $ 142,453,646 |
| Posisi Saat Ini | 87 |
Kepemilikan Terbaru, Kinerja, AUM (dari 13F, 13D)
Security National Bank Of Sioux City Iowa /ia/ telah mengungkapkan total kepemilikan 87 dalam pengajuan SEC terbaru mereka. Nilai portofolio terbaru dihitung sebesar $ 142,453,646 USD. Aset yang Dikelola (AUM) sebenarnya adalah nilai ini ditambah kas (yang tidak diungkapkan). Aset-aset utama Security National Bank Of Sioux City Iowa /ia/ adalah Microsoft Corporation (US:MSFT) , Apple Inc. (US:AAPL) , Berkshire Hathaway Inc. (US:BRK.B) , Oracle Corporation (US:ORCL) , and Berkshire Hathaway Inc. (US:BRK.A) . Posisi baru Security National Bank Of Sioux City Iowa /ia/ meliputi: Alliant Energy Corporation (US:LNT) , .
Peningkatan Tertinggi Kuartal Ini
Kami menggunakan perubahan dalam alokasi portofolio karena ini adalah metrik yang paling bermakna. Perubahan dapat disebabkan oleh perdagangan atau perubahan harga saham.
| Keamanan | Saham (MM) |
Nilai (Juta Dolar AS) |
Portfolio % | ΔPorsyento ng Portfolio |
|---|---|---|---|---|
| 0.01 | 1.21 | 0.4575 | 0.4575 | |
| 0.01 | 0.43 | 0.3007 | 0.3007 | |
| 0.02 | 1.34 | 0.5069 | 0.0981 | |
| 0.01 | 1.94 | 1.3636 | 0.0588 | |
| 0.01 | 3.35 | 1.2626 | 0.0097 |
Penurunan Tertinggi Kuartal Ini
Kami menggunakan perubahan dalam alokasi portofolio karena ini adalah metrik yang paling bermakna. Perubahan dapat disebabkan oleh perdagangan atau perubahan harga saham.
| Keamanan | Saham (MM) |
Nilai (Juta Dolar AS) |
Portfolio % | ΔPorsyento ng Portfolio |
|---|---|---|---|---|
| 0.01 | 6.05 | 2.2817 | -2.7689 | |
| 0.00 | 5.10 | 1.9238 | -2.1374 | |
| 0.01 | 2.66 | 1.0013 | -1.3587 | |
| 0.03 | 3.42 | 1.2891 | -1.3416 | |
| 0.02 | 8.02 | 3.0259 | -1.2754 | |
| 0.03 | 2.99 | 1.1294 | -1.2123 | |
| 0.02 | 4.17 | 1.5730 | -1.0709 | |
| 0.01 | 2.86 | 1.0775 | -0.9772 | |
| 0.02 | 3.08 | 1.1602 | -0.9714 | |
| 0.02 | 2.85 | 1.0735 | -0.9649 |
Pengajuan 13F dan Dana
Formulir ini diajukan pada 2025-08-15 untuk periode pelaporan 2025-06-30. Klik ikon tautan untuk melihat riwayat transaksi selengkapnya.
Tingkatkan ke versi premium untuk membuka data premium dan ekspor ke Excel. ![]() .
.
| Keamanan | Ketik | Harga Saham Rata-rata | Saham (MM) |
ΔSaham (%) |
ΔSaham (%) |
Nilai ($MM) |
Portpolyo (%) |
ΔPortofolio (%) |
|
|---|---|---|---|---|---|---|---|---|---|
| MSFT / Microsoft Corporation | 0.02 | 2.30 | 8.02 | 35.56 | 3.0259 | -1.2754 | |||
| AAPL / Apple Inc. | 0.03 | -0.07 | 6.43 | -7.70 | 4.5168 | -0.5488 | |||
| BRK.B / Berkshire Hathaway Inc. | 0.01 | -4.56 | 6.05 | -12.95 | 2.2817 | -2.7689 | |||
| ORCL / Oracle Corporation | 0.02 | 0.18 | 5.14 | 56.64 | 1.9390 | -0.4460 | |||
| BRK.A / Berkshire Hathaway Inc. | 0.00 | 0.00 | 5.10 | -8.73 | 1.9238 | -2.1374 | |||
| GOOGL / Alphabet Inc. | 0.02 | 0.60 | 4.17 | 14.65 | 1.5730 | -1.0709 | |||
| WMT / Walmart Inc. | 0.04 | 1.03 | 3.53 | 12.55 | 1.3293 | -0.9469 | |||
| AFL / Aflac Incorporated | 0.03 | -0.45 | 3.42 | -5.58 | 1.2891 | -1.3416 | |||
| JPM / JPMorgan Chase & Co. | 0.01 | 64.31 | 3.35 | 94.20 | 1.2626 | 0.0097 | |||
| QCOM / QUALCOMM Incorporated | 0.02 | 1.16 | 3.08 | 4.88 | 1.1602 | -0.9714 | |||
| XOM / Exxon Mobil Corporation | 0.03 | 2.53 | 2.99 | -7.08 | 1.1294 | -1.2123 | |||
| ADP / Automatic Data Processing, Inc. | 0.01 | 0.11 | 2.86 | 1.06 | 1.0775 | -0.9772 | |||
| ABBV / AbbVie Inc. | 0.02 | 14.55 | 2.85 | 1.46 | 1.0735 | -0.9649 | |||
| LDOS / Leidos Holdings, Inc. | 0.02 | -0.67 | 2.70 | 16.13 | 1.0185 | -0.6714 | |||
| TMO / Thermo Fisher Scientific Inc. | 0.01 | 0.34 | 2.66 | -18.23 | 1.0013 | -1.3587 | |||
| ABT / Abbott Laboratories | 0.02 | 8.88 | 2.54 | 11.68 | 0.9594 | -0.6966 | |||
| DLR / Digital Realty Trust, Inc. | 0.01 | 0.14 | 2.49 | 21.84 | 0.9384 | -0.5458 | |||
| TEL / TE Connectivity plc | 0.01 | 0.66 | 2.45 | 20.15 | 0.9245 | -0.5583 | |||
| HD / The Home Depot, Inc. | 0.01 | 0.27 | 2.32 | 0.30 | 0.8741 | -0.8050 | |||
| NKE / NIKE, Inc. | 0.03 | 4.91 | 2.25 | 17.41 | 0.8495 | -0.5447 | |||
| STT / State Street Corporation | 0.02 | -0.15 | 2.20 | 18.58 | 0.8306 | -0.5190 | |||
| JNJ / Johnson & Johnson | 0.01 | -0.10 | 2.20 | -8.00 | 0.8288 | -0.9069 | |||
| BAH / Booz Allen Hamilton Holding Corporation | 0.02 | 0.22 | 2.12 | -0.19 | 0.7984 | -0.7433 | |||
| CMI / Cummins Inc. | 0.01 | -0.16 | 2.10 | 4.33 | 0.7909 | -0.6699 | |||
| O / Realty Income Corporation | 0.04 | 0.20 | 2.06 | -0.48 | 0.7781 | -0.7287 | |||
| VZ / Verizon Communications Inc. | 0.05 | 2.35 | 2.06 | -2.37 | 0.7763 | -0.7559 | |||
| VEA / Vanguard Tax-Managed Funds - Vanguard FTSE Developed Markets ETF | 0.04 | -3.30 | 2.00 | 8.47 | 0.7537 | -0.5854 | |||
| UNP / Union Pacific Corporation | 0.01 | -0.05 | 1.96 | -2.63 | 0.7389 | -0.7237 | |||
| J / Jacobs Solutions Inc. | 0.01 | -0.51 | 1.94 | 8.19 | 1.3636 | 0.0588 | |||
| CTSH / Cognizant Technology Solutions Corporation | 0.02 | 0.18 | 1.93 | 2.22 | 0.7279 | -0.6447 | |||
| LIN / Linde plc | 0.00 | -0.81 | 1.90 | -0.05 | 0.7174 | -0.6657 | |||
| GIS / General Mills, Inc. | 0.04 | 0.84 | 1.90 | -12.61 | 0.7163 | -0.8633 | |||
| NUE / Nucor Corporation | 0.01 | -0.28 | 1.82 | 7.31 | 0.6867 | -0.5460 | |||
| DHR / Danaher Corporation | 0.01 | 0.01 | 1.77 | -3.59 | 0.6686 | -0.6683 | |||
| RTX / RTX Corporation | 0.01 | -1.11 | 1.74 | 9.00 | 0.6580 | -0.5050 | |||
| WAB / Westinghouse Air Brake Technologies Corporation | 0.01 | -0.67 | 1.73 | 14.62 | 0.6508 | -0.4429 | |||
| CMCSA / Comcast Corporation | 0.05 | 1.29 | 1.67 | -2.06 | 0.6290 | -0.6081 | |||
| VLTO / Veralto Corporation | 0.02 | -0.21 | 1.58 | 3.40 | 0.5966 | -0.5155 | |||
| PYPL / PayPal Holdings, Inc. | 0.02 | 7.60 | 1.57 | 22.52 | 0.5911 | -0.3383 | |||
| TROW / T. Rowe Price Group, Inc. | 0.02 | 2.92 | 1.56 | 8.10 | 0.5893 | -0.4610 | |||
| EA / Electronic Arts Inc. | 0.01 | -0.27 | 1.50 | 10.22 | 0.5654 | -0.4232 | |||
| CL / Colgate-Palmolive Company | 0.02 | -0.25 | 1.46 | -3.24 | 0.5523 | -0.5474 | |||
| LRCX / Lam Research Corporation | 0.01 | 20.02 | 1.37 | 60.75 | 0.5161 | -0.1028 | |||
| JEPI / J.P. Morgan Exchange-Traded Fund Trust - JPMorgan Equity Premium Income ETF | 0.02 | 140.17 | 1.34 | 139.15 | 0.5069 | 0.0981 | |||
| PRU / Prudential Financial, Inc. | 0.01 | 0.23 | 1.31 | -3.60 | 0.4947 | -0.4939 | |||
| IBB / iShares Trust - iShares Biotechnology ETF | 0.01 | 0.52 | 1.23 | -0.57 | 0.4632 | -0.4345 | |||
| SNA / Snap-on Incorporated | 0.00 | -0.08 | 1.21 | -7.76 | 0.4576 | -0.4981 | |||
| AMZN / Amazon.com, Inc. | 0.01 | 1.21 | 0.4575 | 0.4575 | |||||
| PEP / PepsiCo, Inc. | 0.01 | -0.54 | 1.21 | -12.44 | 0.4568 | -0.5482 | |||
| ITW / Illinois Tool Works Inc. | 0.00 | 0.23 | 1.20 | -0.08 | 0.4516 | -0.4193 | |||
| TKR / The Timken Company | 0.02 | -0.65 | 1.10 | 0.27 | 0.4157 | -0.3830 | |||
| SLB / Schlumberger Limited | 0.03 | 0.45 | 1.10 | -18.77 | 0.4131 | -0.5670 | |||
| MINT / PIMCO ETF Trust - PIMCO Enhanced Short Maturity Active Exchange-Traded Fund | 0.01 | 0.00 | 1.05 | -0.10 | 0.3942 | -0.3660 | |||
| KO / The Coca-Cola Company | 0.01 | -13.43 | 0.99 | -14.52 | 0.3732 | -0.4677 | |||
| IP / International Paper Company | 0.02 | 0.24 | 0.97 | -12.06 | 0.3661 | -0.4356 | |||
| KMB / Kimberly-Clark Corporation | 0.01 | 0.14 | 0.93 | -9.16 | 0.3515 | -0.3946 | |||
| BND / Vanguard Bond Index Funds - Vanguard Total Bond Market ETF | 0.01 | -1.45 | 0.75 | -1.18 | 0.2832 | -0.2692 | |||
| ET / Energy Transfer LP - Limited Partnership | 0.03 | 0.00 | 0.60 | -2.46 | 0.2244 | -0.2190 | |||
| FTV / Fortive Corporation | 0.01 | -0.62 | 0.56 | -29.22 | 0.2103 | -0.3622 | |||
| NVDA / NVIDIA Corporation | 0.00 | -56.61 | 0.54 | -36.74 | 0.3787 | -0.2410 | |||
| VUG / Vanguard Index Funds - Vanguard Growth ETF | 0.00 | -0.41 | 0.54 | 17.72 | 0.2030 | -0.1292 | |||
| LMT / Lockheed Martin Corporation | 0.00 | 0.00 | 0.52 | 3.78 | 0.1967 | -0.1688 | |||
| META / Meta Platforms, Inc. | 0.00 | 0.00 | 0.48 | 28.30 | 0.1795 | -0.0906 | |||
| AMTM / Amentum Holdings, Inc. | 0.02 | 12.91 | 0.46 | 46.77 | 0.1716 | -0.0541 | |||
| LNT / Alliant Energy Corporation | 0.01 | 0.43 | 0.3007 | 0.3007 | |||||
| CAT / Caterpillar Inc. | 0.00 | 23.15 | 0.41 | 45.42 | 0.1558 | -0.0513 | |||
| SUN / Sunoco LP - Limited Partnership | 0.01 | 0.00 | 0.38 | -7.64 | 0.1415 | -0.1539 | |||
| VTV / Vanguard Index Funds - Vanguard Value ETF | 0.00 | -0.71 | 0.37 | 1.64 | 0.1402 | -0.1257 | |||
| TSN / Tyson Foods, Inc. | 0.01 | -71.41 | 0.36 | -74.98 | 0.1369 | -0.9152 | |||
| ORI / Old Republic International Corporation | 0.01 | 0.00 | 0.36 | -1.93 | 0.1343 | -0.1297 | |||
| SPY / SPDR S&P 500 ETF | 0.00 | 0.00 | 0.33 | 10.47 | 0.1235 | -0.0919 | |||
| EPD / Enterprise Products Partners L.P. - Limited Partnership | 0.01 | -8.77 | 0.31 | -17.07 | 0.1155 | -0.1531 | |||
| JNK / SPDR Series Trust - SPDR Bloomberg High Yield Bond ETF | 0.00 | -5.47 | 0.30 | -3.49 | 0.1148 | -0.1145 | |||
| SCHD / Schwab Strategic Trust - Schwab U.S. Dividend Equity ETF | 0.01 | 0.00 | 0.29 | -5.18 | 0.1106 | -0.1143 | |||
| FI / Fiserv, Inc. | 0.00 | -1.16 | 0.29 | -22.69 | 0.1105 | -0.1655 | |||
| DVY / iShares Trust - iShares Select Dividend ETF | 0.00 | -15.26 | 0.29 | -16.33 | 0.1084 | -0.1409 | |||
| VWO / Vanguard International Equity Index Funds - Vanguard FTSE Emerging Markets ETF | 0.01 | -0.79 | 0.27 | 8.40 | 0.1025 | -0.0797 | |||
| V / Visa Inc. | 0.00 | 0.00 | 0.27 | 1.50 | 0.1019 | -0.0919 | |||
| MRK / Merck & Co., Inc. | 0.00 | 13.87 | 0.26 | 0.39 | 0.0980 | -0.0900 | |||
| NNI / Nelnet, Inc. | 0.00 | 0.00 | 0.25 | 9.48 | 0.0959 | -0.0734 | |||
| XLK / The Select Sector SPDR Trust - The Technology Select Sector SPDR Fund | 0.00 | 0.00 | 0.25 | 22.82 | 0.0955 | -0.0545 | |||
| VOO / Vanguard Index Funds - Vanguard S&P 500 ETF | 0.00 | -1.62 | 0.24 | 8.60 | 0.0908 | -0.0701 | |||
| PAA / Plains All American Pipeline, L.P. - Limited Partnership | 0.01 | 0.00 | 0.23 | -8.47 | 0.0857 | -0.0945 | |||
| VB / Vanguard Index Funds - Vanguard Small-Cap ETF | 0.00 | -0.43 | 0.22 | 6.25 | 0.0836 | -0.0678 | |||
| VNQ / Vanguard Specialized Funds - Vanguard Real Estate ETF | 0.00 | -0.26 | 0.20 | -1.93 | 0.0767 | -0.0740 | |||
| DE / Deere & Company | 0.00 | -9.63 | 0.20 | -1.96 | 0.0755 | -0.0731 | |||
| NGL / NGL Energy Partners LP - Limited Partnership | 0.02 | 0.00 | 0.09 | -5.26 | 0.0340 | -0.0356 | |||
| PG / The Procter & Gamble Company | 0.00 | -100.00 | 0.00 | 0.0000 | |||||
| OXY / Occidental Petroleum Corporation | 0.00 | -100.00 | 0.00 | 0.0000 | |||||
| TGT / Target Corporation | 0.00 | -100.00 | 0.00 | 0.0000 |