Mga Batayang Estadistika
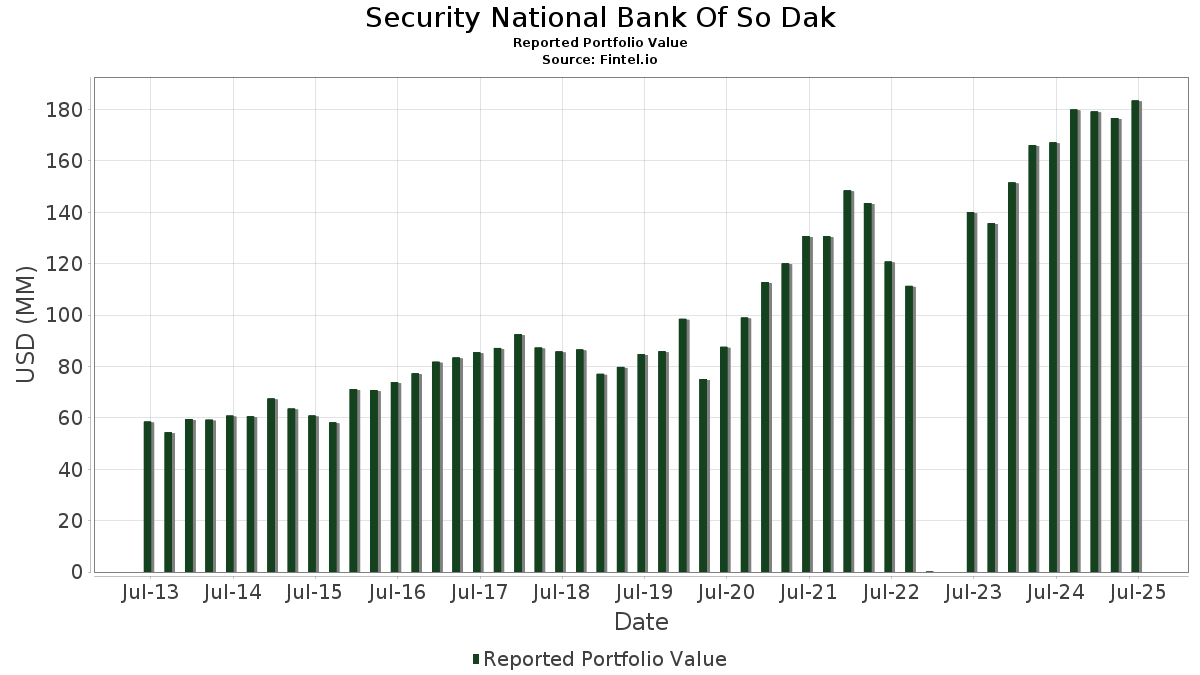
| Nilai Portofolio | $ 183,521,267 |
| Posisi Saat Ini | 111 |
Kepemilikan Terbaru, Kinerja, AUM (dari 13F, 13D)
Security National Bank Of So Dak telah mengungkapkan total kepemilikan 111 dalam pengajuan SEC terbaru mereka. Nilai portofolio terbaru dihitung sebesar $ 183,521,267 USD. Aset yang Dikelola (AUM) sebenarnya adalah nilai ini ditambah kas (yang tidak diungkapkan). Aset-aset utama Security National Bank Of So Dak adalah Microsoft Corporation (US:MSFT) , Apple Inc. (US:AAPL) , Berkshire Hathaway Inc. (US:BRK.B) , Oracle Corporation (US:ORCL) , and Alphabet Inc. (US:GOOGL) . Posisi baru Security National Bank Of So Dak meliputi: Intuitive Surgical, Inc. (US:ISRG) , .
Peningkatan Tertinggi Kuartal Ini
Kami menggunakan perubahan dalam alokasi portofolio karena ini adalah metrik yang paling bermakna. Perubahan dapat disebabkan oleh perdagangan atau perubahan harga saham.
| Keamanan | Saham (MM) |
Nilai (Juta Dolar AS) |
Portfolio % | ΔPorsyento ng Portfolio |
|---|---|---|---|---|
| 0.02 | 3.18 | 1.7317 | 0.4718 | |
| 0.04 | 5.15 | 2.8044 | 0.1437 | |
| 0.00 | 0.22 | 0.1199 | 0.1199 | |
| 0.00 | 0.29 | 0.0886 | 0.0886 | |
| 0.01 | 2.60 | 0.8082 | 0.0786 | |
| 0.00 | 0.24 | 0.0760 | 0.0760 | |
| 0.00 | 0.21 | 0.0652 | 0.0652 | |
| 0.00 | 0.70 | 0.3824 | 0.0475 | |
| 0.00 | 0.38 | 0.2056 | 0.0300 |
Penurunan Tertinggi Kuartal Ini
Kami menggunakan perubahan dalam alokasi portofolio karena ini adalah metrik yang paling bermakna. Perubahan dapat disebabkan oleh perdagangan atau perubahan harga saham.
| Keamanan | Saham (MM) |
Nilai (Juta Dolar AS) |
Portfolio % | ΔPorsyento ng Portfolio |
|---|---|---|---|---|
| 0.04 | 9.17 | 2.8468 | -2.7687 | |
| 0.02 | 7.83 | 2.4295 | -2.4549 | |
| 0.01 | 3.49 | 1.0825 | -1.3546 | |
| 0.02 | 10.60 | 3.2888 | -1.2621 | |
| 0.04 | 3.70 | 1.1481 | -1.0795 | |
| 0.02 | 3.12 | 0.9669 | -1.0597 | |
| 0.03 | 4.41 | 1.3690 | -1.0369 | |
| 0.03 | 5.50 | 1.7072 | -1.0027 | |
| 0.03 | 2.79 | 0.8671 | -0.9358 | |
| 0.05 | 4.55 | 1.4125 | -0.9344 |
Pengajuan 13F dan Dana
Formulir ini diajukan pada 2025-08-15 untuk periode pelaporan 2025-06-30. Klik ikon tautan untuk melihat riwayat transaksi selengkapnya.
Tingkatkan ke versi premium untuk membuka data premium dan ekspor ke Excel. ![]() .
.
| Keamanan | Ketik | Harga Saham Rata-rata | Saham (MM) |
ΔSaham (%) |
ΔSaham (%) |
Nilai ($MM) |
Portpolyo (%) |
ΔPortofolio (%) |
|
|---|---|---|---|---|---|---|---|---|---|
| MSFT / Microsoft Corporation | 0.02 | -0.58 | 10.60 | 31.73 | 3.2888 | -1.2621 | |||
| AAPL / Apple Inc. | 0.04 | 0.05 | 9.17 | -7.59 | 2.8468 | -2.7687 | |||
| BRK.B / Berkshire Hathaway Inc. | 0.02 | -0.59 | 7.83 | -9.33 | 2.4295 | -2.4549 | |||
| ORCL / Oracle Corporation | 0.03 | 0.08 | 7.00 | 56.51 | 2.1716 | -0.3577 | |||
| GOOGL / Alphabet Inc. | 0.03 | 0.77 | 5.50 | 14.85 | 1.7072 | -1.0027 | |||
| VT / Vanguard International Equity Index Funds - Vanguard Total World Stock ETF | 0.04 | -1.26 | 5.15 | 9.44 | 2.8044 | 0.1437 | |||
| WMT / Walmart Inc. | 0.05 | -1.50 | 4.55 | 9.72 | 1.4125 | -0.9344 | |||
| QCOM / QUALCOMM Incorporated | 0.03 | 0.04 | 4.41 | 3.72 | 1.3690 | -1.0369 | |||
| AFL / Aflac Incorporated | 0.04 | -0.94 | 3.70 | -6.07 | 1.1481 | -1.0795 | |||
| TMO / Thermo Fisher Scientific Inc. | 0.01 | -0.64 | 3.49 | -19.04 | 1.0825 | -1.3546 | |||
| RTX / RTX Corporation | 0.02 | -1.94 | 3.44 | 8.09 | 1.0665 | -0.7320 | |||
| ABT / Abbott Laboratories | 0.02 | -0.19 | 3.34 | 2.36 | 1.0372 | -0.8102 | |||
| ADP / Automatic Data Processing, Inc. | 0.01 | -0.73 | 3.24 | 0.22 | 1.0049 | -0.8232 | |||
| LIN / Linde plc | 0.01 | -3.78 | 3.20 | -3.03 | 0.9942 | -0.8751 | |||
| NVDA / NVIDIA Corporation | 0.02 | -2.09 | 3.18 | 42.72 | 1.7317 | 0.4718 | |||
| ABBV / AbbVie Inc. | 0.02 | -1.83 | 3.12 | -13.01 | 0.9669 | -1.0597 | |||
| J / Jacobs Solutions Inc. | 0.02 | -1.18 | 2.96 | 7.47 | 0.9195 | -0.6404 | |||
| XOM / Exxon Mobil Corporation | 0.03 | -3.28 | 2.79 | -12.34 | 0.8671 | -0.9358 | |||
| LDOS / Leidos Holdings, Inc. | 0.02 | 0.05 | 2.79 | 16.97 | 0.8668 | -0.4840 | |||
| HD / The Home Depot, Inc. | 0.01 | 0.29 | 2.78 | 0.36 | 0.8626 | -0.7046 | |||
| JPM / JPMorgan Chase & Co. | 0.01 | 0.26 | 2.74 | 18.50 | 0.8514 | -0.4583 | |||
| JNJ / Johnson & Johnson | 0.02 | -1.87 | 2.70 | -9.62 | 0.8373 | -0.8514 | |||
| DLR / Digital Realty Trust, Inc. | 0.02 | 0.26 | 2.67 | 21.99 | 0.8302 | -0.4105 | |||
| AMZN / Amazon.com, Inc. | 0.01 | 75.12 | 2.60 | 101.94 | 0.8082 | 0.0786 | |||
| UNP / Union Pacific Corporation | 0.01 | -0.46 | 2.54 | -3.05 | 0.7884 | -0.6941 | |||
| CMI / Cummins Inc. | 0.01 | -0.13 | 2.49 | 4.37 | 0.7718 | -0.5764 | |||
| NKE / NIKE, Inc. | 0.03 | 0.22 | 2.45 | 12.18 | 0.7606 | -0.4756 | |||
| STT / State Street Corporation | 0.02 | 0.49 | 2.29 | 19.34 | 0.7106 | -0.3746 | |||
| DHR / Danaher Corporation | 0.01 | 0.34 | 2.28 | -3.30 | 0.7090 | -0.6277 | |||
| CL / Colgate-Palmolive Company | 0.02 | -0.43 | 2.26 | -3.38 | 0.7000 | -0.6210 | |||
| WAB / Westinghouse Air Brake Technologies Corporation | 0.01 | -2.03 | 2.13 | 13.12 | 0.6609 | -0.4044 | |||
| NUE / Nucor Corporation | 0.02 | -1.89 | 2.05 | 5.62 | 0.6355 | -0.4614 | |||
| VLTO / Veralto Corporation | 0.02 | -1.39 | 1.99 | 2.15 | 0.6189 | -0.4855 | |||
| CTSH / Cognizant Technology Solutions Corporation | 0.02 | 0.61 | 1.92 | 2.62 | 0.5967 | -0.4632 | |||
| BAH / Booz Allen Hamilton Holding Corporation | 0.02 | 0.28 | 1.88 | -0.11 | 0.5842 | -0.4824 | |||
| TEL / TE Connectivity plc | 0.01 | 0.46 | 1.83 | 19.90 | 0.5688 | -0.2959 | |||
| ITW / Illinois Tool Works Inc. | 0.01 | -2.62 | 1.80 | -2.96 | 0.5599 | -0.4914 | |||
| PEP / PepsiCo, Inc. | 0.01 | -4.06 | 1.77 | -15.49 | 0.5488 | -0.6353 | |||
| KO / The Coca-Cola Company | 0.02 | -0.26 | 1.73 | -1.48 | 0.5366 | -0.4561 | |||
| JEPI / J.P. Morgan Exchange-Traded Fund Trust - JPMorgan Equity Premium Income ETF | 0.03 | 46.24 | 1.70 | 45.50 | 0.5274 | -0.1333 | |||
| VUG / Vanguard Index Funds - Vanguard Growth ETF | 0.00 | -3.15 | 1.68 | 14.49 | 0.5227 | -0.3095 | |||
| GIS / General Mills, Inc. | 0.03 | -1.09 | 1.68 | -14.31 | 0.5205 | -0.5865 | |||
| VZ / Verizon Communications Inc. | 0.04 | -1.11 | 1.62 | -5.70 | 0.5037 | -0.4697 | |||
| PRU / Prudential Financial, Inc. | 0.01 | -5.82 | 1.51 | -9.40 | 0.4697 | -0.4754 | |||
| O / Realty Income Corporation | 0.03 | -0.48 | 1.49 | -1.20 | 0.4621 | -0.3902 | |||
| TKR / The Timken Company | 0.02 | -4.26 | 1.46 | -3.32 | 0.4517 | -0.4002 | |||
| SCHG / Schwab Strategic Trust - Schwab U.S. Large-Cap Growth ETF | 0.05 | 0.00 | 1.45 | 16.65 | 0.4503 | -0.2534 | |||
| EA / Electronic Arts Inc. | 0.01 | 0.46 | 1.40 | 11.01 | 0.4349 | -0.2793 | |||
| SNA / Snap-on Incorporated | 0.00 | -1.44 | 1.38 | -9.01 | 0.4298 | -0.4311 | |||
| TROW / T. Rowe Price Group, Inc. | 0.01 | -0.06 | 1.36 | 4.95 | 0.4218 | -0.3106 | |||
| AVGO / Broadcom Inc. | 0.00 | 0.00 | 1.29 | 64.71 | 0.3999 | -0.0429 | |||
| IBB / iShares Trust - iShares Biotechnology ETF | 0.01 | -0.10 | 1.29 | -1.23 | 0.3994 | -0.3373 | |||
| CMCSA / Comcast Corporation | 0.04 | -0.74 | 1.27 | -3.95 | 0.3927 | -0.3530 | |||
| VEA / Vanguard Tax-Managed Funds - Vanguard FTSE Developed Markets ETF | 0.02 | 0.00 | 1.21 | 12.09 | 0.3743 | -0.2340 | |||
| VTV / Vanguard Index Funds - Vanguard Value ETF | 0.01 | 0.00 | 1.01 | 2.33 | 0.3136 | -0.2451 | |||
| LRCX / Lam Research Corporation | 0.01 | 3.97 | 1.01 | 39.34 | 0.3123 | -0.0966 | |||
| PYPL / PayPal Holdings, Inc. | 0.01 | 1.97 | 1.00 | 16.18 | 0.3100 | -0.1765 | |||
| VB / Vanguard Index Funds - Vanguard Small-Cap ETF | 0.00 | 0.00 | 1.00 | 6.87 | 0.3089 | -0.2180 | |||
| KMB / Kimberly-Clark Corporation | 0.01 | -0.33 | 0.99 | -9.62 | 0.3062 | -0.3116 | |||
| SLB / Schlumberger Limited | 0.03 | -0.30 | 0.96 | -19.41 | 0.2966 | -0.3740 | |||
| DVY / iShares Trust - iShares Select Dividend ETF | 0.01 | -2.73 | 0.95 | -3.86 | 0.2939 | -0.2630 | |||
| IP / International Paper Company | 0.02 | 0.27 | 0.94 | -12.03 | 0.2929 | -0.3137 | |||
| WCN / Waste Connections, Inc. | 0.00 | -2.14 | 0.87 | -6.46 | 0.2700 | -0.2557 | |||
| GOOG / Alphabet Inc. | 0.00 | -0.85 | 0.79 | 12.55 | 0.2450 | -0.1517 | |||
| AXP / American Express Company | 0.00 | 0.00 | 0.70 | 18.61 | 0.3824 | 0.0475 | |||
| FTV / Fortive Corporation | 0.01 | -0.07 | 0.67 | -28.78 | 0.2075 | -0.3238 | |||
| V / Visa Inc. | 0.00 | -2.95 | 0.66 | -1.78 | 0.2063 | -0.1762 | |||
| LLY / Eli Lilly and Company | 0.00 | -8.62 | 0.65 | -13.76 | 0.2025 | -0.2255 | |||
| ALNY / Alnylam Pharmaceuticals, Inc. | 0.00 | 0.00 | 0.65 | 20.74 | 0.2024 | -0.1031 | |||
| AMTM / Amentum Holdings, Inc. | 0.03 | 8.12 | 0.63 | 40.35 | 0.1967 | -0.0589 | |||
| IVV / iShares Trust - iShares Core S&P 500 ETF | 0.00 | -55.20 | 0.58 | -50.51 | 0.1792 | -0.4808 | |||
| CASY / Casey's General Stores, Inc. | 0.00 | 0.00 | 0.56 | 17.58 | 0.1723 | -0.0949 | |||
| VO / Vanguard Index Funds - Vanguard Mid-Cap ETF | 0.00 | 0.00 | 0.55 | 8.20 | 0.1720 | -0.1178 | |||
| EFA / iShares Trust - iShares MSCI EAFE ETF | 0.01 | 0.00 | 0.55 | 9.33 | 0.1712 | -0.1141 | |||
| META / Meta Platforms, Inc. | 0.00 | 0.00 | 0.53 | 28.02 | 0.1647 | -0.0698 | |||
| ORI / Old Republic International Corporation | 0.01 | 0.00 | 0.52 | -2.06 | 0.1626 | -0.1398 | |||
| COST / Costco Wholesale Corporation | 0.00 | -5.49 | 0.51 | -1.16 | 0.1586 | -0.1336 | |||
| WFC / Wells Fargo & Company | 0.01 | 0.00 | 0.46 | 11.49 | 0.1417 | -0.0898 | |||
| CWI / SPDR Index Shares Funds - SPDR MSCI ACWI ex-US ETF | 0.01 | 0.00 | 0.42 | 10.44 | 0.1316 | -0.0856 | |||
| PH / Parker-Hannifin Corporation | 0.00 | -1.15 | 0.42 | 13.86 | 0.1301 | -0.0787 | |||
| CSCO / Cisco Systems, Inc. | 0.01 | -0.03 | 0.40 | 12.61 | 0.1249 | -0.0777 | |||
| VWO / Vanguard International Equity Index Funds - Vanguard FTSE Emerging Markets ETF | 0.01 | -15.62 | 0.40 | -7.71 | 0.1227 | -0.1199 | |||
| NSC / Norfolk Southern Corporation | 0.00 | 0.00 | 0.39 | 7.99 | 0.1218 | -0.0836 | |||
| TSLA / Tesla, Inc. | 0.00 | -0.83 | 0.38 | 21.61 | 0.2056 | 0.0300 | |||
| UNH / UnitedHealth Group Incorporated | 0.00 | -10.95 | 0.37 | -46.94 | 0.1158 | -0.2822 | |||
| PG / The Procter & Gamble Company | 0.00 | -18.69 | 0.37 | -24.08 | 0.1157 | -0.1618 | |||
| NFLX / Netflix, Inc. | 0.00 | -1.12 | 0.36 | 42.40 | 0.1106 | -0.0314 | |||
| SCHD / Schwab Strategic Trust - Schwab U.S. Dividend Equity ETF | 0.01 | 0.00 | 0.34 | -5.26 | 0.1064 | -0.0982 | |||
| QQQ / Invesco QQQ Trust, Series 1 | 0.00 | -50.52 | 0.31 | -41.90 | 0.0971 | -0.2070 | |||
| IJK / iShares Trust - iShares S&P Mid-Cap 400 Growth ETF | 0.00 | 0.00 | 0.29 | 9.40 | 0.0904 | -0.0604 | |||
| HEI / HEICO Corporation | 0.00 | -2.53 | 0.29 | 19.83 | 0.0901 | -0.0472 | |||
| GLW / Corning Incorporated | 0.01 | -0.04 | 0.29 | 14.68 | 0.0900 | -0.0529 | |||
| VNQ / Vanguard Specialized Funds - Vanguard Real Estate ETF | 0.00 | 3.21 | 0.29 | 1.42 | 0.0889 | -0.0707 | |||
| MINT / PIMCO ETF Trust - PIMCO Enhanced Short Maturity Active Exchange-Traded Fund | 0.00 | 0.29 | 0.0886 | 0.0886 | |||||
| TGT / Target Corporation | 0.00 | -80.75 | 0.27 | -81.86 | 0.0828 | -0.7468 | |||
| IBM / International Business Machines Corporation | 0.00 | -0.56 | 0.26 | 18.02 | 0.0813 | -0.0444 | |||
| SPGI / S&P Global Inc. | 0.00 | -1.44 | 0.25 | 2.43 | 0.0786 | -0.0614 | |||
| BND / Vanguard Bond Index Funds - Vanguard Total Bond Market ETF | 0.00 | 0.00 | 0.25 | 0.00 | 0.0769 | -0.0630 | |||
| CVNA / Carvana Co. | 0.00 | -47.50 | 0.25 | -15.41 | 0.0769 | -0.0887 | |||
| HON / Honeywell International Inc. | 0.00 | -11.93 | 0.25 | -3.14 | 0.0768 | -0.0678 | |||
| BMI / Badger Meter, Inc. | 0.00 | 0.24 | 0.0760 | 0.0760 | |||||
| SCHV / Schwab Strategic Trust - Schwab U.S. Large-Cap Value ETF | 0.01 | 0.00 | 0.24 | 3.83 | 0.0760 | -0.0571 | |||
| IJT / iShares Trust - iShares S&P Small-Cap 600 Growth ETF | 0.00 | 0.00 | 0.24 | 7.02 | 0.0759 | -0.0536 | |||
| PFG / Principal Financial Group, Inc. | 0.00 | -3.88 | 0.24 | -9.51 | 0.0740 | -0.0750 | |||
| ADI / Analog Devices, Inc. | 0.00 | -1.69 | 0.23 | 15.84 | 0.0728 | -0.0416 | |||
| CVX / Chevron Corporation | 0.00 | -34.69 | 0.23 | -44.10 | 0.0720 | -0.1629 | |||
| TMUS / T-Mobile US, Inc. | 0.00 | -8.88 | 0.22 | -18.84 | 0.0698 | -0.0865 | |||
| ISRG / Intuitive Surgical, Inc. | 0.00 | 0.22 | 0.1199 | 0.1199 | |||||
| TRV / The Travelers Companies, Inc. | 0.00 | -3.15 | 0.21 | -1.83 | 0.0664 | -0.0572 | |||
| WOR / Worthington Enterprises, Inc. | 0.00 | 0.21 | 0.0652 | 0.0652 | |||||
| ACN / Accenture plc | 0.00 | 0.00 | 0.20 | -4.23 | 0.0636 | -0.0574 | |||
| MRK / Merck & Co., Inc. | 0.00 | -100.00 | 0.00 | 0.0000 | |||||
| VTI / Vanguard Index Funds - Vanguard Total Stock Market ETF | 0.00 | -100.00 | 0.00 | 0.0000 | |||||
| CRM / Salesforce, Inc. | 0.00 | -100.00 | 0.00 | 0.0000 | |||||
| SPY / SPDR S&P 500 ETF | 0.00 | -100.00 | 0.00 | 0.0000 | |||||
| AMGN / Amgen Inc. | 0.00 | -100.00 | 0.00 | 0.0000 |