Mga Batayang Estadistika
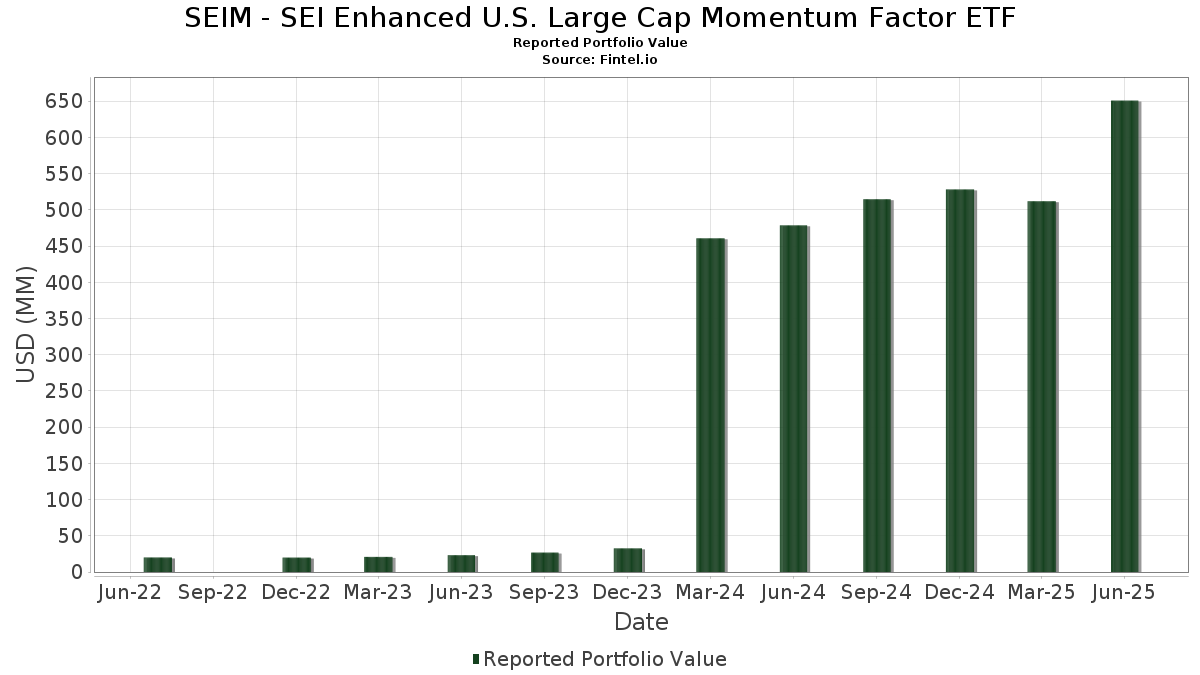
| Nilai Portofolio | $ 650,754,395 |
| Posisi Saat Ini | 66 |
Kepemilikan Terbaru, Kinerja, AUM (dari 13F, 13D)
SEIM - SEI Enhanced U.S. Large Cap Momentum Factor ETF telah mengungkapkan total kepemilikan 66 dalam pengajuan SEC terbaru mereka. Nilai portofolio terbaru dihitung sebesar $ 650,754,395 USD. Aset yang Dikelola (AUM) sebenarnya adalah nilai ini ditambah kas (yang tidak diungkapkan). Aset-aset utama SEIM - SEI Enhanced U.S. Large Cap Momentum Factor ETF adalah NVIDIA Corporation (US:NVDA) , Meta Platforms, Inc. (US:META) , Microsoft Corporation (US:MSFT) , Walmart Inc. (US:WMT) , and Amphenol Corporation (US:APH) . Posisi baru SEIM - SEI Enhanced U.S. Large Cap Momentum Factor ETF meliputi: International Business Machines Corporation (US:IBM) , Philip Morris International Inc. (US:PM) , Veeva Systems Inc. (US:VEEV) , CME Group Inc. (US:CME) , and Rockwell Automation, Inc. (US:ROK) .
Peningkatan Tertinggi Kuartal Ini
Kami menggunakan perubahan dalam alokasi portofolio karena ini adalah metrik yang paling bermakna. Perubahan dapat disebabkan oleh perdagangan atau perubahan harga saham.
| Keamanan | Saham (MM) |
Nilai (Juta Dolar AS) |
Portfolio % | ΔPorsyento ng Portfolio |
|---|---|---|---|---|
| 0.06 | 16.87 | 2.5771 | 2.5771 | |
| 0.09 | 16.64 | 2.5431 | 2.5431 | |
| 0.05 | 13.19 | 2.0151 | 2.0151 | |
| 0.04 | 12.01 | 1.8346 | 1.8346 | |
| 0.06 | 31.11 | 4.7530 | 1.7703 | |
| 0.19 | 13.10 | 2.0011 | 1.4794 | |
| 0.01 | 17.69 | 2.7035 | 1.4740 | |
| 0.00 | 15.76 | 2.4078 | 1.1401 | |
| 0.02 | 6.22 | 0.9501 | 0.9501 | |
| 0.27 | 4.98 | 0.7611 | 0.7611 |
Penurunan Tertinggi Kuartal Ini
Kami menggunakan perubahan dalam alokasi portofolio karena ini adalah metrik yang paling bermakna. Perubahan dapat disebabkan oleh perdagangan atau perubahan harga saham.
| Keamanan | Saham (MM) |
Nilai (Juta Dolar AS) |
Portfolio % | ΔPorsyento ng Portfolio |
|---|---|---|---|---|
| 0.09 | 18.04 | 2.7567 | -3.3126 | |
| 0.03 | 5.34 | 0.8158 | -2.1353 | |
| 0.01 | 4.34 | 0.6628 | -1.1448 | |
| 0.00 | 0.33 | 0.0504 | -0.5959 | |
| 0.01 | 3.03 | 0.4629 | -0.5956 | |
| 0.08 | 14.86 | 2.2701 | -0.5894 | |
| 0.10 | 10.83 | 1.6549 | -0.5066 | |
| 0.02 | 3.21 | 0.4908 | -0.4845 | |
| 0.17 | 14.36 | 2.1936 | -0.4406 | |
| 0.06 | 13.22 | 2.0201 | -0.4351 |
Pengajuan 13F dan Dana
Formulir ini diajukan pada 2025-08-28 untuk periode pelaporan 2025-06-30. Klik ikon tautan untuk melihat riwayat transaksi selengkapnya.
Tingkatkan ke versi premium untuk membuka data premium dan ekspor ke Excel. ![]() .
.
| Keamanan | Ketik | Harga Saham Rata-rata | Saham (MM) |
ΔSaham (%) |
ΔSaham (%) |
Nilai ($MM) |
Portpolyo (%) |
ΔPortofolio (%) |
|
|---|---|---|---|---|---|---|---|---|---|
| NVDA / NVIDIA Corporation | 0.27 | -14.92 | 43.25 | 24.02 | 6.6076 | -0.1493 | |||
| META / Meta Platforms, Inc. | 0.05 | 8.88 | 34.66 | 39.44 | 5.2963 | 0.4790 | |||
| MSFT / Microsoft Corporation | 0.06 | 52.52 | 31.11 | 102.11 | 4.7530 | 1.7703 | |||
| WMT / Walmart Inc. | 0.19 | 8.63 | 18.84 | 20.99 | 2.8788 | -0.1388 | |||
| APH / Amphenol Corporation | 0.18 | 8.36 | 18.14 | 63.14 | 2.7715 | 0.6170 | |||
| AAPL / Apple Inc. | 0.09 | -37.63 | 18.04 | -42.40 | 2.7567 | -3.3126 | |||
| NFLX / Netflix, Inc. | 0.01 | 94.19 | 17.69 | 178.89 | 2.7035 | 1.4740 | |||
| IBM / International Business Machines Corporation | 0.06 | 16.87 | 2.5771 | 2.5771 | |||||
| PM / Philip Morris International Inc. | 0.09 | 16.64 | 2.5431 | 2.5431 | |||||
| BSX / Boston Scientific Corporation | 0.15 | 8.47 | 16.16 | 15.49 | 2.4692 | -0.2423 | |||
| GS / The Goldman Sachs Group, Inc. | 0.02 | 8.25 | 16.16 | 40.25 | 2.4689 | 0.2362 | |||
| BKNG / Booking Holdings Inc. | 0.00 | 91.69 | 15.76 | 140.91 | 2.4078 | 1.1401 | |||
| COR / Cencora, Inc. | 0.05 | 8.74 | 15.01 | 17.25 | 2.2940 | -0.1873 | |||
| HWM / Howmet Aerospace Inc. | 0.08 | -29.82 | 14.86 | 0.68 | 2.2701 | -0.5894 | |||
| ETR / Entergy Corporation | 0.17 | 8.62 | 14.36 | 5.61 | 2.1936 | -0.4406 | |||
| TT / Trane Technologies plc | 0.03 | 8.70 | 13.83 | 41.12 | 2.1138 | 0.2142 | |||
| ICE / Intercontinental Exchange, Inc. | 0.07 | 8.50 | 13.76 | 15.40 | 2.1022 | -0.2082 | |||
| RMD / ResMed Inc. | 0.05 | 8.55 | 13.56 | 25.11 | 2.0716 | -0.0285 | |||
| BK / The Bank of New York Mellon Corporation | 0.15 | 8.32 | 13.55 | 17.67 | 2.0707 | -0.1612 | |||
| ANET / Arista Networks Inc | 0.13 | -9.81 | 13.44 | 19.09 | 2.0539 | -0.1333 | |||
| GRMN / Garmin Ltd. | 0.06 | 8.55 | 13.22 | 4.36 | 2.0201 | -0.4351 | |||
| VEEV / Veeva Systems Inc. | 0.05 | 13.19 | 2.0151 | 2.0151 | |||||
| KO / The Coca-Cola Company | 0.19 | 392.43 | 13.10 | 386.48 | 2.0011 | 1.4794 | |||
| APP / AppLovin Corporation | 0.04 | 7.92 | 13.04 | 42.59 | 1.9922 | 0.2202 | |||
| SYF / Synchrony Financial | 0.19 | 8.34 | 12.60 | 36.58 | 1.9259 | 0.1376 | |||
| SYK / Stryker Corporation | 0.03 | 8.17 | 12.08 | 14.97 | 1.8450 | -0.1905 | |||
| CME / CME Group Inc. | 0.04 | 12.01 | 1.8346 | 1.8346 | |||||
| PODD / Insulet Corporation | 0.04 | 9.33 | 11.93 | 30.81 | 1.8225 | 0.0554 | |||
| TPR / Tapestry, Inc. | 0.13 | 8.82 | 11.11 | 35.72 | 1.6982 | 0.1112 | |||
| BRO / Brown & Brown, Inc. | 0.10 | 8.95 | 10.83 | -2.90 | 1.6549 | -0.5066 | |||
| CW / Curtiss-Wright Corporation | 0.02 | 8.03 | 10.38 | 66.35 | 1.5863 | 0.3769 | |||
| GWRE / Guidewire Software, Inc. | 0.04 | 8.25 | 8.86 | 36.04 | 1.3532 | 0.0916 | |||
| WWD / Woodward, Inc. | 0.03 | 8.59 | 8.02 | 45.85 | 1.2248 | 0.1597 | |||
| AXON / Axon Enterprise, Inc. | 0.01 | 8.27 | 7.00 | 70.44 | 1.0696 | 0.2737 | |||
| EWBC / East West Bancorp, Inc. | 0.07 | 8.30 | 6.98 | 21.84 | 1.0665 | -0.0437 | |||
| FOXA / Fox Corporation | 0.12 | 8.31 | 6.92 | 7.23 | 1.0567 | -0.1930 | |||
| EXEL / Exelixis, Inc. | 0.16 | 8.38 | 6.92 | 29.40 | 1.0566 | 0.0209 | |||
| ROK / Rockwell Automation, Inc. | 0.02 | 6.22 | 0.9501 | 0.9501 | |||||
| RL / Ralph Lauren Corporation | 0.02 | 8.57 | 6.12 | 34.89 | 0.9359 | 0.0560 | |||
| GOOGL / Alphabet Inc. | 0.03 | -69.23 | 5.34 | -64.94 | 0.8158 | -2.1353 | |||
| THC / Tenet Healthcare Corporation | 0.03 | 8.26 | 5.12 | 41.66 | 0.7826 | 0.0820 | |||
| WAB / Westinghouse Air Brake Technologies Corporation | 0.02 | 8.60 | 5.01 | 25.35 | 0.7662 | -0.0089 | |||
| SOFI / SoFi Technologies, Inc. | 0.27 | 4.98 | 0.7611 | 0.7611 | |||||
| TJX / The TJX Companies, Inc. | 0.04 | 8.71 | 4.76 | 10.23 | 0.7275 | -0.1096 | |||
| CACI / CACI International Inc | 0.01 | 8.12 | 4.75 | 40.46 | 0.7257 | 0.0705 | |||
| CMI / Cummins Inc. | 0.01 | -55.49 | 4.34 | -53.50 | 0.6628 | -1.1448 | |||
| FOX / Fox Corporation | 0.07 | 8.39 | 3.81 | 6.15 | 0.5828 | -0.1134 | |||
| WELL / Welltower Inc. | 0.02 | 3.63 | 0.5541 | 0.5541 | |||||
| MSI / Motorola Solutions, Inc. | 0.01 | 8.82 | 3.59 | 4.51 | 0.5484 | -0.1171 | |||
| SN / SharkNinja, Inc. | 0.03 | 8.07 | 3.37 | 28.27 | 0.5151 | 0.0058 | |||
| AMZN / Amazon.com, Inc. | 0.01 | 8.25 | 3.24 | 24.79 | 0.4955 | -0.0080 | |||
| UHS / Universal Health Services, Inc. | 0.02 | -33.80 | 3.21 | -36.17 | 0.4908 | -0.4845 | |||
| TOST / Toast, Inc. | 0.07 | 8.45 | 3.15 | 44.80 | 0.4807 | 0.0597 | |||
| PANW / Palo Alto Networks, Inc. | 0.01 | -53.75 | 3.03 | -44.54 | 0.4629 | -0.5956 | |||
| PLTR / Palantir Technologies Inc. | 0.02 | 2.99 | 0.4571 | 0.4571 | |||||
| INTU / Intuit Inc. | 0.00 | 2.70 | 0.4121 | 0.4121 | |||||
| FI / Fiserv, Inc. | 0.02 | 14.19 | 2.63 | -10.86 | 0.4015 | -0.1697 | |||
| FICO / Fair Isaac Corporation | 0.00 | 4.15 | 2.57 | 3.25 | 0.3927 | -0.0897 | |||
| JHG / Janus Henderson Group plc | 0.06 | 8.62 | 2.52 | 16.71 | 0.3853 | -0.0334 | |||
| NDAQ / Nasdaq, Inc. | 0.03 | 8.60 | 2.38 | 28.03 | 0.3637 | 0.0034 | |||
| C / Citigroup Inc. | 0.03 | 8.28 | 2.32 | 29.81 | 0.3548 | 0.0082 | |||
| ABBV / AbbVie Inc. | 0.01 | 14.44 | 2.21 | 1.37 | 0.3381 | -0.0848 | |||
| AFL / Aflac Incorporated | 0.01 | 8.77 | 0.97 | 3.21 | 0.1475 | -0.0338 | |||
| TEAM / Atlassian Corporation | 0.00 | 8.11 | 0.94 | 3.43 | 0.1431 | -0.0323 | |||
| ORCL / Oracle Corporation | 0.00 | 0.66 | 0.1009 | 0.1009 | |||||
| WSM / Williams-Sonoma, Inc. | 0.00 | -90.42 | 0.33 | -90.10 | 0.0504 | -0.5959 |