Mga Batayang Estadistika
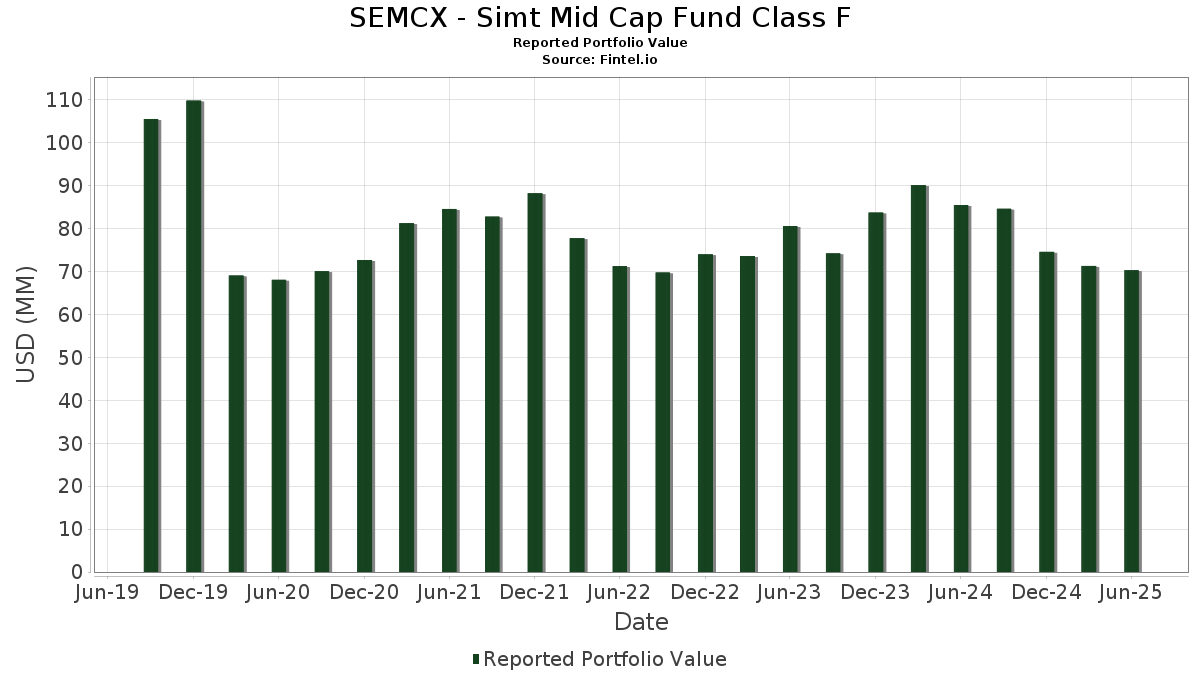
| Nilai Portofolio | $ 70,336,883 |
| Posisi Saat Ini | 289 |
Kepemilikan Terbaru, Kinerja, AUM (dari 13F, 13D)
SEMCX - Simt Mid Cap Fund Class F telah mengungkapkan total kepemilikan 289 dalam pengajuan SEC terbaru mereka. Nilai portofolio terbaru dihitung sebesar $ 70,336,883 USD. Aset yang Dikelola (AUM) sebenarnya adalah nilai ini ditambah kas (yang tidak diungkapkan). Aset-aset utama SEMCX - Simt Mid Cap Fund Class F adalah Keysight Technologies, Inc. (US:KEYS) , SEI DAILY INCOME TRUST GOVERNMENT FUND (#36) (XX:US7839655930) , Cboe Global Markets, Inc. (US:CBOE) , Synchrony Financial (US:SYF) , and The Allstate Corporation (US:ALL) . Posisi baru SEMCX - Simt Mid Cap Fund Class F meliputi: Mueller Industries, Inc. (US:MLI) , Flex Ltd. (US:FLEX) , Halozyme Therapeutics, Inc. (US:HALO) , Broadridge Financial Solutions, Inc. (US:BR) , and Nu Holdings Ltd. (US:NU) .
Peningkatan Tertinggi Kuartal Ini
Kami menggunakan perubahan dalam alokasi portofolio karena ini adalah metrik yang paling bermakna. Perubahan dapat disebabkan oleh perdagangan atau perubahan harga saham.
| Keamanan | Saham (MM) |
Nilai (Juta Dolar AS) |
Portfolio % | ΔPorsyento ng Portfolio |
|---|---|---|---|---|
| 0.03 | 0.55 | 0.7900 | 0.7900 | |
| 0.00 | 0.56 | 0.8060 | 0.7069 | |
| 0.01 | 0.48 | 0.6851 | 0.6851 | |
| 0.01 | 0.43 | 0.6091 | 0.6091 | |
| 0.00 | 0.63 | 0.8936 | 0.4619 | |
| 0.01 | 0.31 | 0.4493 | 0.4493 | |
| 0.31 | 0.4461 | 0.4461 | ||
| 0.00 | 0.30 | 0.4302 | 0.4302 | |
| 0.01 | 0.30 | 0.4299 | 0.4299 | |
| 0.00 | 0.39 | 0.5612 | 0.4250 |
Penurunan Tertinggi Kuartal Ini
Kami menggunakan perubahan dalam alokasi portofolio karena ini adalah metrik yang paling bermakna. Perubahan dapat disebabkan oleh perdagangan atau perubahan harga saham.
| Keamanan | Saham (MM) |
Nilai (Juta Dolar AS) |
Portfolio % | ΔPorsyento ng Portfolio |
|---|---|---|---|---|
| 0.01 | 0.28 | 0.3998 | -0.8392 | |
| 0.00 | 0.09 | 0.1343 | -0.7349 | |
| 0.00 | 0.24 | 0.3369 | -0.6836 | |
| 0.00 | 0.66 | 0.9434 | -0.5908 | |
| 0.00 | 0.73 | 1.0468 | -0.5855 | |
| 0.00 | 0.28 | 0.3935 | -0.4833 | |
| 0.00 | 0.15 | 0.2122 | -0.4666 | |
| 0.00 | 0.09 | 0.1338 | -0.4656 | |
| 0.78 | 0.78 | 1.1189 | -0.4524 | |
| 0.00 | 0.22 | 0.3134 | -0.4360 |
Pengajuan 13F dan Dana
Formulir ini diajukan pada 2025-08-28 untuk periode pelaporan 2025-06-30. Klik ikon tautan untuk melihat riwayat transaksi selengkapnya.
Tingkatkan ke versi premium untuk membuka data premium dan ekspor ke Excel. ![]() .
.
| Keamanan | Ketik | Harga Saham Rata-rata | Saham (MM) |
ΔSaham (%) |
ΔSaham (%) |
Nilai ($MM) |
Portpolyo (%) |
ΔPortofolio (%) |
|
|---|---|---|---|---|---|---|---|---|---|
| KEYS / Keysight Technologies, Inc. | 0.01 | 2.03 | 1.39 | 11.66 | 1.9827 | 0.2177 | |||
| US7839655930 / SEI DAILY INCOME TRUST GOVERNMENT FUND (#36) | 0.78 | -29.24 | 0.78 | -29.27 | 1.1189 | -0.4524 | |||
| CBOE / Cboe Global Markets, Inc. | 0.00 | 0.00 | 0.78 | 3.03 | 1.1161 | 0.0399 | |||
| SYF / Synchrony Financial | 0.01 | 0.00 | 0.76 | 26.21 | 1.0793 | 0.2285 | |||
| ALL / The Allstate Corporation | 0.00 | -2.64 | 0.75 | -5.43 | 1.0703 | -0.0534 | |||
| HWM / Howmet Aerospace Inc. | 0.00 | -55.58 | 0.73 | -36.26 | 1.0468 | -0.5855 | |||
| MTB / M&T Bank Corporation | 0.00 | 0.00 | 0.71 | 8.56 | 1.0134 | 0.0854 | |||
| LNG / Cheniere Energy, Inc. | 0.00 | -41.93 | 0.66 | -38.95 | 0.9434 | -0.5908 | |||
| VEEV / Veeva Systems Inc. | 0.00 | 65.45 | 0.63 | 105.92 | 0.8936 | 0.4619 | |||
| MSCI / MSCI Inc. | 0.00 | 0.00 | 0.61 | 2.00 | 0.8734 | 0.0224 | |||
| RMD / ResMed Inc. | 0.00 | 0.00 | 0.59 | 15.37 | 0.8470 | 0.1167 | |||
| ACM / AECOM | 0.01 | -6.29 | 0.59 | 14.17 | 0.8393 | 0.1080 | |||
| SPG / Simon Property Group, Inc. | 0.00 | 0.00 | 0.57 | -3.24 | 0.8107 | -0.0216 | |||
| ROK / Rockwell Automation, Inc. | 0.00 | 541.51 | 0.56 | 587.80 | 0.8060 | 0.7069 | |||
| EHC / Encompass Health Corporation | 0.00 | -12.03 | 0.56 | 6.43 | 0.8050 | 0.0539 | |||
| XP / XP Inc. | 0.03 | 0.55 | 0.7900 | 0.7900 | |||||
| EA / Electronic Arts Inc. | 0.00 | -21.67 | 0.55 | -13.43 | 0.7828 | -0.1159 | |||
| FFIV / F5, Inc. | 0.00 | -7.02 | 0.51 | 2.82 | 0.7285 | 0.0241 | |||
| PH / Parker-Hannifin Corporation | 0.00 | -7.66 | 0.50 | 6.11 | 0.7208 | 0.0457 | |||
| URI / United Rentals, Inc. | 0.00 | 0.00 | 0.50 | 20.33 | 0.7183 | 0.1245 | |||
| LOPE / Grand Canyon Education, Inc. | 0.00 | 0.00 | 0.50 | 9.45 | 0.7108 | 0.0642 | |||
| EXP / Eagle Materials Inc. | 0.00 | 9.10 | 0.48 | -0.82 | 0.6921 | -0.0002 | |||
| MLI / Mueller Industries, Inc. | 0.01 | 0.48 | 0.6851 | 0.6851 | |||||
| FTI / TechnipFMC plc | 0.01 | 0.00 | 0.48 | 8.88 | 0.6823 | 0.0584 | |||
| IDXX / IDEXX Laboratories, Inc. | 0.00 | 48.33 | 0.48 | 90.04 | 0.6813 | 0.3239 | |||
| TRGP / Targa Resources Corp. | 0.00 | 0.00 | 0.47 | -13.15 | 0.6699 | -0.0967 | |||
| PRI / Primerica, Inc. | 0.00 | 0.00 | 0.46 | -3.99 | 0.6535 | -0.0217 | |||
| VTR / Ventas, Inc. | 0.01 | -10.39 | 0.45 | -17.67 | 0.6454 | -0.1339 | |||
| CLH / Clean Harbors, Inc. | 0.00 | -4.59 | 0.45 | 11.78 | 0.6378 | 0.0714 | |||
| MAA / Mid-America Apartment Communities, Inc. | 0.00 | -2.71 | 0.43 | -14.17 | 0.6146 | -0.0962 | |||
| EQH / Equitable Holdings, Inc. | 0.01 | -9.60 | 0.43 | -2.51 | 0.6110 | -0.0126 | |||
| EIX / Edison International | 0.01 | 0.43 | 0.6091 | 0.6091 | |||||
| DRI / Darden Restaurants, Inc. | 0.00 | 0.00 | 0.42 | 4.71 | 0.6036 | 0.0319 | |||
| CBSH / Commerce Bancshares, Inc. | 0.01 | 0.00 | 0.42 | 0.00 | 0.6028 | 0.0032 | |||
| GWW / W.W. Grainger, Inc. | 0.00 | 0.00 | 0.42 | 5.28 | 0.5984 | 0.0337 | |||
| TSN / Tyson Foods, Inc. | 0.01 | -20.15 | 0.42 | -30.02 | 0.5934 | -0.2491 | |||
| RRX / Regal Rexnord Corporation | 0.00 | -1.21 | 0.41 | 25.84 | 0.5909 | 0.1241 | |||
| ALLE / Allegion plc | 0.00 | 0.00 | 0.41 | 10.48 | 0.5879 | 0.0590 | |||
| RGA / Reinsurance Group of America, Incorporated | 0.00 | -4.71 | 0.41 | -3.99 | 0.5838 | -0.0206 | |||
| CHTR / Charter Communications, Inc. | 0.00 | 0.00 | 0.40 | 10.83 | 0.5707 | 0.0594 | |||
| PEN / Penumbra, Inc. | 0.00 | -7.22 | 0.40 | -11.04 | 0.5648 | -0.0656 | |||
| VRSK / Verisk Analytics, Inc. | 0.00 | 0.00 | 0.40 | 4.77 | 0.5647 | 0.0285 | |||
| GLW / Corning Incorporated | 0.01 | -21.90 | 0.39 | -10.48 | 0.5622 | -0.0605 | |||
| VICI / VICI Properties Inc. | 0.01 | 99.50 | 0.39 | 99.49 | 0.5616 | 0.2817 | |||
| MPC / Marathon Petroleum Corporation | 0.00 | 255.94 | 0.39 | 241.74 | 0.5612 | 0.4250 | |||
| WEC / WEC Energy Group, Inc. | 0.00 | -14.07 | 0.39 | -17.86 | 0.5588 | -0.1171 | |||
| AER / AerCap Holdings N.V. | 0.00 | -3.54 | 0.39 | 10.51 | 0.5554 | 0.0558 | |||
| ES / Eversource Energy | 0.01 | 0.00 | 0.39 | 2.38 | 0.5530 | 0.0165 | |||
| FHN / First Horizon Corporation | 0.02 | -2.02 | 0.39 | 6.91 | 0.5530 | 0.0392 | |||
| WCC / WESCO International, Inc. | 0.00 | -2.85 | 0.39 | 15.96 | 0.5506 | 0.0783 | |||
| LITE / Lumentum Holdings Inc. | 0.00 | 39.71 | 0.38 | 114.04 | 0.5442 | 0.2904 | |||
| EXPE / Expedia Group, Inc. | 0.00 | -43.65 | 0.37 | -43.43 | 0.5285 | -0.4002 | |||
| EME / EMCOR Group, Inc. | 0.00 | 0.00 | 0.37 | 44.71 | 0.5268 | 0.1650 | |||
| PTC / PTC Inc. | 0.00 | 4.45 | 0.36 | 16.13 | 0.5141 | 0.0743 | |||
| YUM / Yum! Brands, Inc. | 0.00 | 0.00 | 0.36 | -5.80 | 0.5104 | -0.0282 | |||
| EQR / Equity Residential | 0.01 | 0.00 | 0.35 | -5.60 | 0.5058 | -0.0273 | |||
| LH / Labcorp Holdings Inc. | 0.00 | -7.48 | 0.35 | 4.52 | 0.4957 | 0.0236 | |||
| AIG / American International Group, Inc. | 0.00 | -4.74 | 0.35 | -5.98 | 0.4939 | -0.0294 | |||
| LSCC / Lattice Semiconductor Corporation | 0.01 | 0.00 | 0.34 | -6.35 | 0.4839 | -0.0309 | |||
| GEN / Gen Digital Inc. | 0.01 | 0.00 | 0.34 | 10.93 | 0.4784 | 0.0492 | |||
| NET / Cloudflare, Inc. | 0.00 | 0.00 | 0.33 | 73.82 | 0.4746 | 0.2032 | |||
| QRVO / Qorvo, Inc. | 0.00 | 33.50 | 0.33 | 56.87 | 0.4733 | 0.1728 | |||
| DECK / Deckers Outdoor Corporation | 0.00 | 37.86 | 0.33 | 27.34 | 0.4661 | 0.1016 | |||
| EXEL / Exelixis, Inc. | 0.01 | -45.85 | 0.32 | -35.33 | 0.4628 | -0.2487 | |||
| PR / Permian Resources Corporation | 0.02 | 34.13 | 0.32 | 32.10 | 0.4594 | 0.1133 | |||
| WTW / Willis Towers Watson Public Limited Company | 0.00 | -2.51 | 0.32 | -11.60 | 0.4580 | -0.0568 | |||
| NBIX / Neurocrine Biosciences, Inc. | 0.00 | 0.00 | 0.32 | -7.80 | 0.4557 | -0.0107 | |||
| DXCM / DexCom, Inc. | 0.00 | -18.97 | 0.32 | 3.61 | 0.4523 | 0.0183 | |||
| PNFP / Pinnacle Financial Partners, Inc. | 0.00 | -0.86 | 0.32 | 3.27 | 0.4518 | 0.0168 | |||
| COR / Cencora, Inc. | 0.00 | -25.71 | 0.32 | -19.85 | 0.4502 | -0.1083 | |||
| FLEX / Flex Ltd. | 0.01 | 0.31 | 0.4493 | 0.4493 | |||||
| AWI / Armstrong World Industries, Inc. | 0.00 | 0.00 | 0.31 | 15.07 | 0.4480 | 0.0619 | |||
| S&P MID 400 EMINI SEP25 PHYSICAL INDEX FUTURE. / DE (N/A) | 0.31 | 0.4461 | 0.4461 | ||||||
| WBS / Webster Financial Corporation | 0.01 | 56.42 | 0.31 | 65.43 | 0.4451 | 0.1781 | |||
| TPR / Tapestry, Inc. | 0.00 | -15.71 | 0.31 | 5.08 | 0.4437 | 0.0242 | |||
| DTE / DTE Energy Company | 0.00 | -10.97 | 0.31 | -14.72 | 0.4388 | -0.0725 | |||
| ADC / Agree Realty Corporation | 0.00 | -3.26 | 0.31 | -8.38 | 0.4368 | -0.0373 | |||
| COIN / Coinbase Global, Inc. | 0.00 | 0.30 | 0.4302 | 0.4302 | |||||
| HALO / Halozyme Therapeutics, Inc. | 0.01 | 0.30 | 0.4299 | 0.4299 | |||||
| WAB / Westinghouse Air Brake Technologies Corporation | 0.00 | -4.23 | 0.30 | 10.37 | 0.4261 | 0.0431 | |||
| WWD / Woodward, Inc. | 0.00 | 0.00 | 0.30 | 34.55 | 0.4233 | 0.1101 | |||
| AXS / AXIS Capital Holdings Limited | 0.00 | 0.00 | 0.30 | 3.50 | 0.4229 | 0.0171 | |||
| SBAC / SBA Communications Corporation | 0.00 | 0.00 | 0.30 | 6.50 | 0.4224 | 0.0291 | |||
| EVR / Evercore Inc. | 0.00 | 187.11 | 0.29 | 272.15 | 0.4205 | 0.3270 | |||
| HUBS / HubSpot, Inc. | 0.00 | 0.00 | 0.29 | -2.66 | 0.4187 | -0.0083 | |||
| NFG / National Fuel Gas Company | 0.00 | 93.30 | 0.29 | 107.80 | 0.4184 | 0.2173 | |||
| NRG / NRG Energy, Inc. | 0.00 | -57.11 | 0.29 | -27.83 | 0.4183 | -0.1578 | |||
| ALNY / Alnylam Pharmaceuticals, Inc. | 0.00 | 0.00 | 0.29 | 20.83 | 0.4142 | 0.0734 | |||
| HOLX / Hologic, Inc. | 0.00 | -4.73 | 0.28 | 0.35 | 0.4047 | 0.0045 | |||
| G / Genpact Limited | 0.01 | -63.29 | 0.28 | -67.93 | 0.3998 | -0.8392 | |||
| MTZ / MasTec, Inc. | 0.00 | -12.31 | 0.28 | 27.98 | 0.3987 | 0.0893 | |||
| NI / NiSource Inc. | 0.01 | -4.75 | 0.28 | -4.12 | 0.3984 | -0.0147 | |||
| MPWR / Monolithic Power Systems, Inc. | 0.00 | 192.31 | 0.28 | 269.33 | 0.3967 | 0.2897 | |||
| STWD / Starwood Property Trust, Inc. | 0.01 | -4.72 | 0.28 | -3.16 | 0.3940 | -0.0108 | |||
| HAS / Hasbro, Inc. | 0.00 | -62.85 | 0.28 | -55.50 | 0.3935 | -0.4833 | |||
| LKQ / LKQ Corporation | 0.01 | -4.71 | 0.27 | -16.98 | 0.3845 | -0.0764 | |||
| ARMK / Aramark | 0.01 | 18.21 | 0.27 | 43.85 | 0.3842 | 0.1179 | |||
| HIG / The Hartford Insurance Group, Inc. | 0.00 | 0.00 | 0.27 | 2.70 | 0.3803 | 0.0117 | |||
| RCL / Royal Caribbean Cruises Ltd. | 0.00 | -70.38 | 0.27 | -41.79 | 0.3799 | -0.1603 | |||
| ALLY / Ally Financial Inc. | 0.01 | -50.23 | 0.27 | -46.80 | 0.3799 | -0.3304 | |||
| EVRG / Evergy, Inc. | 0.00 | -42.43 | 0.26 | -42.58 | 0.3766 | -0.2737 | |||
| PB / Prosperity Bancshares, Inc. | 0.00 | 0.00 | 0.26 | -1.50 | 0.3750 | -0.0037 | |||
| CHX / ChampionX Corporation | 0.01 | -4.28 | 0.26 | -20.43 | 0.3736 | -0.0917 | |||
| XEL / Xcel Energy Inc. | 0.00 | -4.76 | 0.26 | -8.42 | 0.3731 | -0.0316 | |||
| BR / Broadridge Financial Solutions, Inc. | 0.00 | 0.26 | 0.3712 | 0.3712 | |||||
| BK / The Bank of New York Mellon Corporation | 0.00 | -44.64 | 0.26 | -40.00 | 0.3693 | -0.2410 | |||
| STAG / STAG Industrial, Inc. | 0.01 | 0.00 | 0.26 | 0.39 | 0.3677 | 0.0039 | |||
| ETR / Entergy Corporation | 0.00 | -4.69 | 0.25 | -7.64 | 0.3638 | -0.0263 | |||
| MKTX / MarketAxess Holdings Inc. | 0.00 | -38.38 | 0.25 | -36.50 | 0.3634 | -0.2043 | |||
| EEFT / Euronet Worldwide, Inc. | 0.00 | 0.00 | 0.25 | -5.22 | 0.3632 | -0.0172 | |||
| EPAM / EPAM Systems, Inc. | 0.00 | 13.57 | 0.25 | 19.34 | 0.3612 | 0.0594 | |||
| OTIS / Otis Worldwide Corporation | 0.00 | 0.00 | 0.25 | -3.83 | 0.3583 | -0.0128 | |||
| CNP / CenterPoint Energy, Inc. | 0.01 | -4.48 | 0.25 | -3.10 | 0.3576 | -0.0093 | |||
| PEG / Public Service Enterprise Group Incorporated | 0.00 | 0.00 | 0.25 | 2.07 | 0.3521 | 0.0100 | |||
| AM / Antero Midstream Corporation | 0.01 | 0.00 | 0.25 | 5.15 | 0.3507 | 0.0197 | |||
| AKAM / Akamai Technologies, Inc. | 0.00 | -3.90 | 0.25 | -4.67 | 0.3503 | -0.0153 | |||
| PODD / Insulet Corporation | 0.00 | 0.00 | 0.24 | 19.31 | 0.3453 | 0.0585 | |||
| SF / Stifel Financial Corp. | 0.00 | -41.69 | 0.24 | -36.00 | 0.3440 | -0.1884 | |||
| AWK / American Water Works Company, Inc. | 0.00 | 136.99 | 0.24 | 124.30 | 0.3435 | 0.1908 | |||
| AMP / Ameriprise Financial, Inc. | 0.00 | -2.61 | 0.24 | 7.66 | 0.3413 | 0.0254 | |||
| FLS / Flowserve Corporation | 0.00 | 0.00 | 0.24 | 7.21 | 0.3407 | 0.0248 | |||
| DG / Dollar General Corporation | 0.00 | 234.83 | 0.24 | 80.30 | 0.3406 | 0.1810 | |||
| VVV / Valvoline Inc. | 0.01 | 4.48 | 0.24 | 13.94 | 0.3390 | 0.0426 | |||
| JHG / Janus Henderson Group plc | 0.01 | -43.22 | 0.24 | -38.92 | 0.3387 | -0.2130 | |||
| DOV / Dover Corporation | 0.00 | -4.72 | 0.24 | -0.84 | 0.3376 | -0.0000 | |||
| ROST / Ross Stores, Inc. | 0.00 | -67.14 | 0.24 | -67.18 | 0.3369 | -0.6836 | |||
| AA / Alcoa Corporation | 0.01 | 0.00 | 0.23 | -3.31 | 0.3353 | -0.0091 | |||
| ZBH / Zimmer Biomet Holdings, Inc. | 0.00 | 1.22 | 0.23 | -18.53 | 0.3338 | -0.0728 | |||
| NU / Nu Holdings Ltd. | 0.02 | 0.23 | 0.3317 | 0.3317 | |||||
| LHX / L3Harris Technologies, Inc. | 0.00 | -4.55 | 0.23 | 14.36 | 0.3308 | 0.0434 | |||
| BPOP / Popular, Inc. | 0.00 | 0.00 | 0.23 | 19.69 | 0.3302 | 0.0552 | |||
| FANG / Diamondback Energy, Inc. | 0.00 | -45.56 | 0.23 | -53.27 | 0.3279 | -0.3685 | |||
| DAR / Darling Ingredients Inc. | 0.01 | 3.40 | 0.23 | 25.82 | 0.3279 | 0.0684 | |||
| ESS / Essex Property Trust, Inc. | 0.00 | 5.06 | 0.23 | -2.97 | 0.3277 | -0.0076 | |||
| BALL / Ball Corporation | 0.00 | -4.67 | 0.23 | 2.70 | 0.3267 | 0.0105 | |||
| TDG / TransDigm Group Incorporated | 0.00 | -11.76 | 0.23 | -2.98 | 0.3256 | -0.0080 | |||
| CTRA / Coterra Energy Inc. | 0.01 | -1.26 | 0.23 | -13.41 | 0.3236 | -0.0473 | |||
| CTAS / Cintas Corporation | 0.00 | -18.58 | 0.22 | -11.81 | 0.3207 | -0.0403 | |||
| TTD / The Trade Desk, Inc. | 0.00 | -35.65 | 0.22 | -60.68 | 0.3134 | -0.4360 | |||
| FHB / First Hawaiian, Inc. | 0.01 | -23.61 | 0.22 | -22.14 | 0.3124 | -0.0855 | |||
| APP / AppLovin Corporation | 0.00 | -53.38 | 0.22 | -38.35 | 0.3098 | -0.1901 | |||
| DLTR / Dollar Tree, Inc. | 0.00 | 41.69 | 0.22 | 87.83 | 0.3085 | 0.1445 | |||
| RGLD / Royal Gold, Inc. | 0.00 | 0.00 | 0.22 | 9.14 | 0.3071 | 0.0265 | |||
| MTSI / MACOM Technology Solutions Holdings, Inc. | 0.00 | 0.00 | 0.21 | 42.67 | 0.3068 | 0.0932 | |||
| ALSN / Allison Transmission Holdings, Inc. | 0.00 | 0.00 | 0.21 | -0.93 | 0.3064 | -0.0003 | |||
| USFD / US Foods Holding Corp. | 0.00 | 19.57 | 0.21 | 40.67 | 0.3023 | 0.0887 | |||
| INGR / Ingredion Incorporated | 0.00 | -4.82 | 0.21 | -4.52 | 0.3020 | -0.0124 | |||
| LDOS / Leidos Holdings, Inc. | 0.00 | -50.06 | 0.21 | -41.81 | 0.2952 | -0.2072 | |||
| CASY / Casey's General Stores, Inc. | 0.00 | -19.08 | 0.21 | -5.09 | 0.2935 | -0.0131 | |||
| LW / Lamb Weston Holdings, Inc. | 0.00 | -4.34 | 0.20 | -6.85 | 0.2917 | -0.0198 | |||
| EGP / EastGroup Properties, Inc. | 0.00 | 0.00 | 0.20 | -5.16 | 0.2886 | -0.0137 | |||
| PSX / Phillips 66 | 0.00 | 63.29 | 0.20 | 37.67 | 0.2878 | 0.1153 | |||
| UDR / UDR, Inc. | 0.00 | 0.00 | 0.20 | -9.55 | 0.2844 | -0.0283 | |||
| CWEN / Clearway Energy, Inc. | 0.01 | -11.42 | 0.20 | -6.22 | 0.2800 | -0.0171 | |||
| ILMN / Illumina, Inc. | 0.00 | 0.00 | 0.19 | 20.63 | 0.2756 | 0.0479 | |||
| TTEK / Tetra Tech, Inc. | 0.01 | -35.69 | 0.19 | -41.87 | 0.2756 | -0.1719 | |||
| BJ / BJ's Wholesale Club Holdings, Inc. | 0.00 | 0.19 | 0.2740 | 0.2740 | |||||
| AXON / Axon Enterprise, Inc. | 0.00 | 35.29 | 0.19 | 88.12 | 0.2718 | 0.1359 | |||
| DAL / Delta Air Lines, Inc. | 0.00 | -56.31 | 0.19 | -50.78 | 0.2717 | -0.2762 | |||
| MTD / Mettler-Toledo International Inc. | 0.00 | 0.00 | 0.19 | -0.53 | 0.2700 | 0.0003 | |||
| FICO / Fair Isaac Corporation | 0.00 | 0.00 | 0.19 | -0.53 | 0.2687 | -0.0007 | |||
| NCLH / Norwegian Cruise Line Holdings Ltd. | 0.01 | -24.40 | 0.19 | -19.21 | 0.2654 | -0.0608 | |||
| FITB / Fifth Third Bancorp | 0.00 | -13.74 | 0.19 | -9.76 | 0.2654 | -0.0260 | |||
| MOH / Molina Healthcare, Inc. | 0.00 | 0.00 | 0.18 | -9.80 | 0.2636 | -0.0260 | |||
| APH / Amphenol Corporation | 0.00 | 0.00 | 0.18 | 50.82 | 0.2636 | 0.0896 | |||
| AXTA / Axalta Coating Systems Ltd. | 0.01 | -8.89 | 0.18 | -18.47 | 0.2585 | -0.0565 | |||
| TT / Trane Technologies plc | 0.00 | 0.00 | 0.18 | 29.50 | 0.2579 | 0.0605 | |||
| IFF / International Flavors & Fragrances Inc. | 0.00 | -2.59 | 0.18 | -7.73 | 0.2563 | -0.0196 | |||
| WELL / Welltower Inc. | 0.00 | -24.49 | 0.18 | -24.24 | 0.2504 | -0.0780 | |||
| ST / Sensata Technologies Holding plc | 0.01 | 336.84 | 0.17 | 194.92 | 0.2497 | 0.1736 | |||
| SNA / Snap-on Incorporated | 0.00 | -4.43 | 0.17 | -11.68 | 0.2492 | -0.0314 | |||
| SMG / The Scotts Miracle-Gro Company | 0.00 | 128.22 | 0.17 | 126.32 | 0.2467 | 0.1442 | |||
| CART / Maplebear Inc. | 0.00 | 0.17 | 0.2434 | 0.2434 | |||||
| LYFT / Lyft, Inc. | 0.01 | -56.26 | 0.17 | -42.12 | 0.2423 | -0.1723 | |||
| INSM / Insmed Incorporated | 0.00 | 0.17 | 0.2413 | 0.2413 | |||||
| NEU / NewMarket Corporation | 0.00 | 0.00 | 0.17 | 21.90 | 0.2396 | 0.0444 | |||
| MCHP / Microchip Technology Incorporated | 0.00 | -49.10 | 0.17 | -55.47 | 0.2391 | -0.2075 | |||
| LENB / Lennar Corp. - Class B | 0.00 | 0.00 | 0.17 | -3.49 | 0.2381 | -0.0071 | |||
| IRDM / Iridium Communications Inc. | 0.01 | 0.00 | 0.17 | 10.74 | 0.2356 | 0.0236 | |||
| HXL / Hexcel Corporation | 0.00 | -3.26 | 0.16 | 0.00 | 0.2342 | 0.0010 | |||
| XYL / Xylem Inc. | 0.00 | 0.00 | 0.16 | 8.61 | 0.2341 | 0.0193 | |||
| GAP / The Gap, Inc. | 0.01 | -59.48 | 0.16 | -57.22 | 0.2335 | -0.3076 | |||
| COF / Capital One Financial Corporation | 0.00 | 0.16 | 0.2332 | 0.2332 | |||||
| COLM / Columbia Sportswear Company | 0.00 | -1.28 | 0.16 | -20.50 | 0.2278 | -0.0564 | |||
| LEN / Lennar Corporation | 0.00 | 0.00 | 0.16 | -3.64 | 0.2273 | -0.0071 | |||
| HAYW / Hayward Holdings, Inc. | 0.01 | 0.00 | 0.16 | -1.25 | 0.2267 | -0.0005 | |||
| VIRT / Virtu Financial, Inc. | 0.00 | -53.02 | 0.15 | -44.77 | 0.2186 | -0.1750 | |||
| GEHC / GE HealthCare Technologies Inc. | 0.00 | 0.15 | 0.2167 | 0.2167 | |||||
| ENPH / Enphase Energy, Inc. | 0.00 | 0.15 | 0.2162 | 0.2162 | |||||
| CVNA / Carvana Co. | 0.00 | 62.04 | 0.15 | 161.40 | 0.2135 | 0.1323 | |||
| FAST / Fastenal Company | 0.00 | -49.55 | 0.15 | -70.63 | 0.2122 | -0.4666 | |||
| KMI / Kinder Morgan, Inc. | 0.01 | 0.00 | 0.15 | 2.78 | 0.2119 | 0.0076 | |||
| WBA / Walgreens Boots Alliance, Inc. | 0.01 | -39.66 | 0.15 | -38.08 | 0.2119 | -0.1277 | |||
| AS / Amer Sports, Inc. | 0.00 | 0.15 | 0.2108 | 0.2108 | |||||
| UHS / Universal Health Services, Inc. | 0.00 | 1.25 | 0.15 | -20.22 | 0.2094 | -0.0085 | |||
| GRMN / Garmin Ltd. | 0.00 | 0.00 | 0.15 | -3.31 | 0.2085 | -0.0070 | |||
| STZ / Constellation Brands, Inc. | 0.00 | -1.32 | 0.15 | -12.65 | 0.2081 | -0.0283 | |||
| SWK / Stanley Black & Decker, Inc. | 0.00 | 0.00 | 0.14 | -12.20 | 0.2069 | -0.0264 | |||
| ARE / Alexandria Real Estate Equities, Inc. | 0.00 | -1.34 | 0.14 | -22.58 | 0.2065 | -0.0584 | |||
| HST / Host Hotels & Resorts, Inc. | 0.01 | 51.11 | 0.14 | 63.22 | 0.2033 | 0.0796 | |||
| DOCS / Doximity, Inc. | 0.00 | -35.85 | 0.14 | -32.37 | 0.2005 | -0.0934 | |||
| GNTX / Gentex Corporation | 0.01 | -2.75 | 0.14 | -8.55 | 0.1998 | -0.0165 | |||
| PWR / Quanta Services, Inc. | 0.00 | 0.00 | 0.14 | 47.87 | 0.1997 | 0.0663 | |||
| CCL / Carnival Corporation & plc | 0.00 | 0.00 | 0.14 | 43.30 | 0.1996 | 0.0618 | |||
| SYY / Sysco Corporation | 0.00 | 0.14 | 0.1987 | 0.1987 | |||||
| OLED / Universal Display Corporation | 0.00 | 18.44 | 0.14 | -4.93 | 0.1940 | 0.0228 | |||
| RSG / Republic Services, Inc. | 0.00 | -42.66 | 0.14 | -41.81 | 0.1940 | -0.1361 | |||
| ESTC / Elastic N.V. | 0.00 | 0.00 | 0.14 | -5.59 | 0.1938 | -0.0097 | |||
| CPT / Camden Property Trust | 0.00 | 0.00 | 0.13 | -7.59 | 0.1914 | -0.0150 | |||
| WMB / The Williams Companies, Inc. | 0.00 | -28.98 | 0.13 | -25.70 | 0.1911 | -0.0633 | |||
| TROW / T. Rowe Price Group, Inc. | 0.00 | 0.00 | 0.13 | 4.72 | 0.1909 | 0.0103 | |||
| CELH / Celsius Holdings, Inc. | 0.00 | 0.13 | 0.1881 | 0.1881 | |||||
| CPNG / Coupang, Inc. | 0.00 | -63.95 | 0.13 | -50.94 | 0.1873 | -0.1720 | |||
| FERG / Ferguson Enterprises Inc. | 0.00 | 0.13 | 0.1865 | 0.1865 | |||||
| PPL / PPL Corporation | 0.00 | 0.00 | 0.13 | -5.93 | 0.1819 | -0.0107 | |||
| BMRN / BioMarin Pharmaceutical Inc. | 0.00 | 129.00 | 0.13 | 30.21 | 0.1797 | 0.0635 | |||
| INSP / Inspire Medical Systems, Inc. | 0.00 | 0.00 | 0.12 | -18.42 | 0.1778 | -0.0391 | |||
| UAL / United Airlines Holdings, Inc. | 0.00 | 25.12 | 0.12 | 44.19 | 0.1778 | 0.0553 | |||
| EXC / Exelon Corporation | 0.00 | 0.00 | 0.12 | -5.34 | 0.1773 | -0.0097 | |||
| CMG / Chipotle Mexican Grill, Inc. | 0.00 | 0.00 | 0.12 | 11.82 | 0.1763 | 0.0196 | |||
| BWA / BorgWarner Inc. | 0.00 | -3.02 | 0.12 | 12.96 | 0.1749 | 0.0215 | |||
| AU / AngloGold Ashanti plc | 0.00 | 0.12 | 0.1704 | 0.1704 | |||||
| WSM / Williams-Sonoma, Inc. | 0.00 | 0.00 | 0.12 | 3.54 | 0.1679 | 0.0064 | |||
| OGE / OGE Energy Corp. | 0.00 | 0.11 | 0.1558 | 0.1558 | |||||
| EXPD / Expeditors International of Washington, Inc. | 0.00 | 0.00 | 0.11 | -5.26 | 0.1549 | -0.0071 | |||
| RBRK / Rubrik, Inc. | 0.00 | 0.11 | 0.1535 | 0.1535 | |||||
| NXST / Nexstar Media Group, Inc. | 0.00 | -26.19 | 0.11 | -23.57 | 0.1531 | -0.0501 | |||
| ROKU / Roku, Inc. | 0.00 | 0.00 | 0.11 | 24.71 | 0.1518 | 0.0309 | |||
| THC / Tenet Healthcare Corporation | 0.00 | 0.00 | 0.11 | 30.86 | 0.1515 | 0.0364 | |||
| HUM / Humana Inc. | 0.00 | -4.26 | 0.10 | -11.86 | 0.1490 | -0.0184 | |||
| FIVE / Five Below, Inc. | 0.00 | -78.82 | 0.10 | -63.08 | 0.1479 | -0.2485 | |||
| NVST / Envista Holdings Corporation | 0.01 | -1.26 | 0.10 | 10.87 | 0.1470 | 0.0163 | |||
| CLX / The Clorox Company | 0.00 | 0.00 | 0.10 | -18.40 | 0.1457 | -0.0319 | |||
| TXRH / Texas Roadhouse, Inc. | 0.00 | -60.70 | 0.10 | -56.00 | 0.1420 | -0.1773 | |||
| DUOL / Duolingo, Inc. | 0.00 | 0.10 | 0.1405 | 0.1405 | |||||
| FR / First Industrial Realty Trust, Inc. | 0.00 | 30.13 | 0.10 | 15.48 | 0.1395 | 0.0201 | |||
| BLD / TopBuild Corp. | 0.00 | 0.00 | 0.10 | 6.59 | 0.1386 | 0.0089 | |||
| ORI / Old Republic International Corporation | 0.00 | -43.79 | 0.10 | -30.15 | 0.1366 | -0.0250 | |||
| UTHR / United Therapeutics Corporation | 0.00 | 0.00 | 0.09 | -6.93 | 0.1353 | -0.0089 | |||
| PLTR / Palantir Technologies Inc. | 0.00 | -90.50 | 0.09 | -84.64 | 0.1343 | -0.7349 | |||
| EQT / EQT Corporation | 0.00 | 0.00 | 0.09 | 8.14 | 0.1340 | 0.0120 | |||
| BURL / Burlington Stores, Inc. | 0.00 | -77.27 | 0.09 | -77.96 | 0.1338 | -0.4656 | |||
| MSI / Motorola Solutions, Inc. | 0.00 | 0.00 | 0.09 | -4.17 | 0.1320 | -0.0046 | |||
| ATI / ATI Inc. | 0.00 | 0.09 | 0.1306 | 0.1306 | |||||
| TOST / Toast, Inc. | 0.00 | 0.09 | 0.1296 | 0.1296 | |||||
| AFRM / Affirm Holdings, Inc. | 0.00 | 0.00 | 0.09 | 53.45 | 0.1283 | 0.0450 | |||
| SWKS / Skyworks Solutions, Inc. | 0.00 | 98.66 | 0.09 | 33.33 | 0.1266 | 0.0423 | |||
| BBWI / Bath & Body Works, Inc. | 0.00 | -51.98 | 0.09 | -52.69 | 0.1264 | -0.1383 | |||
| DGX / Quest Diagnostics Incorporated | 0.00 | 0.00 | 0.09 | 7.32 | 0.1256 | 0.0080 | |||
| BIIB / Biogen Inc. | 0.00 | 0.09 | 0.1255 | 0.1255 | |||||
| CINF / Cincinnati Financial Corporation | 0.00 | 0.00 | 0.09 | 0.00 | 0.1254 | 0.0018 | |||
| NTNX / Nutanix, Inc. | 0.00 | 0.09 | 0.1244 | 0.1244 | |||||
| DRS / Leonardo DRS, Inc. | 0.00 | 0.08 | 0.1207 | 0.1207 | |||||
| ELS / Equity LifeStyle Properties, Inc. | 0.00 | -25.95 | 0.08 | -31.71 | 0.1206 | -0.0544 | |||
| DD / DuPont de Nemours, Inc. | 0.00 | 0.00 | 0.08 | -8.79 | 0.1194 | -0.0098 | |||
| TXT / Textron Inc. | 0.00 | 0.00 | 0.08 | 10.67 | 0.1194 | 0.0126 | |||
| AYI / Acuity Inc. | 0.00 | 0.00 | 0.08 | 13.70 | 0.1192 | 0.0146 | |||
| VST / Vistra Corp. | 0.00 | 10.26 | 0.08 | 56.60 | 0.1190 | 0.0466 | |||
| BIRK / Birkenstock Holding plc | 0.00 | -53.14 | 0.08 | -50.00 | 0.1182 | -0.1155 | |||
| ED / Consolidated Edison, Inc. | 0.00 | 0.00 | 0.08 | -8.99 | 0.1160 | -0.0110 | |||
| BRO / Brown & Brown, Inc. | 0.00 | -73.74 | 0.08 | -76.81 | 0.1155 | -0.3750 | |||
| AEE / Ameren Corporation | 0.00 | -37.31 | 0.08 | -40.30 | 0.1151 | -0.0757 | |||
| PFGC / Performance Food Group Company | 0.00 | 0.00 | 0.08 | 12.68 | 0.1142 | 0.0122 | |||
| JLL / Jones Lang LaSalle Incorporated | 0.00 | 40.91 | 0.08 | 46.30 | 0.1132 | 0.0358 | |||
| FOX / Fox Corporation | 0.00 | 0.08 | 0.1128 | 0.1128 | |||||
| CUBE / CubeSmart | 0.00 | 0.00 | 0.08 | 0.00 | 0.1086 | 0.0001 | |||
| VMC / Vulcan Materials Company | 0.00 | 0.00 | 0.08 | 11.94 | 0.1080 | 0.0120 | |||
| ALGN / Align Technology, Inc. | 0.00 | 0.00 | 0.08 | 19.05 | 0.1076 | 0.0179 | |||
| ZBRA / Zebra Technologies Corporation | 0.00 | 0.00 | 0.07 | 10.45 | 0.1056 | 0.0094 | |||
| NVR / NVR, Inc. | 0.00 | 0.00 | 0.07 | 1.39 | 0.1054 | 0.0027 | |||
| YETI / YETI Holdings, Inc. | 0.00 | 0.00 | 0.07 | -5.19 | 0.1053 | -0.0046 | |||
| TWLO / Twilio Inc. | 0.00 | 0.00 | 0.07 | 28.07 | 0.1047 | 0.0228 | |||
| TTC / The Toro Company | 0.00 | 0.07 | 0.1009 | 0.1009 | |||||
| RH / RH | 0.00 | -12.32 | 0.07 | -49.64 | 0.0998 | -0.0775 | |||
| BEPC / Brookfield Renewable Corporation | 0.00 | -70.88 | 0.07 | -66.01 | 0.0992 | -0.1891 | |||
| SFM / Sprouts Farmers Market, Inc. | 0.00 | 0.07 | 0.0987 | 0.0987 | |||||
| EXAS / Exact Sciences Corporation | 0.00 | -6.47 | 0.07 | 15.00 | 0.0986 | 0.0133 | |||
| CMS / CMS Energy Corporation | 0.00 | 0.00 | 0.07 | -8.22 | 0.0969 | -0.0075 | |||
| GIS / General Mills, Inc. | 0.00 | 0.07 | 0.0954 | 0.0954 | |||||
| ACGL / Arch Capital Group Ltd. | 0.00 | -71.11 | 0.07 | -74.02 | 0.0949 | -0.2062 | |||
| VLO / Valero Energy Corporation | 0.00 | -42.35 | 0.07 | -51.13 | 0.0940 | -0.0633 | |||
| PINS / Pinterest, Inc. | 0.00 | 2.30 | 0.06 | -17.11 | 0.0911 | 0.0006 | |||
| HEI / HEICO Corporation | 0.00 | -92.96 | 0.06 | -69.15 | 0.0890 | -0.2021 | |||
| OMC / Omnicom Group Inc. | 0.00 | -35.02 | 0.06 | -43.40 | 0.0857 | -0.0654 | |||
| OZK / Bank OZK | 0.00 | 0.00 | 0.06 | 9.26 | 0.0846 | 0.0070 | |||
| WU / The Western Union Company | 0.01 | -41.22 | 0.06 | -53.17 | 0.0845 | -0.0950 | |||
| MDB / MongoDB, Inc. | 0.00 | 47.93 | 0.05 | -24.64 | 0.0749 | -0.0083 | |||
| ULTA / Ulta Beauty, Inc. | 0.00 | -60.71 | 0.05 | -52.78 | 0.0735 | -0.0561 | |||
| AAP / Advance Auto Parts, Inc. | 0.00 | -0.60 | 0.05 | 17.95 | 0.0664 | 0.0197 | |||
| US003CVR0169 / CONTRA ABIOMED INC | 0.00 | 0.00 | 0.00 | 0.0000 | 0.0000 |