Mga Batayang Estadistika
| Profil Orang Dalam | Senator Investment Group LP |
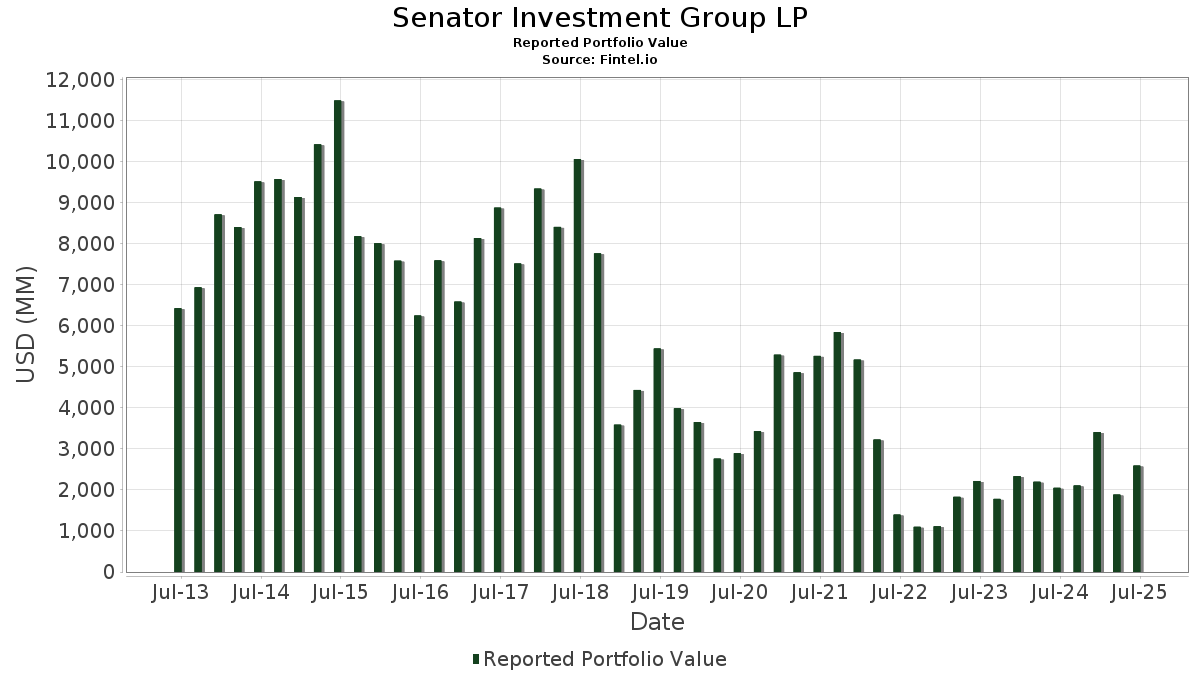
| Nilai Portofolio | $ 2,590,867,093 |
| Posisi Saat Ini | 54 |
Kepemilikan Terbaru, Kinerja, AUM (dari 13F, 13D)
Senator Investment Group LP telah mengungkapkan total kepemilikan 54 dalam pengajuan SEC terbaru mereka. Nilai portofolio terbaru dihitung sebesar $ 2,590,867,093 USD. Aset yang Dikelola (AUM) sebenarnya adalah nilai ini ditambah kas (yang tidak diungkapkan). Aset-aset utama Senator Investment Group LP adalah United Airlines Holdings, Inc. (US:UAL) , iShares Bitcoin Trust ETF (US:IBIT) , Robinhood Markets, Inc. (US:HOOD) , Capital One Financial Corporation (US:COF) , and Microsoft Corporation (US:MSFT) . Posisi baru Senator Investment Group LP meliputi: Life Time Group Holdings, Inc. (US:LTH) , Amphenol Corporation (US:APH) , Celsius Holdings, Inc. (US:CELH) , Galaxy Digital Inc. (US:GLXY) , and MercadoLibre, Inc. (US:MELI) .
Peningkatan Tertinggi Kuartal Ini
Kami menggunakan perubahan dalam alokasi portofolio karena ini adalah metrik yang paling bermakna. Perubahan dapat disebabkan oleh perdagangan atau perubahan harga saham.
| Keamanan | Saham (MM) |
Nilai (Juta Dolar AS) |
Portfolio % | ΔPorsyento ng Portfolio |
|---|---|---|---|---|
| 0.31 | 89.00 | 3.4347 | 3.4347 | |
| 0.51 | 108.54 | 4.1885 | 2.7219 | |
| 0.10 | 64.26 | 2.4797 | 2.4797 | |
| 4.07 | 46.60 | 1.7984 | 1.7984 | |
| 0.29 | 71.58 | 2.7624 | 1.5762 | |
| 1.20 | 36.40 | 1.4048 | 1.4048 | |
| 0.36 | 35.57 | 1.3728 | 1.3728 | |
| 0.06 | 34.60 | 1.3354 | 1.3354 | |
| 0.23 | 59.20 | 2.2846 | 1.3287 | |
| 0.67 | 31.19 | 1.2039 | 1.2039 |
Penurunan Tertinggi Kuartal Ini
Kami menggunakan perubahan dalam alokasi portofolio karena ini adalah metrik yang paling bermakna. Perubahan dapat disebabkan oleh perdagangan atau perubahan harga saham.
| Keamanan | Saham (MM) |
Nilai (Juta Dolar AS) |
Portfolio % | ΔPorsyento ng Portfolio |
|---|---|---|---|---|
| 0.16 | 54.23 | 2.0927 | -2.4664 | |
| 3.12 | 248.84 | 9.6031 | -2.0247 | |
| 0.46 | 26.54 | 1.0240 | -1.8962 | |
| 0.92 | 76.34 | 2.9462 | -1.5839 | |
| 0.13 | 36.15 | 1.3951 | -1.4636 | |
| 1.14 | 49.49 | 1.9097 | -1.2356 | |
| 1.30 | 46.40 | 1.7905 | -1.1466 | |
| 0.75 | 64.75 | 2.4990 | -0.8486 | |
| 0.24 | 46.51 | 1.7950 | -0.7714 | |
| 0.63 | 30.45 | 1.1752 | -0.7328 |
Pengajuan 13F dan Dana
Formulir ini diajukan pada 2025-08-13 untuk periode pelaporan 2025-06-30. Klik ikon tautan untuk melihat riwayat transaksi selengkapnya.
Tingkatkan ke versi premium untuk membuka data premium dan ekspor ke Excel. ![]() .
.
| Keamanan | Ketik | Harga Saham Rata-rata | Saham (MM) |
ΔSaham (%) |
ΔSaham (%) |
Nilai ($MM) |
Portpolyo (%) |
ΔPortofolio (%) |
|
|---|---|---|---|---|---|---|---|---|---|
| UAL / United Airlines Holdings, Inc. | 3.12 | -1.53 | 248.84 | 13.56 | 9.6031 | -2.0247 | |||
| IBIT / iShares Bitcoin Trust ETF | 1.81 | 43.24 | 110.91 | 87.31 | 4.2802 | 1.1381 | |||
| HOOD / Robinhood Markets, Inc. | 1.18 | -21.07 | 110.47 | 77.56 | 4.2630 | 0.9617 | |||
| COF / Capital One Financial Corporation | 0.51 | 230.95 | 108.54 | 292.71 | 4.1885 | 2.7219 | |||
| MSFT / Microsoft Corporation | 0.21 | 18.57 | 103.21 | 57.11 | 3.9831 | 0.4971 | |||
| META / Meta Platforms, Inc. | 0.14 | 32.61 | 100.31 | 69.82 | 3.8710 | 0.7367 | |||
| JPM / JPMorgan Chase & Co. | 0.31 | 89.00 | 3.4347 | 3.4347 | |||||
| FOUR / Shift4 Payments, Inc. | 0.80 | 18.34 | 79.56 | 43.54 | 3.0703 | 0.1291 | |||
| AMZN / Amazon.com, Inc. | 0.35 | 25.66 | 77.88 | 44.90 | 3.0056 | 0.1535 | |||
| APO / Apollo Global Management, Inc. | 0.54 | 77.10 | 76.69 | 83.48 | 2.9597 | 0.7416 | |||
| SSNC / SS&C Technologies Holdings, Inc. | 0.92 | -9.78 | 76.34 | -10.57 | 2.9462 | -1.5839 | |||
| WWD / Woodward, Inc. | 0.29 | 138.42 | 71.58 | 220.20 | 2.7624 | 1.5762 | |||
| FLUT / Flutter Entertainment plc | 0.23 | -9.82 | 66.04 | 16.31 | 2.5487 | -0.4643 | |||
| H / Hyatt Hotels Corporation | 0.46 | 132.11 | 64.83 | 164.60 | 2.5018 | 1.2017 | |||
| ATI / ATI Inc. | 0.75 | -38.14 | 64.75 | 2.65 | 2.4990 | -0.8486 | |||
| SPY / SPDR S&P 500 ETF | 0.10 | 64.26 | 2.4797 | 2.4797 | |||||
| NVDA / NVIDIA Corporation | 0.40 | 12.46 | 63.52 | 63.94 | 2.4513 | 0.3953 | |||
| GE / General Electric Company | 0.23 | 155.56 | 59.20 | 228.65 | 2.2846 | 1.3287 | |||
| CHTR / Charter Communications, Inc. | 0.14 | 39.40 | 59.01 | 54.63 | 2.2773 | 0.2523 | |||
| NTNX / Nutanix, Inc. | 0.77 | 0.00 | 59.00 | 9.50 | 2.2770 | -0.5824 | |||
| CVNA / Carvana Co. | 0.16 | -60.84 | 54.23 | -36.89 | 2.0927 | -2.4664 | |||
| FCX / Freeport-McMoRan Inc. | 1.14 | -27.09 | 49.49 | -16.51 | 1.9097 | -1.2356 | |||
| WBD / Warner Bros. Discovery, Inc. | 4.07 | 46.60 | 1.7984 | 1.7984 | |||||
| VST / Vistra Corp. | 0.24 | -41.72 | 46.51 | -3.83 | 1.7950 | -0.7714 | |||
| CMCSA / Comcast Corporation | 1.30 | -13.33 | 46.40 | -16.18 | 1.7905 | -1.1466 | |||
| TSM / Taiwan Semiconductor Manufacturing Company Limited - Depositary Receipt (Common Stock) | 0.19 | -11.49 | 41.90 | 20.76 | 1.6171 | -0.2242 | |||
| AVGO / Broadcom Inc. | 0.15 | -15.61 | 41.35 | 38.94 | 1.5956 | 0.0165 | |||
| LTH / Life Time Group Holdings, Inc. | 1.20 | 36.40 | 1.4048 | 1.4048 | |||||
| APD / Air Products and Chemicals, Inc. | 0.13 | -29.84 | 36.15 | -32.89 | 1.3951 | -1.4636 | |||
| APH / Amphenol Corporation | 0.36 | 35.57 | 1.3728 | 1.3728 | |||||
| MSCI / MSCI Inc. | 0.06 | 34.60 | 1.3354 | 1.3354 | |||||
| HWM / Howmet Aerospace Inc. | 0.18 | -31.43 | 33.50 | -1.62 | 1.2929 | -0.5141 | |||
| VRT / Vertiv Holdings Co | 0.26 | 1,019.33 | 32.78 | 1,891.74 | 1.2652 | 1.1778 | |||
| PRM / Perimeter Solutions, Inc. | 2.35 | 0.00 | 32.71 | 38.24 | 1.2624 | 0.0067 | |||
| CELH / Celsius Holdings, Inc. | 0.67 | 31.19 | 1.2039 | 1.2039 | |||||
| SGI / Somnigroup International Inc. | 0.45 | 5,763.19 | 30.62 | 6,571.46 | 1.1818 | 1.1574 | |||
| CCOI / Cogent Communications Holdings, Inc. | 0.63 | 7.71 | 30.45 | -15.30 | 1.1752 | -0.7328 | |||
| EQT / EQT Corporation | 0.46 | -55.83 | 26.54 | -51.78 | 1.0240 | -1.8962 | |||
| ATRO / Astronics Corporation | 0.74 | 4.54 | 24.81 | 44.81 | 0.9575 | 0.0483 | |||
| GLXY / Galaxy Digital Inc. | 1.00 | 21.90 | 0.8453 | 0.8453 | |||||
| COIN / Coinbase Global, Inc. | 0.06 | 19.76 | 0.7624 | 0.7624 | |||||
| MELI / MercadoLibre, Inc. | 0.01 | 18.60 | 0.7181 | 0.7181 | |||||
| NU / Nu Holdings Ltd. | 1.34 | 18.42 | 0.7110 | 0.7110 | |||||
| AA / Alcoa Corporation | 0.42 | 12.48 | 0.4814 | 0.4814 | |||||
| FBTC / Fidelity Wise Origin Bitcoin Fund | 0.09 | -7.13 | 8.47 | 21.28 | 0.3269 | -0.0437 | |||
| US83542D1028 / Sonder Holdings, Inc. | 2.38 | 1,486.80 | 6.43 | 2,042.00 | 0.2480 | 0.2321 | |||
| GLD / SPDR Gold Trust | 0.02 | 1.81 | 6.41 | 7.71 | 0.2474 | -0.0685 | |||
| MX / Methanex Corporation | 0.15 | 4.96 | 0.1916 | 0.1916 | |||||
| HOND / HCM II Acquisition Corp. | 0.34 | 3.77 | 0.1457 | 0.1457 | |||||
| PLTR / Palantir Technologies Inc. | 0.01 | 7.09 | 1.64 | 73.02 | 0.0631 | 0.0130 | |||
| BCS / Barclays PLC - Depositary Receipt (Common Stock) | 0.05 | -33.41 | 0.88 | -19.40 | 0.0340 | -0.0240 | |||
| SOND / Sonder Holdings Inc. | 0.22 | 0.00 | 0.58 | 292.57 | 0.0224 | 0.0145 | |||
| TTWO / Take-Two Interactive Software, Inc. | 0.00 | 0.00 | 0.41 | 17.09 | 0.0159 | -0.0028 | |||
| GGR / Gogoro Inc. | 1.35 | 0.00 | 0.38 | 5.49 | 0.0148 | -0.0045 | |||
| NEE / NextEra Energy, Inc. | 0.00 | -100.00 | 0.00 | 0.0000 | |||||
| NCNO / nCino, Inc. | 0.00 | -100.00 | 0.00 | 0.0000 | |||||
| TECK / Teck Resources Limited | 0.00 | -100.00 | 0.00 | 0.0000 | |||||
| ICE / Intercontinental Exchange, Inc. | 0.00 | -100.00 | 0.00 | 0.0000 | |||||
| WULF / TeraWulf Inc. | 0.00 | -100.00 | 0.00 | 0.0000 | |||||
| PRMB / Primo Brands Corporation | 0.00 | -100.00 | 0.00 | 0.0000 | |||||
| FI / Fiserv, Inc. | 0.00 | -100.00 | 0.00 | 0.0000 | |||||
| CENX / Century Aluminum Company | 0.00 | -100.00 | 0.00 | 0.0000 | |||||
| WFC / Wells Fargo & Company | 0.00 | -100.00 | 0.00 | 0.0000 | |||||
| DHR / Danaher Corporation | 0.00 | -100.00 | 0.00 | 0.0000 | |||||
| LLY / Eli Lilly and Company | 0.00 | -100.00 | 0.00 | 0.0000 |