Mga Batayang Estadistika
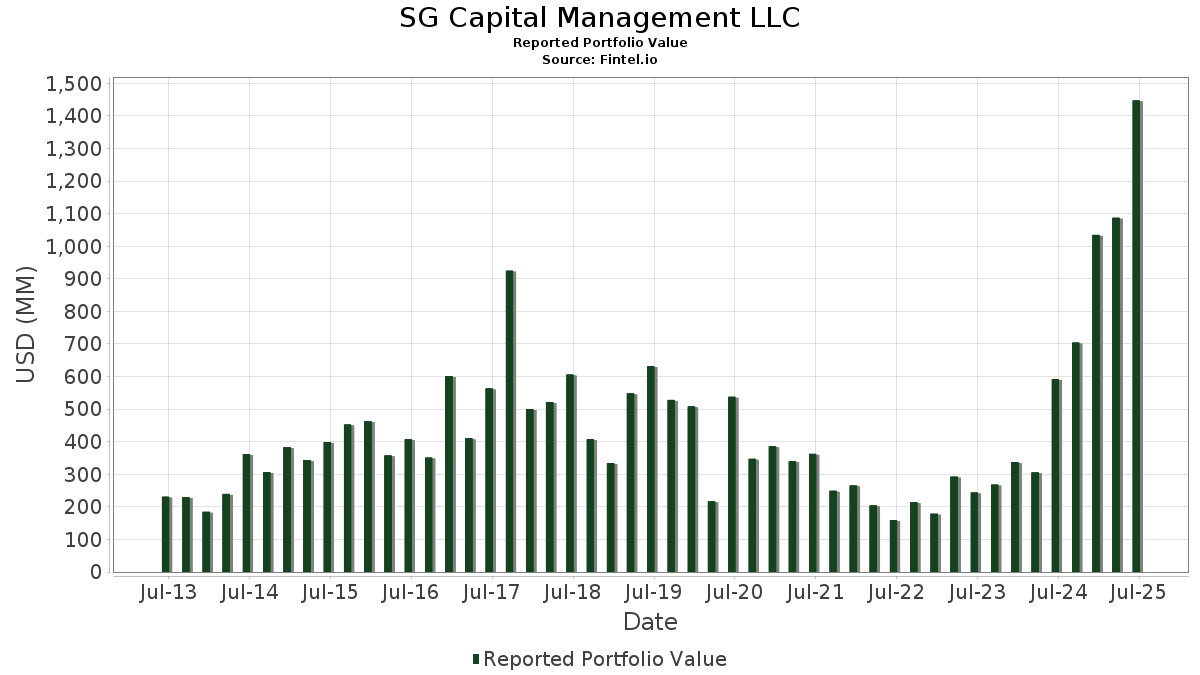
| Nilai Portofolio | $ 1,447,274,762 |
| Posisi Saat Ini | 73 |
Kepemilikan Terbaru, Kinerja, AUM (dari 13F, 13D)
SG Capital Management LLC telah mengungkapkan total kepemilikan 73 dalam pengajuan SEC terbaru mereka. Nilai portofolio terbaru dihitung sebesar $ 1,447,274,762 USD. Aset yang Dikelola (AUM) sebenarnya adalah nilai ini ditambah kas (yang tidak diungkapkan). Aset-aset utama SG Capital Management LLC adalah Zebra Technologies Corporation (US:ZBRA) , Oshkosh Corporation (US:OSK) , CoStar Group, Inc. (US:CSGP) , Haemonetics Corporation (US:HAE) , and WNS (Holdings) Limited (US:WNS) . Posisi baru SG Capital Management LLC meliputi: Zebra Technologies Corporation (US:ZBRA) , DoubleVerify Holdings, Inc. (US:DV) , DexCom, Inc. (US:DXCM) , Corning Incorporated (US:GLW) , and Sensata Technologies Holding plc (US:ST) .
Peningkatan Tertinggi Kuartal Ini
Kami menggunakan perubahan dalam alokasi portofolio karena ini adalah metrik yang paling bermakna. Perubahan dapat disebabkan oleh perdagangan atau perubahan harga saham.
| Keamanan | Saham (MM) |
Nilai (Juta Dolar AS) |
Portfolio % | ΔPorsyento ng Portfolio |
|---|---|---|---|---|
| 0.27 | 82.97 | 5.7329 | 5.7329 | |
| 0.70 | 79.48 | 5.4916 | 5.4916 | |
| 0.94 | 75.59 | 5.2228 | 5.2228 | |
| 0.56 | 63.24 | 4.3698 | 4.3698 | |
| 0.20 | 61.67 | 4.2613 | 4.2613 | |
| 1.18 | 62.19 | 4.2967 | 2.5659 | |
| 2.25 | 33.64 | 2.3245 | 2.3245 | |
| 0.40 | 32.92 | 2.2744 | 2.2744 | |
| 0.62 | 29.06 | 2.0082 | 2.0082 | |
| 0.30 | 26.58 | 1.8368 | 1.8368 |
Penurunan Tertinggi Kuartal Ini
Kami menggunakan perubahan dalam alokasi portofolio karena ini adalah metrik yang paling bermakna. Perubahan dapat disebabkan oleh perdagangan atau perubahan harga saham.
| Keamanan | Saham (MM) |
Nilai (Juta Dolar AS) |
Portfolio % | ΔPorsyento ng Portfolio |
|---|---|---|---|---|
| 0.20 | 31.32 | 2.1641 | -4.0423 | |
| 0.12 | 15.74 | 1.0872 | -3.9111 | |
| 0.05 | 8.52 | 0.5889 | -3.7372 | |
| 0.07 | 19.82 | 1.3696 | -3.4375 | |
| 0.05 | 12.13 | 0.8381 | -3.2012 | |
| 0.24 | 20.18 | 1.3942 | -3.1319 | |
| 0.20 | 17.00 | 1.1749 | -2.7863 | |
| 1.11 | 49.63 | 3.4289 | -2.2979 | |
| 0.11 | 7.09 | 0.4901 | -2.1947 | |
| 0.11 | 26.03 | 1.7987 | -2.0879 |
Pengajuan 13F dan Dana
Formulir ini diajukan pada 2025-08-08 untuk periode pelaporan 2025-06-30. Klik ikon tautan untuk melihat riwayat transaksi selengkapnya.
Tingkatkan ke versi premium untuk membuka data premium dan ekspor ke Excel. ![]() .
.
| Keamanan | Ketik | Harga Saham Rata-rata | Saham (MM) |
ΔSaham (%) |
ΔSaham (%) |
Nilai ($MM) |
Portpolyo (%) |
ΔPortofolio (%) |
|
|---|---|---|---|---|---|---|---|---|---|
| ZBRA / Zebra Technologies Corporation | 0.27 | 82.97 | 5.7329 | 5.7329 | |||||
| OSK / Oshkosh Corporation | Put | 0.70 | 79.48 | 5.4916 | 5.4916 | ||||
| CSGP / CoStar Group, Inc. | 0.94 | 75.59 | 5.2228 | 5.2228 | |||||
| HAE / Haemonetics Corporation | 0.91 | 26.06 | 67.66 | 48.00 | 4.6752 | 0.4701 | |||
| WNS / WNS (Holdings) Limited | 1.00 | 21.37 | 63.45 | 24.82 | 4.3842 | -0.2912 | |||
| OSK / Oshkosh Corporation | 0.56 | 63.24 | 4.3698 | 4.3698 | |||||
| GLW / Corning Incorporated | 1.18 | 187.66 | 62.19 | 230.45 | 4.2967 | 2.5659 | |||
| ZBRA / Zebra Technologies Corporation | Put | 0.20 | 61.67 | 4.2613 | 4.2613 | ||||
| WLY / John Wiley & Sons, Inc. | 1.11 | -20.43 | 49.63 | -20.30 | 3.4289 | -2.2979 | |||
| DV / DoubleVerify Holdings, Inc. | 2.25 | 33.64 | 2.3245 | 2.3245 | |||||
| CIEN / Ciena Corporation | 0.40 | 32.92 | 2.2744 | 2.2744 | |||||
| WNS / WNS (Holdings) Limited | Put | 0.50 | 101.53 | 31.62 | 107.28 | 2.1848 | 0.7817 | ||
| CLS / Celestica Inc. | 0.20 | -76.57 | 31.32 | -53.59 | 2.1641 | -4.0423 | |||
| ABM / ABM Industries Incorporated | 0.62 | 29.06 | 2.0082 | 2.0082 | |||||
| DXCM / DexCom, Inc. | 0.30 | 26.58 | 1.8368 | 1.8368 | |||||
| GLW / Corning Incorporated | Put | 0.50 | 26.30 | 1.8169 | 1.8169 | ||||
| ESI / Element Solutions Inc | 1.16 | 26.26 | 1.8142 | 1.8142 | |||||
| DY / Dycom Industries, Inc. | 0.11 | -61.60 | 26.03 | -38.40 | 1.7987 | -2.0879 | |||
| ST / Sensata Technologies Holding plc | 0.79 | 23.88 | 1.6498 | 1.6498 | |||||
| PSN / Parsons Corporation | 0.32 | 23.21 | 1.6038 | 1.6038 | |||||
| KAR / OPENLANE, Inc. | 0.88 | 21.62 | 1.4941 | 1.4941 | |||||
| CLH / Clean Harbors, Inc. | 0.09 | 20.75 | 1.4340 | 1.4340 | |||||
| MTX / Minerals Technologies Inc. | 0.37 | 20.38 | 1.4084 | 1.4084 | |||||
| MSM / MSC Industrial Direct Co., Inc. | 0.24 | -62.54 | 20.18 | -59.00 | 1.3942 | -3.1319 | |||
| FN / Fabrinet | 0.07 | -74.58 | 19.82 | -62.07 | 1.3696 | -3.4375 | |||
| MTX / Minerals Technologies Inc. | Put | 0.35 | 19.27 | 1.3318 | 1.3318 | ||||
| BDC / Belden Inc. | 0.16 | 18.89 | 1.3053 | 1.3053 | |||||
| DXCM / DexCom, Inc. | Put | 0.20 | 17.46 | 1.2063 | 1.2063 | ||||
| MSM / MSC Industrial Direct Co., Inc. | Put | 0.20 | -63.93 | 17.00 | -60.52 | 1.1749 | -2.7863 | ||
| AVT / Avnet, Inc. | 0.32 | 16.94 | 1.1705 | 1.1705 | |||||
| AZZ / AZZ Inc. | 0.18 | 16.82 | 1.1620 | 1.1620 | |||||
| VECO / Veeco Instruments Inc. | 0.81 | 16.42 | 1.1346 | 1.1346 | |||||
| ATGE / Adtalem Global Education Inc. | 0.12 | -77.10 | 15.74 | -71.05 | 1.0872 | -3.9111 | |||
| CCOI / Cogent Communications Holdings, Inc. | 0.31 | 22.55 | 15.10 | -3.64 | 1.0435 | -0.3979 | |||
| HURN / Huron Consulting Group Inc. | 0.11 | 14.86 | 1.0268 | 1.0268 | |||||
| OLLI / Ollie's Bargain Outlet Holdings, Inc. | 0.10 | 13.68 | 0.9454 | 0.9454 | |||||
| AMBA / Ambarella, Inc. | 0.19 | 235.77 | 12.50 | 340.76 | 0.8638 | 0.6029 | |||
| FCFS / FirstCash Holdings, Inc. | 0.09 | 77.24 | 12.37 | 99.08 | 0.8548 | 0.2832 | |||
| OSIS / OSI Systems, Inc. | 0.05 | -76.13 | 12.13 | -72.38 | 0.8381 | -3.2012 | |||
| PRIM / Primoris Services Corporation | 0.15 | 12.06 | 0.8333 | 0.8333 | |||||
| CRMT / America's Car-Mart, Inc. | 0.21 | 71.54 | 11.90 | 111.80 | 0.8222 | 0.3054 | |||
| WLY / John Wiley & Sons, Inc. | Put | 0.25 | 11.16 | 0.7709 | 0.7709 | ||||
| VRNT / Verint Systems Inc. | 0.46 | 9.06 | 0.6262 | 0.6262 | |||||
| MCHP / Microchip Technology Incorporated | 0.13 | 8.94 | 0.6175 | 0.6175 | |||||
| BCO / The Brink's Company | 0.10 | 8.84 | 0.6110 | 0.6110 | |||||
| SIMO / Silicon Motion Technology Corporation - Depositary Receipt (Common Stock) | 0.11 | -57.94 | 8.56 | -37.46 | 0.5913 | -0.6673 | |||
| MTZ / MasTec, Inc. | 0.05 | -87.59 | 8.52 | -81.88 | 0.5889 | -3.7372 | |||
| SON / Sonoco Products Company | 0.19 | 8.18 | 0.5655 | 0.5655 | |||||
| ETD / Ethan Allen Interiors Inc. | 0.29 | 8.09 | 0.5588 | 0.5588 | |||||
| ADTN / ADTRAN Holdings, Inc. | 0.85 | 7.60 | 0.5252 | 0.5252 | |||||
| MNRO / Monro, Inc. | 0.49 | -60.20 | 7.25 | -58.99 | 0.5007 | -1.1246 | |||
| CCOI / Cogent Communications Holdings, Inc. | Put | 0.15 | 7.23 | 0.4997 | 0.4997 | ||||
| KRE / SPDR Series Trust - SPDR S&P Regional Banking ETF | 0.12 | 64.38 | 7.17 | 71.72 | 0.4952 | 0.1113 | |||
| SKY / Champion Homes, Inc. | 0.11 | -63.22 | 7.09 | -75.70 | 0.4901 | -2.1947 | |||
| HNI / HNI Corporation | 0.14 | -65.86 | 6.75 | -62.14 | 0.4665 | -1.1737 | |||
| CALX / Calix, Inc. | 0.12 | -64.75 | 6.41 | -47.10 | 0.4427 | -0.6712 | |||
| PRDO / Perdoceo Education Corporation | 0.19 | 6.28 | 0.4340 | 0.4340 | |||||
| CDNA / CareDx, Inc | 0.32 | 6.17 | 0.4264 | 0.4264 | |||||
| LRN / Stride, Inc. | 0.04 | 5.86 | 0.4048 | 0.4048 | |||||
| LITE / Lumentum Holdings Inc. | 0.05 | -70.23 | 4.62 | -54.61 | 0.3193 | -0.6171 | |||
| NSSC / Napco Security Technologies, Inc. | 0.15 | 4.59 | 0.3174 | 0.3174 | |||||
| BLKB / Blackbaud, Inc. | 0.07 | 4.38 | 0.3027 | 0.3027 | |||||
| GATX / GATX Corporation | 0.03 | 16.51 | 4.26 | 15.22 | 0.2940 | -0.0456 | |||
| LINC / Lincoln Educational Services Corporation | 0.17 | 894.73 | 3.93 | 1,345.22 | 0.2716 | 0.2466 | |||
| TPB / Turning Point Brands, Inc. | 0.04 | 3.30 | 0.2281 | 0.2281 | |||||
| REVG / REV Group, Inc. | 0.07 | -72.80 | 3.23 | -59.03 | 0.2235 | -0.5026 | |||
| HEI / HEICO Corporation | 0.01 | -69.07 | 3.21 | -62.03 | 0.2217 | -0.5555 | |||
| PWR / Quanta Services, Inc. | 0.01 | 3.20 | 0.2212 | 0.2212 | |||||
| ALG / Alamo Group Inc. | 0.01 | -85.84 | 3.12 | -82.65 | 0.2158 | -1.4394 | |||
| GENI / Genius Sports Limited | 0.29 | -48.76 | 3.07 | -46.76 | 0.2119 | -0.3179 | |||
| SNBR / Sleep Number Corporation | 0.32 | 2.15 | 0.1482 | 0.1482 | |||||
| BELFB / Bel Fuse Inc. | 0.02 | 2.07 | 0.1433 | 0.1433 | |||||
| MAMA / Mama's Creations, Inc. | 0.04 | -75.50 | 0.37 | -68.77 | 0.0257 | -0.0837 | |||
| MTZ / MasTec, Inc. | Put | 0.00 | -100.00 | 0.00 | -100.00 | -1.0573 | |||
| CVCO / Cavco Industries, Inc. | 0.00 | -100.00 | 0.00 | 0.0000 | |||||
| SCS / Steelcase Inc. | 0.00 | -100.00 | 0.00 | 0.0000 | |||||
| CBZ / CBIZ, Inc. | 0.00 | -100.00 | 0.00 | 0.0000 | |||||
| AGFY / RYTHM, Inc. | 0.00 | -100.00 | 0.00 | 0.0000 | |||||
| MLI / Mueller Industries, Inc. | 0.00 | -100.00 | 0.00 | 0.0000 | |||||
| CWH / Camping World Holdings, Inc. | 0.00 | -100.00 | 0.00 | 0.0000 | |||||
| SBH / Sally Beauty Holdings, Inc. | 0.00 | -100.00 | 0.00 | 0.0000 | |||||
| CVLT / Commvault Systems, Inc. | 0.00 | -100.00 | 0.00 | 0.0000 | |||||
| MWA / Mueller Water Products, Inc. | 0.00 | -100.00 | 0.00 | 0.0000 | |||||
| QGEN / Qiagen N.V. | 0.00 | -100.00 | 0.00 | 0.0000 | |||||
| PATK / Patrick Industries, Inc. | 0.00 | -100.00 | 0.00 | 0.0000 | |||||
| EYE / National Vision Holdings, Inc. | 0.00 | -100.00 | 0.00 | 0.0000 | |||||
| KMX / CarMax, Inc. | 0.00 | -100.00 | 0.00 | 0.0000 | |||||
| FLS / Flowserve Corporation | 0.00 | -100.00 | 0.00 | 0.0000 | |||||
| CACI / CACI International Inc | 0.00 | -100.00 | 0.00 | 0.0000 | |||||
| APG / APi Group Corporation | 0.00 | -100.00 | 0.00 | 0.0000 | |||||
| CWST / Casella Waste Systems, Inc. | 0.00 | -100.00 | 0.00 | 0.0000 | |||||
| IWM / iShares Trust - iShares Russell 2000 ETF | 0.00 | -100.00 | 0.00 | 0.0000 | |||||
| MOGA / Moog, Inc. - Class A | 0.00 | -100.00 | 0.00 | 0.0000 | |||||
| CALX / Calix, Inc. | Put | 0.00 | -100.00 | 0.00 | -100.00 | -0.6470 | |||
| AWI / Armstrong World Industries, Inc. | 0.00 | -100.00 | 0.00 | 0.0000 | |||||
| HAE / Haemonetics Corporation | Put | 0.00 | -100.00 | 0.00 | -100.00 | -1.4507 | |||
| CARS / Cars.com Inc. | 0.00 | -100.00 | 0.00 | 0.0000 | |||||
| LPX / Louisiana-Pacific Corporation | 0.00 | -100.00 | 0.00 | 0.0000 |