Mga Batayang Estadistika
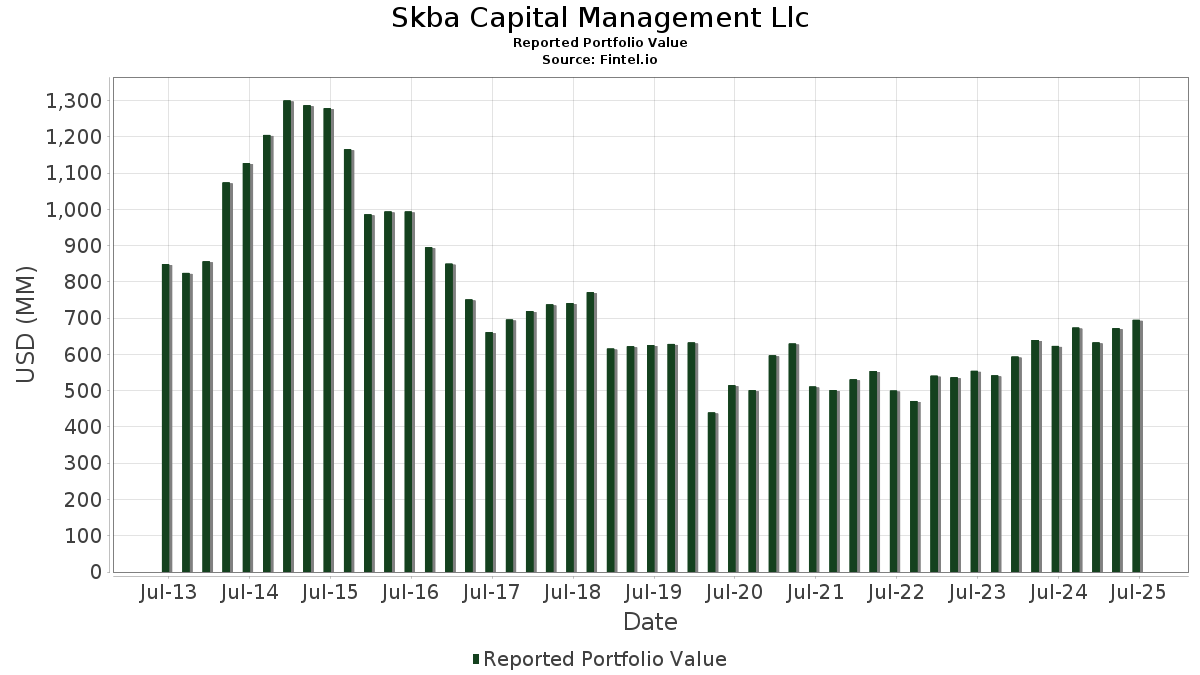
| Nilai Portofolio | $ 695,172,620 |
| Posisi Saat Ini | 84 |
Kepemilikan Terbaru, Kinerja, AUM (dari 13F, 13D)
Skba Capital Management Llc telah mengungkapkan total kepemilikan 84 dalam pengajuan SEC terbaru mereka. Nilai portofolio terbaru dihitung sebesar $ 695,172,620 USD. Aset yang Dikelola (AUM) sebenarnya adalah nilai ini ditambah kas (yang tidak diungkapkan). Aset-aset utama Skba Capital Management Llc adalah RTX Corporation (US:RTX) , Medtronic plc (US:MDT) , Kinder Morgan, Inc. (US:KMI) , AT&T Inc. (US:T) , and International Business Machines Corporation (US:IBM) . Posisi baru Skba Capital Management Llc meliputi: Diageo plc - Depositary Receipt (Common Stock) (US:DEO) , NIKE, Inc. (US:NKE) , .
Peningkatan Tertinggi Kuartal Ini
Kami menggunakan perubahan dalam alokasi portofolio karena ini adalah metrik yang paling bermakna. Perubahan dapat disebabkan oleh perdagangan atau perubahan harga saham.
| Keamanan | Saham (MM) |
Nilai (Juta Dolar AS) |
Portfolio % | ΔPorsyento ng Portfolio |
|---|---|---|---|---|
| 0.10 | 9.78 | 1.4062 | 1.4062 | |
| 0.11 | 7.46 | 1.0732 | 1.0732 | |
| 1.00 | 15.84 | 2.2787 | 0.8189 | |
| 0.06 | 13.85 | 1.9919 | 0.7225 | |
| 0.17 | 13.66 | 1.9645 | 0.5056 | |
| 0.05 | 13.42 | 1.9310 | 0.4505 | |
| 0.56 | 19.84 | 2.8536 | 0.3861 | |
| 0.19 | 15.89 | 2.2860 | 0.3020 | |
| 0.20 | 29.74 | 4.2780 | 0.2652 | |
| 0.25 | 16.35 | 2.3526 | 0.2637 |
Penurunan Tertinggi Kuartal Ini
Kami menggunakan perubahan dalam alokasi portofolio karena ini adalah metrik yang paling bermakna. Perubahan dapat disebabkan oleh perdagangan atau perubahan harga saham.
| Keamanan | Saham (MM) |
Nilai (Juta Dolar AS) |
Portfolio % | ΔPorsyento ng Portfolio |
|---|---|---|---|---|
| 0.00 | 0.21 | 0.0301 | -1.1533 | |
| 0.00 | 0.22 | 0.0316 | -0.8858 | |
| 0.72 | 20.78 | 2.9894 | -0.8681 | |
| 0.00 | 0.20 | 0.0291 | -0.8181 | |
| 0.11 | 6.47 | 0.9301 | -0.3797 | |
| 0.17 | 8.07 | 1.1612 | -0.3603 | |
| 0.17 | 13.20 | 1.8990 | -0.3336 | |
| 0.68 | 14.27 | 2.0530 | -0.3119 | |
| 0.09 | 13.09 | 1.8832 | -0.2473 | |
| 0.03 | 9.68 | 1.3921 | -0.2103 |
Pengajuan 13F dan Dana
Formulir ini diajukan pada 2025-08-12 untuk periode pelaporan 2025-06-30. Klik ikon tautan untuk melihat riwayat transaksi selengkapnya.
Tingkatkan ke versi premium untuk membuka data premium dan ekspor ke Excel. ![]() .
.
| Keamanan | Ketik | Harga Saham Rata-rata | Saham (MM) |
ΔSaham (%) |
ΔSaham (%) |
Nilai ($MM) |
Portpolyo (%) |
ΔPortofolio (%) |
|
|---|---|---|---|---|---|---|---|---|---|
| RTX / RTX Corporation | 0.20 | 0.05 | 29.74 | 10.29 | 4.2780 | 0.2652 | |||
| MDT / Medtronic plc | 0.30 | 9.82 | 26.26 | 6.54 | 3.7776 | 0.1093 | |||
| KMI / Kinder Morgan, Inc. | 0.73 | 0.22 | 21.36 | 3.28 | 3.0724 | -0.0053 | |||
| T / AT&T Inc. | 0.72 | -21.66 | 20.78 | -19.83 | 2.9894 | -0.8681 | |||
| IBM / International Business Machines Corporation | 0.07 | -14.45 | 20.55 | 1.42 | 2.9557 | -0.0592 | |||
| CRBG / Corebridge Financial, Inc. | 0.56 | 6.40 | 19.84 | 19.64 | 2.8536 | 0.3861 | |||
| CME / CME Group Inc. | 0.07 | -7.00 | 19.28 | -3.38 | 2.7739 | -0.1963 | |||
| MMM / 3M Company | 0.11 | 10.31 | 16.78 | 14.35 | 2.4138 | 0.2300 | |||
| KTB / Kontoor Brands, Inc. | 0.25 | 13.26 | 16.35 | 16.51 | 2.3526 | 0.2637 | |||
| COP / ConocoPhillips | 0.18 | 30.38 | 15.92 | 11.41 | 2.2906 | 0.1636 | |||
| C / Citigroup Inc. | 0.19 | -0.59 | 15.89 | 19.20 | 2.2860 | 0.3020 | |||
| XRAY / DENTSPLY SIRONA Inc. | 1.00 | 51.93 | 15.84 | 61.48 | 2.2787 | 0.8189 | |||
| PNW / Pinnacle West Capital Corporation | 0.16 | 0.12 | 14.38 | -5.95 | 2.0684 | -0.2068 | |||
| KVUE / Kenvue Inc. | 0.68 | 2.90 | 14.27 | -10.19 | 2.0530 | -0.3119 | |||
| AIG / American International Group, Inc. | 0.16 | 0.19 | 13.89 | -1.37 | 1.9976 | -0.0977 | |||
| LHX / L3Harris Technologies, Inc. | 0.06 | 35.46 | 13.85 | 62.33 | 1.9919 | 0.7225 | |||
| HR / Healthcare Realty Trust Incorporated | 0.87 | 14.59 | 13.79 | 7.54 | 1.9833 | 0.0754 | |||
| RDN / Radian Group Inc. | 0.38 | 0.08 | 13.69 | 9.01 | 1.9695 | 0.1003 | |||
| WFC / Wells Fargo & Company | 0.17 | 24.83 | 13.66 | 39.32 | 1.9645 | 0.5056 | |||
| APD / Air Products and Chemicals, Inc. | 0.05 | 41.09 | 13.42 | 34.93 | 1.9310 | 0.4505 | |||
| MRK / Merck & Co., Inc. | 0.17 | -0.22 | 13.20 | -12.01 | 1.8990 | -0.3336 | |||
| CVX / Chevron Corporation | 0.09 | 6.84 | 13.09 | -8.55 | 1.8832 | -0.2473 | |||
| DRI / Darden Restaurants, Inc. | 0.06 | -10.70 | 13.00 | -6.32 | 1.8702 | -0.1950 | |||
| MET / MetLife, Inc. | 0.15 | 0.00 | 12.30 | 0.16 | 1.7694 | -0.0582 | |||
| INGR / Ingredion Incorporated | 0.09 | 0.00 | 12.25 | 0.30 | 1.7616 | -0.0553 | |||
| HAS / Hasbro, Inc. | 0.17 | 0.82 | 12.22 | 21.04 | 1.7577 | 0.2554 | |||
| TFC / Truist Financial Corporation | 0.28 | 0.72 | 12.08 | 5.23 | 1.7377 | 0.0292 | |||
| PFE / Pfizer Inc. | 0.50 | 10.53 | 12.01 | 5.73 | 1.7279 | 0.0372 | |||
| NTAP / NetApp, Inc. | 0.11 | 0.45 | 11.83 | 21.85 | 1.7012 | 0.2568 | |||
| CSCO / Cisco Systems, Inc. | 0.17 | 0.55 | 11.47 | 13.04 | 1.6499 | 0.1400 | |||
| NXPI / NXP Semiconductors N.V. | 0.05 | 1.20 | 11.08 | 16.35 | 1.5931 | 0.1764 | |||
| AEP / American Electric Power Company, Inc. | 0.10 | 0.20 | 10.54 | -4.86 | 1.5156 | -0.1324 | |||
| HSY / The Hershey Company | 0.06 | 0.12 | 10.48 | -2.85 | 1.5082 | -0.0980 | |||
| CMCSA / Comcast Corporation | 0.29 | 0.76 | 10.40 | -2.54 | 1.4957 | -0.0920 | |||
| VICI / VICI Properties Inc. | 0.32 | 0.00 | 10.34 | -0.06 | 1.4877 | -0.0523 | |||
| TXN / Texas Instruments Incorporated | 0.05 | 0.10 | 10.29 | 15.65 | 1.4799 | 0.1561 | |||
| PSX / Phillips 66 | 0.08 | 0.00 | 10.07 | -3.39 | 1.4490 | -0.1026 | |||
| DEO / Diageo plc - Depositary Receipt (Common Stock) | 0.10 | 9.78 | 1.4062 | 1.4062 | |||||
| PKG / Packaging Corporation of America | 0.05 | 21.78 | 9.73 | 15.90 | 1.3991 | 0.1502 | |||
| AMGN / Amgen Inc. | 0.03 | 0.29 | 9.68 | -10.12 | 1.3921 | -0.2103 | |||
| CAH / Cardinal Health, Inc. | 0.06 | -2.78 | 9.48 | 18.55 | 1.3642 | 0.1737 | |||
| WY / Weyerhaeuser Company | 0.36 | 7.29 | 9.15 | -5.87 | 1.3168 | -0.1304 | |||
| PHG / Koninklijke Philips N.V. - Depositary Receipt (Common Stock) | 0.37 | 3.11 | 8.79 | -2.65 | 1.2638 | -0.0793 | |||
| USB / U.S. Bancorp | 0.19 | 0.00 | 8.73 | 7.18 | 1.2561 | 0.0436 | |||
| TAP / Molson Coors Beverage Company | 0.17 | -0.06 | 8.07 | -21.04 | 1.1612 | -0.3603 | |||
| BAM / Brookfield Asset Management Ltd. | 0.14 | 0.00 | 7.72 | 14.10 | 1.1109 | 0.1036 | |||
| NKE / NIKE, Inc. | 0.11 | 7.46 | 1.0732 | 1.0732 | |||||
| UNP / Union Pacific Corporation | 0.03 | 1.51 | 7.28 | -1.14 | 1.0479 | -0.0487 | |||
| O / Realty Income Corporation | 0.12 | -0.26 | 7.01 | -0.95 | 1.0086 | -0.0448 | |||
| PH / Parker-Hannifin Corporation | 0.01 | 0.00 | 6.90 | 14.90 | 0.9927 | 0.0990 | |||
| AL / Air Lease Corporation | 0.11 | -39.32 | 6.47 | -26.53 | 0.9301 | -0.3797 | |||
| GPC / Genuine Parts Company | 0.05 | 3.10 | 6.30 | 4.97 | 0.9056 | 0.0131 | |||
| PEP / PepsiCo, Inc. | 0.04 | 0.00 | 5.61 | -11.94 | 0.8075 | -0.1411 | |||
| NVT / nVent Electric plc | 0.02 | 1.94 | 1.54 | 42.42 | 0.2218 | 0.0607 | |||
| TPL / Texas Pacific Land Corporation | 0.00 | 16.75 | 1.51 | -6.91 | 0.2172 | -0.0242 | |||
| WRB / W. R. Berkley Corporation | 0.02 | 2.05 | 1.46 | 5.41 | 0.2103 | 0.0038 | |||
| JPM / JPMorgan Chase & Co. | 0.00 | -5.80 | 1.27 | 11.30 | 0.1830 | 0.0129 | |||
| AMP / Ameriprise Financial, Inc. | 0.00 | 0.00 | 1.20 | 10.31 | 0.1724 | 0.0106 | |||
| AXP / American Express Company | 0.00 | 0.86 | 1.19 | 19.56 | 0.1716 | 0.0231 | |||
| BRK.B / Berkshire Hathaway Inc. | 0.00 | 0.85 | 1.15 | -8.00 | 0.1655 | -0.0206 | |||
| ABBV / AbbVie Inc. | 0.01 | 0.00 | 0.93 | -11.42 | 0.1340 | -0.0225 | |||
| LH / Labcorp Holdings Inc. | 0.00 | 13.94 | 0.75 | 28.42 | 0.1080 | 0.0211 | |||
| GOOGL / Alphabet Inc. | 0.00 | 53.05 | 0.71 | 74.26 | 0.1024 | 0.0417 | |||
| BN / Brookfield Corporation | 0.01 | 4.64 | 0.70 | 23.58 | 0.1003 | 0.0163 | |||
| GPK / Graphic Packaging Holding Company | 0.03 | 16.12 | 0.65 | -5.78 | 0.0939 | -0.0092 | |||
| COHR / Coherent Corp. | 0.01 | 36.94 | 0.63 | 88.13 | 0.0913 | 0.0411 | |||
| REGN / Regeneron Pharmaceuticals, Inc. | 0.00 | 22.62 | 0.63 | 1.45 | 0.0905 | -0.0017 | |||
| MDLZ / Mondelez International, Inc. | 0.01 | 7.37 | 0.59 | 6.70 | 0.0848 | 0.0026 | |||
| BDX / Becton, Dickinson and Company | 0.00 | 45.77 | 0.58 | 9.71 | 0.0829 | 0.0047 | |||
| SOLV / Solventum Corporation | 0.01 | 76.92 | 0.56 | 76.58 | 0.0803 | 0.0332 | |||
| AZN / AstraZeneca PLC - Depositary Receipt (Common Stock) | 0.01 | 45.18 | 0.52 | 37.97 | 0.0743 | 0.0186 | |||
| CBOE / Cboe Global Markets, Inc. | 0.00 | -4.35 | 0.51 | -1.35 | 0.0737 | -0.0037 | |||
| CMI / Cummins Inc. | 0.00 | 59.75 | 0.46 | 67.15 | 0.0660 | 0.0251 | |||
| AVTR / Avantor, Inc. | 0.03 | 33.55 | 0.43 | 10.88 | 0.0617 | 0.0041 | |||
| IBKR / Interactive Brokers Group, Inc. | 0.01 | 306.37 | 0.38 | 36.07 | 0.0549 | 0.0131 | |||
| CLVT / Clarivate Plc | 0.08 | -0.47 | 0.36 | 9.04 | 0.0521 | 0.0026 | |||
| GLW / Corning Incorporated | 0.01 | 9.75 | 0.36 | 26.33 | 0.0511 | 0.0092 | |||
| TEL / TE Connectivity plc | 0.00 | 0.00 | 0.35 | 19.72 | 0.0498 | 0.0066 | |||
| WEC / WEC Energy Group, Inc. | 0.00 | 17.94 | 0.27 | 12.76 | 0.0394 | 0.0033 | |||
| BAC / Bank of America Corporation | 0.01 | 0.00 | 0.26 | 13.42 | 0.0378 | 0.0033 | |||
| DVN / Devon Energy Corporation | 0.01 | 21.17 | 0.23 | 3.08 | 0.0338 | -0.0001 | |||
| LOW / Lowe's Companies, Inc. | 0.00 | -96.25 | 0.22 | -96.45 | 0.0316 | -0.8858 | |||
| FDX / FedEx Corporation | 0.00 | -97.18 | 0.21 | -97.37 | 0.0301 | -1.1533 | |||
| TGT / Target Corporation | 0.00 | -96.24 | 0.20 | -96.45 | 0.0291 | -0.8181 | |||
| SCHW / The Charles Schwab Corporation | 0.00 | -100.00 | 0.00 | 0.0000 | |||||
| LEA / Lear Corporation | 0.00 | -100.00 | 0.00 | 0.0000 | |||||
| FTRE / Fortrea Holdings Inc. | 0.00 | -100.00 | 0.00 | 0.0000 | |||||
| BMY / Bristol-Myers Squibb Company | 0.00 | -100.00 | 0.00 | 0.0000 |