Mga Batayang Estadistika
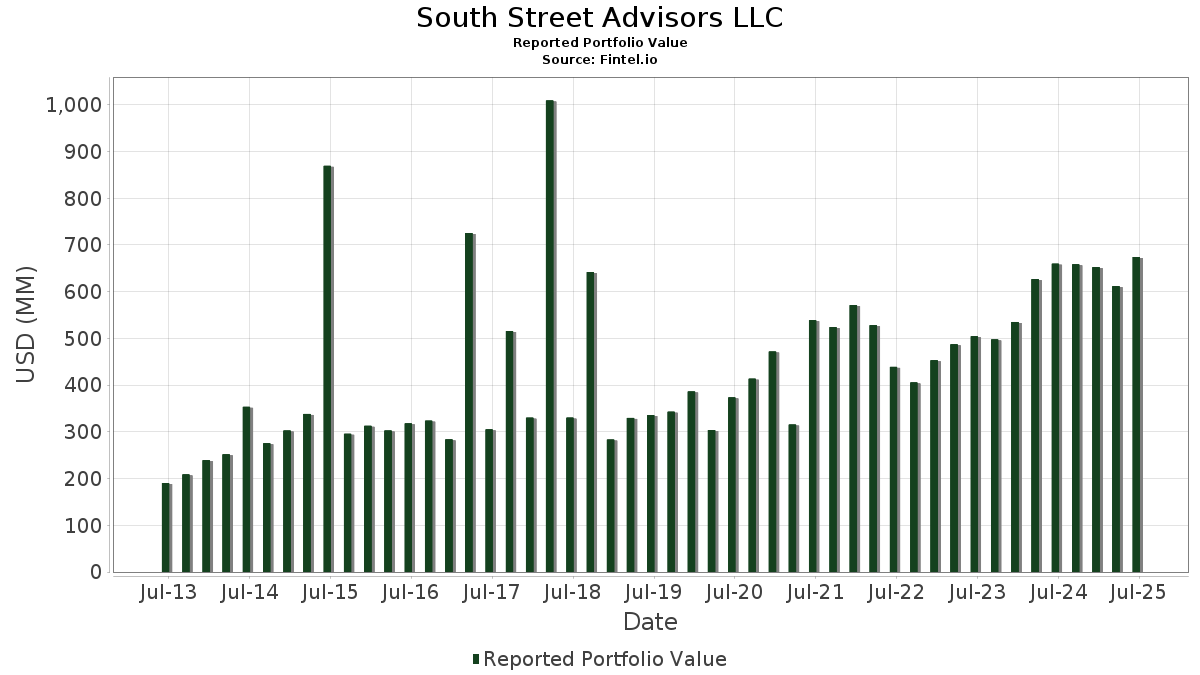
| Nilai Portofolio | $ 674,266,633 |
| Posisi Saat Ini | 64 |
Kepemilikan Terbaru, Kinerja, AUM (dari 13F, 13D)
South Street Advisors LLC telah mengungkapkan total kepemilikan 64 dalam pengajuan SEC terbaru mereka. Nilai portofolio terbaru dihitung sebesar $ 674,266,633 USD. Aset yang Dikelola (AUM) sebenarnya adalah nilai ini ditambah kas (yang tidak diungkapkan). Aset-aset utama South Street Advisors LLC adalah NVIDIA Corporation (US:NVDA) , Microsoft Corporation (US:MSFT) , Amphenol Corporation (US:APH) , Apple Inc. (US:AAPL) , and Howmet Aerospace Inc. (US:HWM) . Posisi baru South Street Advisors LLC meliputi: Primo Brands Corporation (US:PRMB) , Exelixis, Inc. (US:EXEL) , Trane Technologies plc (US:TT) , .
Peningkatan Tertinggi Kuartal Ini
Kami menggunakan perubahan dalam alokasi portofolio karena ini adalah metrik yang paling bermakna. Perubahan dapat disebabkan oleh perdagangan atau perubahan harga saham.
| Keamanan | Saham (MM) |
Nilai (Juta Dolar AS) |
Portfolio % | ΔPorsyento ng Portfolio |
|---|---|---|---|---|
| 0.37 | 58.48 | 8.6734 | 1.9429 | |
| 0.38 | 11.28 | 1.6736 | 1.6736 | |
| 0.34 | 33.12 | 4.9116 | 1.2324 | |
| 0.19 | 8.24 | 1.2225 | 1.2225 | |
| 0.07 | 25.23 | 3.7420 | 0.8995 | |
| 0.08 | 38.63 | 5.7295 | 0.8436 | |
| 0.14 | 26.17 | 3.8812 | 0.7846 | |
| 0.02 | 24.22 | 3.5920 | 0.5403 | |
| 0.02 | 18.44 | 2.7343 | 0.3588 | |
| 0.23 | 14.02 | 2.0800 | 0.2504 |
Penurunan Tertinggi Kuartal Ini
Kami menggunakan perubahan dalam alokasi portofolio karena ini adalah metrik yang paling bermakna. Perubahan dapat disebabkan oleh perdagangan atau perubahan harga saham.
| Keamanan | Saham (MM) |
Nilai (Juta Dolar AS) |
Portfolio % | ΔPorsyento ng Portfolio |
|---|---|---|---|---|
| 0.06 | 4.37 | 0.6486 | -1.3265 | |
| 0.13 | 27.02 | 4.0066 | -0.9035 | |
| 0.24 | 12.55 | 1.8614 | -0.6797 | |
| 0.03 | 21.50 | 3.1893 | -0.6037 | |
| 0.09 | 8.73 | 1.2945 | -0.4846 | |
| 0.19 | 16.85 | 2.4984 | -0.4766 | |
| 0.17 | 18.01 | 2.6717 | -0.4539 | |
| 0.08 | 6.89 | 1.0223 | -0.4090 | |
| 0.18 | 22.62 | 3.3554 | -0.3789 | |
| 0.06 | 21.71 | 3.2192 | -0.3534 |
Pengajuan 13F dan Dana
Formulir ini diajukan pada 2025-08-14 untuk periode pelaporan 2025-06-30. Klik ikon tautan untuk melihat riwayat transaksi selengkapnya.
Tingkatkan ke versi premium untuk membuka data premium dan ekspor ke Excel. ![]() .
.
| Keamanan | Ketik | Harga Saham Rata-rata | Saham (MM) |
ΔSaham (%) |
ΔSaham (%) |
Nilai ($MM) |
Portpolyo (%) |
ΔPortofolio (%) |
|
|---|---|---|---|---|---|---|---|---|---|
| NVDA / NVIDIA Corporation | 0.37 | -2.56 | 58.48 | 42.04 | 8.6734 | 1.9429 | |||
| MSFT / Microsoft Corporation | 0.08 | -2.46 | 38.63 | 29.25 | 5.7295 | 0.8436 | |||
| APH / Amphenol Corporation | 0.34 | -2.27 | 33.12 | 47.14 | 4.9116 | 1.2324 | |||
| AAPL / Apple Inc. | 0.13 | -2.63 | 27.02 | -10.06 | 4.0066 | -0.9035 | |||
| HWM / Howmet Aerospace Inc. | 0.14 | -3.71 | 26.17 | 38.15 | 3.8812 | 0.7846 | |||
| PWR / Quanta Services, Inc. | 0.07 | -2.45 | 25.23 | 45.11 | 3.7420 | 0.8995 | |||
| NOW / ServiceNow, Inc. | 0.02 | 0.46 | 24.22 | 29.74 | 3.5920 | 0.5403 | |||
| COOP / Mr. Cooper Group Inc. | 0.16 | -13.51 | 23.65 | 7.90 | 3.5071 | -0.0754 | |||
| USFD / US Foods Holding Corp. | 0.30 | -0.59 | 22.98 | 16.95 | 3.4075 | 0.1962 | |||
| TJX / The TJX Companies, Inc. | 0.18 | -2.32 | 22.62 | -0.96 | 3.3554 | -0.3789 | |||
| V / Visa Inc. | 0.06 | -1.97 | 21.71 | -0.69 | 3.2192 | -0.3534 | |||
| GOOGL / Alphabet Inc. | 0.12 | -2.10 | 21.58 | 11.56 | 3.2006 | 0.0385 | |||
| LLY / Eli Lilly and Company | 0.03 | -1.81 | 21.50 | -7.32 | 3.1893 | -0.6037 | |||
| HLT / Hilton Worldwide Holdings Inc. | 0.08 | -2.40 | 20.85 | 14.24 | 3.0923 | 0.1088 | |||
| META / Meta Platforms, Inc. | 0.02 | -0.93 | 18.44 | 26.86 | 2.7343 | 0.3588 | |||
| GFI / Gold Fields Limited - Depositary Receipt (Common Stock) | 0.77 | -2.99 | 18.17 | 3.95 | 2.6955 | -0.1626 | |||
| TPG / TPG Inc. | 0.34 | 6.34 | 18.06 | 17.59 | 2.6778 | 0.1679 | |||
| WEC / WEC Energy Group, Inc. | 0.17 | -1.46 | 18.01 | -5.78 | 2.6717 | -0.4539 | |||
| ORLY / O'Reilly Automotive, Inc. | 0.19 | 1,371.27 | 16.85 | -7.43 | 2.4984 | -0.4766 | |||
| AJG / Arthur J. Gallagher & Co. | 0.05 | 8.56 | 15.50 | 0.66 | 2.2994 | -0.2185 | |||
| CNM / Core & Main, Inc. | 0.23 | 0.31 | 14.02 | 25.30 | 2.0800 | 0.2504 | |||
| VICI / VICI Properties Inc. | 0.41 | 15.59 | 13.52 | 15.52 | 2.0057 | 0.0919 | |||
| HALO / Halozyme Therapeutics, Inc. | 0.24 | -0.96 | 12.55 | -19.26 | 1.8614 | -0.6797 | |||
| LRN / Stride, Inc. | 0.08 | -1.14 | 11.97 | 13.46 | 1.7749 | 0.0507 | |||
| PR / Permian Resources Corporation | 0.87 | 9.76 | 11.82 | 7.94 | 1.7530 | -0.0371 | |||
| RTX / RTX Corporation | 0.08 | 4.38 | 11.51 | 15.07 | 1.7068 | 0.0719 | |||
| PRMB / Primo Brands Corporation | 0.38 | 11.28 | 1.6736 | 1.6736 | |||||
| LOW / Lowe's Companies, Inc. | 0.04 | -1.14 | 9.64 | -5.95 | 1.4297 | -0.2458 | |||
| ONTO / Onto Innovation Inc. | 0.09 | -3.59 | 8.73 | -19.80 | 1.2945 | -0.4846 | |||
| EXEL / Exelixis, Inc. | 0.19 | 8.24 | 1.2225 | 1.2225 | |||||
| BX / Blackstone Inc. | 0.05 | -1.49 | 8.06 | 5.42 | 1.1953 | -0.0545 | |||
| KBR / KBR, Inc. | 0.17 | -6.88 | 7.94 | -10.38 | 1.1781 | -0.2707 | |||
| MA / Mastercard Incorporated | 0.01 | -1.42 | 7.24 | 1.06 | 1.0740 | -0.0972 | |||
| OKE / ONEOK, Inc. | 0.08 | -4.31 | 6.89 | -21.28 | 1.0223 | -0.4090 | |||
| EXTR / Extreme Networks, Inc. | 0.28 | -8.16 | 5.10 | 24.62 | 0.7568 | 0.0874 | |||
| NVO / Novo Nordisk A/S - Depositary Receipt (Common Stock) | 0.06 | -63.58 | 4.37 | -63.81 | 0.6486 | -1.3265 | |||
| ETN / Eaton Corporation plc | 0.01 | -8.78 | 4.36 | 19.80 | 0.6462 | 0.0517 | |||
| AMZN / Amazon.com, Inc. | 0.02 | 0.06 | 3.69 | 15.38 | 0.5474 | 0.0245 | |||
| JPM / JPMorgan Chase & Co. | 0.01 | 0.28 | 2.55 | 18.52 | 0.3787 | 0.0265 | |||
| QCOM / QUALCOMM Incorporated | 0.01 | -11.62 | 2.34 | -8.35 | 0.3466 | -0.0703 | |||
| ABBV / AbbVie Inc. | 0.01 | -8.77 | 2.13 | -19.17 | 0.3158 | -0.1149 | |||
| BRK.B / Berkshire Hathaway Inc. | 0.00 | -1.28 | 1.50 | -9.94 | 0.2231 | -0.0500 | |||
| CRC / California Resources Corporation | 0.03 | -55.55 | 1.48 | -53.83 | 0.2191 | -0.3040 | |||
| XOM / Exxon Mobil Corporation | 0.01 | -0.27 | 1.09 | -9.59 | 0.1623 | -0.0356 | |||
| MCD / McDonald's Corporation | 0.00 | 0.00 | 1.06 | -6.46 | 0.1568 | -0.0280 | |||
| GOOG / Alphabet Inc. | 0.01 | 0.00 | 0.89 | 13.54 | 0.1319 | 0.0039 | |||
| JNJ / Johnson & Johnson | 0.01 | 0.00 | 0.86 | -7.94 | 0.1274 | -0.0251 | |||
| LIN / Linde plc | 0.00 | 0.00 | 0.83 | 0.85 | 0.1236 | -0.0116 | |||
| PSX / Phillips 66 | 0.01 | 0.00 | 0.72 | -3.38 | 0.1062 | -0.0149 | |||
| EPD / Enterprise Products Partners L.P. - Limited Partnership | 0.02 | -2.39 | 0.70 | -11.32 | 0.1034 | -0.0251 | |||
| DIS / The Walt Disney Company | 0.00 | -12.11 | 0.42 | 10.42 | 0.0630 | 0.0001 | |||
| GS / The Goldman Sachs Group, Inc. | 0.00 | 0.00 | 0.42 | 29.66 | 0.0630 | 0.0094 | |||
| MAS / Masco Corporation | 0.01 | 0.00 | 0.42 | -7.52 | 0.0620 | -0.0118 | |||
| DHR / Danaher Corporation | 0.00 | 2.35 | 0.41 | -1.44 | 0.0612 | -0.0072 | |||
| CVX / Chevron Corporation | 0.00 | 0.00 | 0.37 | -14.25 | 0.0553 | -0.0159 | |||
| NSC / Norfolk Southern Corporation | 0.00 | 0.00 | 0.35 | 8.15 | 0.0512 | -0.0010 | |||
| CAT / Caterpillar Inc. | 0.00 | 0.00 | 0.33 | 17.69 | 0.0484 | 0.0031 | |||
| TSM / Taiwan Semiconductor Manufacturing Company Limited - Depositary Receipt (Common Stock) | 0.00 | -1.61 | 0.28 | 34.63 | 0.0410 | 0.0073 | |||
| PG / The Procter & Gamble Company | 0.00 | 0.00 | 0.26 | -6.50 | 0.0385 | -0.0069 | |||
| CL / Colgate-Palmolive Company | 0.00 | 0.00 | 0.24 | -2.88 | 0.0351 | -0.0048 | |||
| ALL / The Allstate Corporation | 0.00 | 0.00 | 0.23 | -2.92 | 0.0346 | -0.0046 | |||
| ZTS / Zoetis Inc. | 0.00 | 0.00 | 0.23 | -5.06 | 0.0334 | -0.0055 | |||
| XPO / XPO, Inc. | 0.00 | 0.22 | 0.0325 | 0.0325 | |||||
| TT / Trane Technologies plc | 0.00 | 0.20 | 0.0302 | 0.0302 | |||||
| MUR / Murphy Oil Corporation | 0.00 | -100.00 | 0.00 | 0.0000 | |||||
| AM / Antero Midstream Corporation | 0.00 | -100.00 | 0.00 | 0.0000 | |||||
| HESM / Hess Midstream LP | 0.00 | -100.00 | 0.00 | 0.0000 | |||||
| RHP / Ryman Hospitality Properties, Inc. | 0.00 | -100.00 | 0.00 | 0.0000 | |||||
| PEP / PepsiCo, Inc. | 0.00 | -100.00 | 0.00 | 0.0000 |