Mga Batayang Estadistika
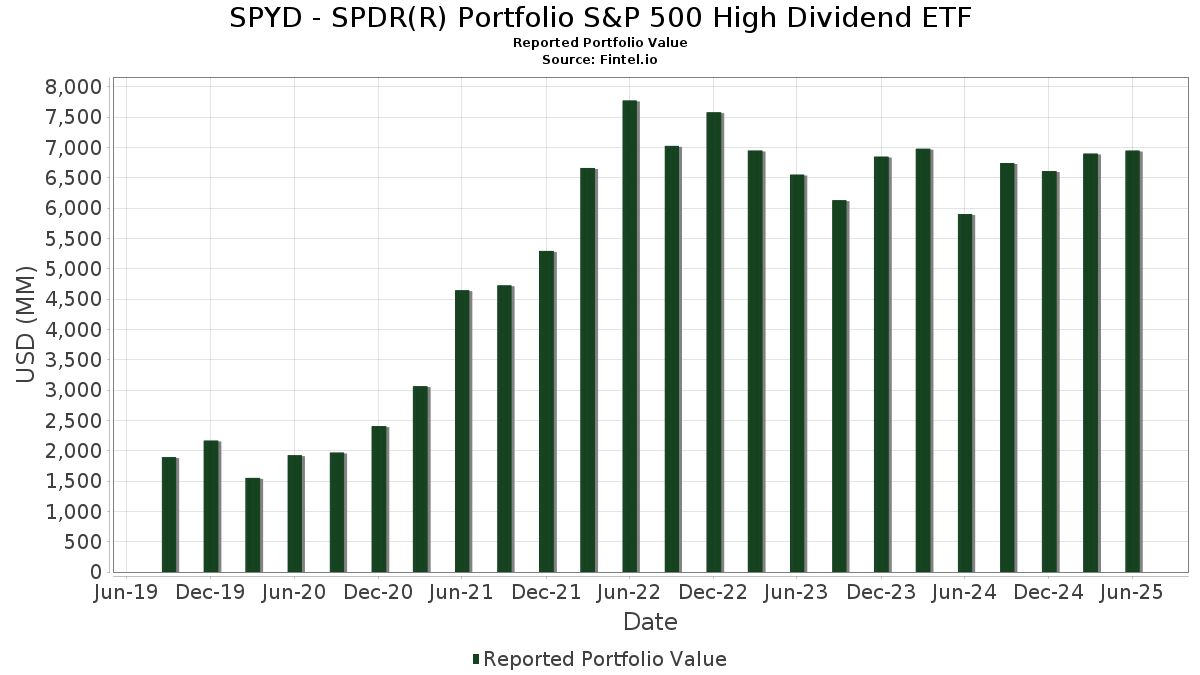
| Nilai Portofolio | $ 6,948,153,271 |
| Posisi Saat Ini | 79 |
Kepemilikan Terbaru, Kinerja, AUM (dari 13F, 13D)
SPYD - SPDR(R) Portfolio S&P 500 High Dividend ETF telah mengungkapkan total kepemilikan 79 dalam pengajuan SEC terbaru mereka. Nilai portofolio terbaru dihitung sebesar $ 6,948,153,271 USD. Aset yang Dikelola (AUM) sebenarnya adalah nilai ini ditambah kas (yang tidak diungkapkan). Aset-aset utama SPYD - SPDR(R) Portfolio S&P 500 High Dividend ETF adalah Philip Morris International Inc. (US:PM) , Hasbro, Inc. (US:HAS) , AT&T Inc. (US:T) , CVS Health Corporation (US:CVS) , and Franklin Resources, Inc. (US:BEN) .
Peningkatan Tertinggi Kuartal Ini
Kami menggunakan perubahan dalam alokasi portofolio karena ini adalah metrik yang paling bermakna. Perubahan dapat disebabkan oleh perdagangan atau perubahan harga saham.
| Keamanan | Saham (MM) |
Nilai (Juta Dolar AS) |
Portfolio % | ΔPorsyento ng Portfolio |
|---|---|---|---|---|
| 74.06 | 74.06 | 1.0828 | 1.0125 | |
| 4.53 | 107.99 | 1.5788 | 0.3563 | |
| 1.58 | 116.95 | 1.7098 | 0.3435 | |
| 0.71 | 130.18 | 1.9032 | 0.3120 | |
| 5.28 | 88.51 | 1.2940 | 0.1806 | |
| 1.80 | 94.91 | 1.3876 | 0.1749 | |
| 8.99 | 97.53 | 1.4258 | 0.1613 | |
| 1.92 | 85.92 | 1.2561 | 0.1547 | |
| 5.14 | 89.50 | 1.3084 | 0.1545 | |
| 3.71 | 87.31 | 1.2764 | 0.1434 |
Penurunan Tertinggi Kuartal Ini
Kami menggunakan perubahan dalam alokasi portofolio karena ini adalah metrik yang paling bermakna. Perubahan dapat disebabkan oleh perdagangan atau perubahan harga saham.
| Keamanan | Saham (MM) |
Nilai (Juta Dolar AS) |
Portfolio % | ΔPorsyento ng Portfolio |
|---|---|---|---|---|
| 1.53 | 70.69 | 1.0335 | -0.2706 | |
| 3.53 | 72.35 | 1.0578 | -0.2622 | |
| 2.34 | 71.65 | 1.0475 | -0.2591 | |
| 2.20 | 58.34 | 0.8529 | -0.2240 | |
| 0.90 | 65.13 | 0.9522 | -0.2092 | |
| 0.88 | 86.26 | 1.2612 | -0.1955 | |
| 0.87 | 71.17 | 1.0404 | -0.1706 | |
| 1.18 | 68.16 | 0.9965 | -0.1646 | |
| 7.83 | 82.37 | 1.2042 | -0.1618 | |
| 3.10 | 80.02 | 1.1698 | -0.1548 |
Pengajuan 13F dan Dana
Formulir ini diajukan pada 2025-08-28 untuk periode pelaporan 2025-06-30. Klik ikon tautan untuk melihat riwayat transaksi selengkapnya.
Tingkatkan ke versi premium untuk membuka data premium dan ekspor ke Excel. ![]() .
.
| Keamanan | Ketik | Harga Saham Rata-rata | Saham (MM) |
ΔSaham (%) |
ΔSaham (%) |
Nilai ($MM) |
Portpolyo (%) |
ΔPortofolio (%) |
|
|---|---|---|---|---|---|---|---|---|---|
| PM / Philip Morris International Inc. | 0.71 | 3.07 | 130.18 | 18.27 | 1.9032 | 0.3120 | |||
| HAS / Hasbro, Inc. | 1.58 | 3.07 | 116.95 | 23.74 | 1.7098 | 0.3435 | |||
| T / AT&T Inc. | 4.00 | 3.07 | 115.87 | 5.48 | 1.6941 | 0.1060 | |||
| CVS / CVS Health Corporation | 1.67 | 3.07 | 115.03 | 4.94 | 1.6818 | 0.0972 | |||
| BEN / Franklin Resources, Inc. | 4.53 | 3.07 | 107.99 | 27.69 | 1.5788 | 0.3563 | |||
| CCI / Crown Castle Inc. | 1.03 | 3.07 | 105.60 | 1.59 | 1.5439 | 0.0412 | |||
| ES / Eversource Energy | 1.62 | 3.06 | 102.76 | 5.57 | 1.5023 | 0.0952 | |||
| MO / Altria Group, Inc. | 1.75 | 3.07 | 102.47 | 0.68 | 1.4981 | 0.0268 | |||
| ED / Consolidated Edison, Inc. | 1.00 | 3.07 | 100.75 | -6.47 | 1.4730 | -0.0843 | |||
| EXC / Exelon Corporation | 2.31 | 3.06 | 100.30 | -2.89 | 1.4663 | -0.0266 | |||
| VICI / VICI Properties Inc. | 3.07 | 3.07 | 100.18 | 3.00 | 1.4647 | 0.0587 | |||
| SO / The Southern Company | 1.09 | 3.07 | 100.06 | 2.93 | 1.4629 | 0.0576 | |||
| VZ / Verizon Communications Inc. | 2.30 | 3.07 | 99.54 | -1.68 | 1.4554 | -0.0083 | |||
| ABBV / AbbVie Inc. | 0.53 | 3.22 | 99.30 | -8.55 | 1.4517 | -0.1179 | |||
| EVRG / Evergy, Inc. | 1.43 | 3.07 | 98.71 | 3.04 | 1.4432 | 0.0583 | |||
| DUK / Duke Energy Corporation | 0.83 | 3.06 | 97.70 | -0.29 | 1.4284 | 0.0119 | |||
| F / Ford Motor Company | 8.99 | 3.07 | 97.53 | 11.49 | 1.4258 | 0.1613 | |||
| WEC / WEC Energy Group, Inc. | 0.93 | 3.07 | 96.71 | -1.45 | 1.4139 | -0.0047 | |||
| O / Realty Income Corporation | 1.67 | 3.06 | 96.44 | 2.35 | 1.4099 | 0.0479 | |||
| D / Dominion Energy, Inc. | 1.70 | 3.06 | 96.13 | 3.89 | 1.4055 | 0.0678 | |||
| AEP / American Electric Power Company, Inc. | 0.93 | 3.07 | 96.13 | -2.13 | 1.4055 | -0.0145 | |||
| WMB / The Williams Companies, Inc. | 1.53 | 3.06 | 95.91 | 8.32 | 1.4022 | 0.1222 | |||
| PNW / Pinnacle West Capital Corporation | 1.06 | 3.22 | 95.07 | -3.04 | 1.3899 | -0.0275 | |||
| ADM / Archer-Daniels-Midland Company | 1.80 | 2.91 | 94.91 | 13.14 | 1.3876 | 0.1749 | |||
| FE / FirstEnergy Corp. | 2.32 | 3.22 | 93.54 | 2.82 | 1.3676 | 0.0524 | |||
| ESS / Essex Property Trust, Inc. | 0.33 | 3.05 | 92.75 | -4.74 | 1.3560 | -0.0515 | |||
| CPT / Camden Property Trust | 0.82 | 3.06 | 92.65 | -5.03 | 1.3545 | -0.0558 | |||
| KVUE / Kenvue Inc. | 4.38 | 3.22 | 91.76 | -9.91 | 1.3415 | -0.1309 | |||
| UDR / UDR, Inc. | 2.24 | 3.23 | 91.53 | -6.69 | 1.3382 | -0.0799 | |||
| PSA / Public Storage | 0.31 | 3.24 | 91.49 | 1.22 | 1.3376 | 0.0309 | |||
| KMB / Kimberly-Clark Corporation | 0.71 | 3.21 | 91.46 | -6.44 | 1.3372 | -0.0760 | |||
| MAA / Mid-America Apartment Communities, Inc. | 0.61 | 3.23 | 90.86 | -8.83 | 1.3284 | -0.1123 | |||
| REG / Regency Centers Corporation | 1.27 | 3.23 | 90.42 | -0.31 | 1.3220 | 0.0107 | |||
| EQR / Equity Residential | 1.33 | 3.23 | 90.09 | -2.67 | 1.3172 | -0.0210 | |||
| KEY / KeyCorp | 5.14 | 2.92 | 89.50 | 12.12 | 1.3084 | 0.1545 | |||
| HRL / Hormel Foods Corporation | 2.94 | 2.91 | 88.98 | 0.62 | 1.3008 | 0.0225 | |||
| PSX / Phillips 66 | 0.75 | 2.91 | 88.92 | -0.57 | 1.3000 | 0.0072 | |||
| HBAN / Huntington Bancshares Incorporated | 5.28 | 2.92 | 88.51 | 14.91 | 1.2940 | 0.1806 | |||
| KMI / Kinder Morgan, Inc. | 3.00 | 2.92 | 88.22 | 6.05 | 1.2898 | 0.0873 | |||
| PFG / Principal Financial Group, Inc. | 1.11 | 2.91 | 88.16 | -3.12 | 1.2889 | -0.0265 | |||
| EXR / Extra Space Storage Inc. | 0.60 | 2.90 | 88.08 | 2.17 | 1.2878 | 0.0415 | |||
| RF / Regions Financial Corporation | 3.71 | 2.92 | 87.31 | 11.40 | 1.2764 | 0.1434 | |||
| SJM / The J. M. Smucker Company | 0.88 | 3.23 | 86.26 | -14.39 | 1.2612 | -0.1955 | |||
| CFG / Citizens Financial Group, Inc. | 1.92 | 3.24 | 85.92 | 12.77 | 1.2561 | 0.1547 | |||
| AMCR / Amcor plc | 9.31 | 2.91 | 85.53 | -2.50 | 1.2504 | -0.0176 | |||
| FITB / Fifth Third Bancorp | 2.06 | 3.24 | 84.83 | 8.33 | 1.2402 | 0.1082 | |||
| PFE / Pfizer Inc. | 3.49 | 3.24 | 84.66 | -1.24 | 1.2377 | -0.0015 | |||
| SPG / Simon Property Group, Inc. | 0.52 | 3.23 | 84.06 | -0.07 | 1.2289 | 0.0129 | |||
| USB / U.S. Bancorp | 1.85 | 2.92 | 83.76 | 10.31 | 1.2246 | 0.1269 | |||
| CVX / Chevron Corporation | 0.58 | 2.93 | 83.56 | -11.90 | 1.2217 | -0.1495 | |||
| BXP / Boston Properties, Inc. | 1.24 | 3.06 | 83.43 | 3.49 | 1.2197 | 0.0543 | |||
| TFC / Truist Financial Corporation | 1.94 | 3.24 | 83.35 | 7.86 | 1.2185 | 0.1015 | |||
| KIM / Kimco Realty Corporation | 3.96 | 2.92 | 83.30 | 1.85 | 1.2179 | 0.0355 | |||
| PRU / Prudential Financial, Inc. | 0.77 | 2.92 | 83.19 | -0.99 | 1.2163 | 0.0016 | |||
| AES / The AES Corporation | 7.83 | 2.91 | 82.37 | -12.84 | 1.2042 | -0.1618 | |||
| HST / Host Hotels & Resorts, Inc. | 5.36 | 2.92 | 82.36 | 11.25 | 1.2041 | 0.1339 | |||
| 3IW / Invesco Ltd. | 5.17 | 3.25 | 81.51 | 7.33 | 1.1917 | 0.0938 | |||
| FRT / Federal Realty Investment Trust | 0.85 | 2.92 | 80.99 | -0.05 | 1.1840 | 0.0127 | |||
| KHC / The Kraft Heinz Company | 3.10 | 2.91 | 80.02 | -12.68 | 1.1698 | -0.1548 | |||
| EIX / Edison International | 1.54 | 2.91 | 79.61 | -9.87 | 1.1639 | -0.1130 | |||
| GIS / General Mills, Inc. | 1.51 | 3.24 | 78.18 | -10.54 | 1.1431 | -0.1204 | |||
| IPG / The Interpublic Group of Companies, Inc. | 3.19 | 3.24 | 78.16 | -6.94 | 1.1427 | -0.0715 | |||
| TROW / T. Rowe Price Group, Inc. | 0.80 | 3.25 | 76.99 | 8.45 | 1.1257 | 0.0994 | |||
| DOC / Healthpeak Properties, Inc. | 4.37 | 3.24 | 76.60 | -10.59 | 1.1199 | -0.1186 | |||
| GVMXX / State Street Institutional Investment Trust - State Street Institutional US Govt Money Market Fnd Premier Cls | 74.06 | 1,423.63 | 74.06 | 1,423.93 | 1.0828 | 1.0125 | |||
| VTRS / Viatris Inc. | 8.14 | 3.25 | 72.66 | 5.86 | 1.0623 | 0.0700 | |||
| CAG / Conagra Brands, Inc. | 3.53 | 3.24 | 72.35 | -20.76 | 1.0578 | -0.2622 | |||
| BBY / Best Buy Co., Inc. | 1.08 | 3.25 | 72.20 | -5.84 | 1.0555 | -0.0529 | |||
| CPB / The Campbell's Company | 2.34 | 3.24 | 71.65 | -20.73 | 1.0475 | -0.2591 | |||
| APA / APA Corporation | 3.91 | 3.26 | 71.48 | -10.15 | 1.0450 | -0.1050 | |||
| OKE / ONEOK, Inc. | 0.87 | 3.26 | 71.17 | -15.05 | 1.0404 | -0.1706 | |||
| IP / International Paper Company | 1.52 | 3.25 | 71.02 | -9.37 | 1.0383 | -0.0945 | |||
| BMY / Bristol-Myers Squibb Company | 1.53 | 3.25 | 70.69 | -21.64 | 1.0335 | -0.2706 | |||
| SWK / Stanley Black & Decker, Inc. | 1.03 | 3.26 | 70.03 | -9.01 | 1.0239 | -0.0887 | |||
| UPS / United Parcel Service, Inc. | 0.69 | 3.26 | 69.15 | -5.24 | 1.0110 | -0.0439 | |||
| LYB / LyondellBasell Industries N.V. | 1.18 | 3.25 | 68.16 | -15.14 | 0.9965 | -0.1646 | |||
| ARE / Alexandria Real Estate Equities, Inc. | 0.90 | 3.26 | 65.13 | -18.93 | 0.9522 | -0.2092 | |||
| DOW / Dow Inc. | 2.20 | 3.27 | 58.34 | -21.69 | 0.8529 | -0.2240 | |||
| S+P500 EMINI FUT SEP25 / DE (000000000) | 0.90 | 0.0131 | 0.0131 |