Mga Batayang Estadistika
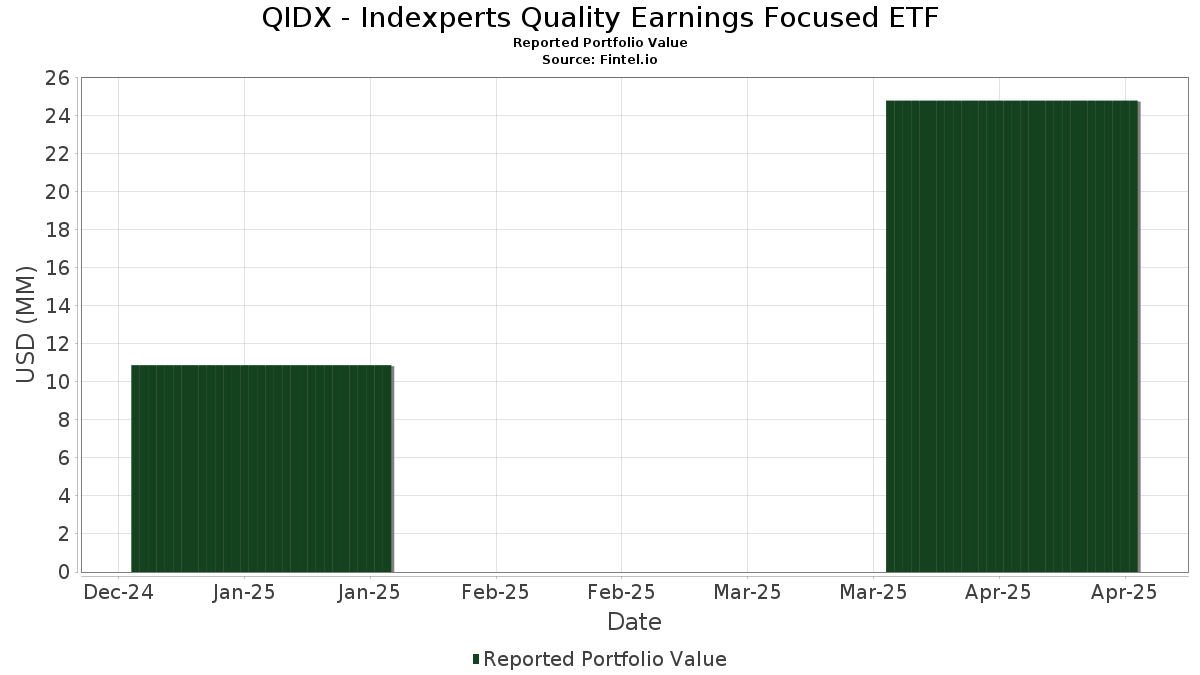
| Nilai Portofolio | $ 24,806,116 |
| Posisi Saat Ini | 131 |
Kepemilikan Terbaru, Kinerja, AUM (dari 13F, 13D)
QIDX - Indexperts Quality Earnings Focused ETF telah mengungkapkan total kepemilikan 131 dalam pengajuan SEC terbaru mereka. Nilai portofolio terbaru dihitung sebesar $ 24,806,116 USD. Aset yang Dikelola (AUM) sebenarnya adalah nilai ini ditambah kas (yang tidak diungkapkan). Aset-aset utama QIDX - Indexperts Quality Earnings Focused ETF adalah T-Mobile US, Inc. (US:TMUS) , American Express Company (US:AXP) , Walmart Inc. (US:WMT) , The Williams Companies, Inc. (US:WMB) , and Arista Networks Inc (US:ANET) . Posisi baru QIDX - Indexperts Quality Earnings Focused ETF meliputi: Amcor plc (US:AMCR) , .
Peningkatan Tertinggi Kuartal Ini
Kami menggunakan perubahan dalam alokasi portofolio karena ini adalah metrik yang paling bermakna. Perubahan dapat disebabkan oleh perdagangan atau perubahan harga saham.
| Keamanan | Saham (MM) |
Nilai (Juta Dolar AS) |
Portfolio % | ΔPorsyento ng Portfolio |
|---|---|---|---|---|
| 0.01 | 0.13 | 0.5400 | 0.5400 | |
| 0.01 | 0.52 | 2.1100 | 0.3900 | |
| 0.00 | 0.45 | 1.8000 | 0.3300 | |
| 0.00 | 0.80 | 3.2200 | 0.3200 | |
| 0.00 | 0.47 | 1.9100 | 0.2800 | |
| 0.00 | 0.45 | 1.8000 | 0.2600 | |
| 0.01 | 0.60 | 2.4100 | 0.2400 | |
| 0.01 | 0.41 | 1.6300 | 0.2400 | |
| 0.00 | 0.24 | 0.9700 | 0.2100 | |
| 0.00 | 0.24 | 0.9600 | 0.2100 |
Penurunan Tertinggi Kuartal Ini
Kami menggunakan perubahan dalam alokasi portofolio karena ini adalah metrik yang paling bermakna. Perubahan dapat disebabkan oleh perdagangan atau perubahan harga saham.
| Keamanan | Saham (MM) |
Nilai (Juta Dolar AS) |
Portfolio % | ΔPorsyento ng Portfolio |
|---|---|---|---|---|
| 0.01 | 0.58 | 2.3500 | -0.6400 | |
| 0.00 | 0.39 | 1.5700 | -0.5200 | |
| 0.00 | 0.41 | 1.6400 | -0.4600 | |
| 0.00 | 0.63 | 2.5300 | -0.4300 | |
| 0.00 | 0.00 | -0.3500 | ||
| 0.00 | 0.00 | -0.3500 | ||
| 0.07 | 0.07 | 0.2700 | -0.3100 | |
| 0.00 | 0.33 | 1.3200 | -0.2000 | |
| 0.00 | 0.13 | 0.5100 | -0.1800 | |
| 0.00 | 0.09 | 0.3600 | -0.1800 |
Pengajuan 13F dan Dana
Formulir ini diajukan pada 2025-06-25 untuk periode pelaporan 2025-04-30. Klik ikon tautan untuk melihat riwayat transaksi selengkapnya.
Tingkatkan ke versi premium untuk membuka data premium dan ekspor ke Excel. ![]() .
.
| Keamanan | Ketik | Harga Saham Rata-rata | Saham (MM) |
ΔSaham (%) |
ΔSaham (%) |
Nilai ($MM) |
Portpolyo (%) |
ΔPortofolio (%) |
|
|---|---|---|---|---|---|---|---|---|---|
| TMUS / T-Mobile US, Inc. | 0.00 | 139.22 | 0.80 | 153.65 | 3.2200 | 0.3200 | |||
| AXP / American Express Company | 0.00 | 132.38 | 0.63 | 95.33 | 2.5300 | -0.4300 | |||
| WMT / Walmart Inc. | 0.01 | 139.42 | 0.61 | 137.25 | 2.4400 | 0.0900 | |||
| WMB / The Williams Companies, Inc. | 0.01 | 139.69 | 0.60 | 154.04 | 2.4100 | 0.2400 | |||
| ANET / Arista Networks Inc | 0.01 | 150.89 | 0.58 | 79.08 | 2.3500 | -0.6400 | |||
| FTXP / Foothills Exploration, Inc. | 0.00 | 144.90 | 0.54 | 133.77 | 2.1800 | 0.0500 | |||
| COST / Costco Wholesale Corporation | 0.00 | 122.88 | 0.52 | 126.41 | 2.1100 | -0.0200 | |||
| KR / The Kroger Co. | 0.01 | 138.73 | 0.52 | 180.65 | 2.1100 | 0.3900 | |||
| BRK.B / Berkshire Hathaway Inc. | 0.00 | 134.92 | 0.47 | 167.23 | 1.9100 | 0.2800 | |||
| LLY / Eli Lilly and Company | 0.00 | 117.17 | 0.45 | 141.49 | 1.8300 | 0.0900 | |||
| AZO / AutoZone, Inc. | 0.00 | 138.00 | 0.45 | 167.66 | 1.8000 | 0.2600 | |||
| COR / Cencora, Inc. | 0.00 | 142.54 | 0.45 | 179.38 | 1.8000 | 0.3300 | |||
| CSCO / Cisco Systems, Inc. | 0.01 | 143.41 | 0.44 | 132.28 | 1.7700 | 0.0300 | |||
| PAYX / Paychex, Inc. | 0.00 | 139.65 | 0.44 | 139.89 | 1.7700 | 0.0800 | |||
| MCO / Moody's Corporation | 0.00 | 136.88 | 0.43 | 115.42 | 1.7500 | -0.1000 | |||
| BR / Broadridge Financial Solutions, Inc. | 0.00 | 140.87 | 0.43 | 145.98 | 1.7300 | 0.1200 | |||
| SPGI / S&P Global Inc. | 0.00 | 138.95 | 0.41 | 129.61 | 1.6600 | 0.0100 | |||
| GOOGL / Alphabet Inc. | 0.00 | 129.70 | 0.41 | 78.51 | 1.6400 | -0.4600 | |||
| VZ / Verizon Communications Inc. | 0.01 | 139.82 | 0.41 | 168.21 | 1.6300 | 0.2400 | |||
| ABT / Abbott Laboratories | 0.00 | 131.12 | 0.40 | 137.28 | 1.6200 | 0.0600 | |||
| SYK / Stryker Corporation | 0.00 | 136.18 | 0.39 | 125.29 | 1.5800 | -0.0200 | |||
| VICI / VICI Properties Inc. | 0.01 | 139.42 | 0.39 | 158.28 | 1.5700 | 0.1800 | |||
| TMO / Thermo Fisher Scientific Inc. | 0.00 | 139.47 | 0.39 | 71.81 | 1.5700 | -0.5200 | |||
| GWW / W.W. Grainger, Inc. | 0.00 | 117.47 | 0.37 | 109.66 | 1.4900 | -0.1300 | |||
| XOM / Exxon Mobil Corporation | 0.00 | 139.42 | 0.37 | 137.42 | 1.4800 | 0.0500 | |||
| CTSH / Cognizant Technology Solutions Corporation | 0.00 | 142.61 | 0.34 | 116.77 | 1.3600 | -0.0700 | |||
| CAT / Caterpillar Inc. | 0.00 | 137.44 | 0.33 | 98.18 | 1.3200 | -0.2000 | |||
| HRL / Hormel Foods Corporation | 0.01 | 139.00 | 0.31 | 138.28 | 1.2300 | 0.0500 | |||
| NFLX / Netflix, Inc. | 0.00 | 135.14 | 0.30 | 173.15 | 1.1900 | 0.1900 | |||
| AMAT / Applied Materials, Inc. | 0.00 | 142.53 | 0.27 | 103.79 | 1.0800 | -0.1400 | |||
| PGR / The Progressive Corporation | 0.00 | 154.93 | 0.24 | 192.68 | 0.9700 | 0.2100 | |||
| NGVC / Natural Grocers by Vitamin Cottage, Inc. | 0.00 | 154.03 | 0.24 | 193.83 | 0.9600 | 0.2100 | |||
| ADBE / Adobe Inc. | 0.00 | 128.94 | 0.23 | 96.64 | 0.9400 | -0.1600 | |||
| IBM / International Business Machines Corporation | 0.00 | 136.01 | 0.21 | 123.91 | 0.8300 | -0.0200 | |||
| ORLY / O'Reilly Automotive, Inc. | 0.00 | 145.76 | 0.21 | 169.74 | 0.8300 | 0.1300 | |||
| TJX / The TJX Companies, Inc. | 0.00 | 135.78 | 0.20 | 143.37 | 0.8200 | 0.0500 | |||
| NOW / ServiceNow, Inc. | 0.00 | 140.48 | 0.19 | 125.88 | 0.7800 | -0.0100 | |||
| VRSK / Verisk Analytics, Inc. | 0.00 | 137.50 | 0.19 | 144.87 | 0.7700 | 0.0500 | |||
| TPB / Turning Point Brands, Inc. | 0.00 | 156.52 | 0.19 | 146.75 | 0.7700 | 0.0600 | |||
| VRTX / Vertex Pharmaceuticals Incorporated | 0.00 | 123.78 | 0.19 | 148.00 | 0.7500 | 0.0500 | |||
| TRV / The Travelers Companies, Inc. | 0.00 | 136.73 | 0.18 | 154.17 | 0.7400 | 0.0800 | |||
| MA / Mastercard Incorporated | 0.00 | 134.29 | 0.18 | 132.47 | 0.7200 | 0.0100 | |||
| BJ / BJ's Wholesale Club Holdings, Inc. | 0.00 | 144.64 | 0.18 | 193.44 | 0.7200 | 0.1500 | |||
| CW / Curtiss-Wright Corporation | 0.00 | 128.32 | 0.18 | 126.92 | 0.7200 | 0.0000 | |||
| FICO / Fair Isaac Corporation | 0.00 | 154.29 | 0.18 | 172.31 | 0.7100 | 0.1100 | |||
| NFG / National Fuel Gas Company | 0.00 | 146.42 | 0.18 | 170.77 | 0.7100 | 0.1100 | |||
| CI / The Cigna Group | 0.00 | 128.32 | 0.18 | 165.15 | 0.7100 | 0.1000 | |||
| LHX / L3Harris Technologies, Inc. | 0.00 | 122.88 | 0.17 | 130.67 | 0.7000 | 0.0100 | |||
| CASY / Casey's General Stores, Inc. | 0.00 | 147.02 | 0.17 | 173.02 | 0.7000 | 0.1100 | |||
| HLT / Hilton Worldwide Holdings Inc. | 0.00 | 143.45 | 0.17 | 113.75 | 0.6900 | -0.0500 | |||
| LIN / Linde plc | 0.00 | 121.79 | 0.16 | 126.09 | 0.6300 | -0.0100 | |||
| CF / CF Industries Holdings, Inc. | 0.00 | 140.92 | 0.16 | 103.95 | 0.6300 | -0.0700 | |||
| CDNS / Cadence Design Systems, Inc. | 0.00 | 148.80 | 0.15 | 148.39 | 0.6200 | 0.0500 | |||
| MSFT / Microsoft Corporation | 0.00 | 125.30 | 0.15 | 116.18 | 0.6000 | -0.0300 | |||
| THG / The Hanover Insurance Group, Inc. | 0.00 | 160.65 | 0.15 | 186.27 | 0.5900 | 0.1100 | |||
| LOW / Lowe's Companies, Inc. | 0.00 | 136.86 | 0.15 | 104.23 | 0.5800 | -0.0800 | |||
| HLI / Houlihan Lokey, Inc. | 0.00 | 152.63 | 0.14 | 125.81 | 0.5600 | -0.0100 | |||
| ALSN / Allison Transmission Holdings, Inc. | 0.00 | 142.69 | 0.14 | 90.28 | 0.5600 | -0.1100 | |||
| RL / Ralph Lauren Corporation | 0.00 | 147.37 | 0.14 | 124.59 | 0.5500 | -0.0200 | |||
| HWKN / Hawkins, Inc. | 0.00 | 165.31 | 0.14 | 206.82 | 0.5400 | 0.1300 | |||
| AMCR / Amcor plc | 0.01 | 0.13 | 0.5400 | 0.5400 | |||||
| MUSA / Murphy USA Inc. | 0.00 | 144.95 | 0.13 | 146.30 | 0.5400 | 0.0400 | |||
| FCFS / FirstCash Holdings, Inc. | 0.00 | 148.25 | 0.13 | 209.30 | 0.5400 | 0.1400 | |||
| JLL / Jones Lang LaSalle Incorporated | 0.00 | 139.67 | 0.13 | 92.65 | 0.5300 | -0.1000 | |||
| PCAR / PACCAR Inc | 0.00 | 134.51 | 0.13 | 90.91 | 0.5100 | -0.1000 | |||
| SNPS / Synopsys, Inc. | 0.00 | 147.75 | 0.13 | 117.24 | 0.5100 | -0.0300 | |||
| DECK / Deckers Outdoor Corporation | 0.00 | 168.65 | 0.13 | 68.92 | 0.5100 | -0.1800 | |||
| CSV / Carriage Services, Inc. | 0.00 | 151.93 | 0.13 | 150.00 | 0.5000 | 0.0300 | |||
| AYI / Acuity Inc. | 0.00 | 134.26 | 0.12 | 73.24 | 0.5000 | -0.1600 | |||
| EXLS / ExlService Holdings, Inc. | 0.00 | 155.56 | 0.12 | 148.98 | 0.4900 | 0.0300 | |||
| CNC / Centene Corporation | 0.00 | 146.33 | 0.12 | 130.19 | 0.4900 | 0.0000 | |||
| SCI / Service Corporation International | 0.00 | 144.39 | 0.12 | 152.08 | 0.4900 | 0.0400 | |||
| TGLS / Tecnoglass Inc. | 0.00 | 159.18 | 0.12 | 142.00 | 0.4900 | 0.0300 | |||
| PKG / Packaging Corporation of America | 0.00 | 145.88 | 0.12 | 114.81 | 0.4700 | -0.0300 | |||
| FAF / First American Financial Corporation | 0.00 | 140.20 | 0.12 | 130.00 | 0.4700 | 0.0100 | |||
| BYD / Boyd Gaming Corporation | 0.00 | 147.41 | 0.12 | 125.49 | 0.4700 | -0.0100 | |||
| ARCC / Ares Capital Corporation | 0.01 | 143.91 | 0.11 | 111.11 | 0.4600 | -0.0400 | |||
| AFG / American Financial Group, Inc. | 0.00 | 156.10 | 0.11 | 141.30 | 0.4500 | 0.0200 | |||
| PMTS / CPI Card Group Inc. | 0.00 | 171.26 | 0.11 | 146.67 | 0.4500 | 0.0400 | |||
| SXT / Sensient Technologies Corporation | 0.00 | 160.67 | 0.11 | 227.27 | 0.4400 | 0.1300 | |||
| CRVL / CorVel Corporation | 0.00 | 163.16 | 0.11 | 145.45 | 0.4400 | 0.0400 | |||
| FIX / Comfort Systems USA, Inc. | 0.00 | 126.09 | 0.10 | 106.00 | 0.4200 | -0.0400 | |||
| CPK / Chesapeake Utilities Corporation | 0.00 | 125.72 | 0.10 | 142.86 | 0.4100 | 0.0200 | |||
| RS / Reliance, Inc. | 0.00 | 145.83 | 0.10 | 148.78 | 0.4100 | 0.0300 | |||
| AIT / Applied Industrial Technologies, Inc. | 0.00 | 147.34 | 0.10 | 134.88 | 0.4100 | 0.0100 | |||
| LMAT / LeMaitre Vascular, Inc. | 0.00 | 166.11 | 0.10 | 152.50 | 0.4100 | 0.0400 | |||
| AAMI / Acadian Asset Management Inc. | 0.00 | 171.19 | 0.10 | 196.97 | 0.4000 | 0.0900 | |||
| REGN / Regeneron Pharmaceuticals, Inc. | 0.00 | 144.78 | 0.10 | 117.78 | 0.4000 | -0.0100 | |||
| AZZ / AZZ Inc. | 0.00 | 167.86 | 0.10 | 169.44 | 0.3900 | 0.0600 | |||
| DXCM / DexCom, Inc. | 0.00 | 141.31 | 0.10 | 102.08 | 0.3900 | -0.0600 | |||
| CRAI / CRA International, Inc. | 0.00 | 153.85 | 0.10 | 128.57 | 0.3900 | 0.0000 | |||
| R / Ryder System, Inc. | 0.00 | 156.25 | 0.10 | 120.93 | 0.3900 | -0.0100 | |||
| TGNA / TEGNA Inc. | 0.01 | 158.20 | 0.09 | 130.00 | 0.3700 | 0.0000 | |||
| ALV / Autoliv, Inc. | 0.00 | 146.23 | 0.09 | 139.47 | 0.3700 | 0.0200 | |||
| GPN / Global Payments Inc. | 0.00 | 132.81 | 0.09 | 57.89 | 0.3600 | -0.1700 | |||
| LULU / lululemon athletica inc. | 0.00 | 136.17 | 0.09 | 55.17 | 0.3600 | -0.1800 | |||
| CXT / Crane NXT, Co. | 0.00 | 140.81 | 0.09 | 78.00 | 0.3600 | -0.1000 | |||
| TKR / The Timken Company | 0.00 | 151.80 | 0.09 | 102.38 | 0.3400 | -0.0500 | |||
| LKQ / LKQ Corporation | 0.00 | 159.12 | 0.08 | 167.74 | 0.3400 | 0.0500 | |||
| HCKT / The Hackett Group, Inc. | 0.00 | 166.36 | 0.08 | 121.62 | 0.3300 | -0.0100 | |||
| WTS / Watts Water Technologies, Inc. | 0.00 | 145.91 | 0.08 | 153.13 | 0.3300 | 0.0300 | |||
| KNX / Knight-Swift Transportation Holdings Inc. | 0.00 | 135.04 | 0.08 | 61.22 | 0.3200 | -0.1300 | |||
| MATX / Matson, Inc. | 0.00 | 158.63 | 0.08 | 100.00 | 0.3200 | -0.0400 | |||
| KAI / Kadant Inc. | 0.00 | 135.51 | 0.07 | 89.74 | 0.3000 | -0.0700 | |||
| IIIN / Insteel Industries, Inc. | 0.00 | 154.50 | 0.07 | 200.00 | 0.2900 | 0.0700 | |||
| TNET / TriNet Group, Inc. | 0.00 | 145.98 | 0.07 | 109.09 | 0.2800 | -0.0300 | |||
| OTTR / Otter Tail Corporation | 0.00 | 159.52 | 0.07 | 172.00 | 0.2700 | 0.0400 | |||
| ETD / Ethan Allen Interiors Inc. | 0.00 | 168.43 | 0.07 | 148.15 | 0.2700 | 0.0200 | |||
| MAN / ManpowerGroup Inc. | 0.00 | 147.69 | 0.07 | 78.38 | 0.2700 | -0.0800 | |||
| GSAXX / Goldman Sachs Trust - Goldman Sachs Financial Square Government Fund | 0.07 | 5.29 | 0.07 | 4.76 | 0.2700 | -0.3100 | |||
| AVNT / Avient Corporation | 0.00 | 163.97 | 0.06 | 106.45 | 0.2600 | -0.0300 | |||
| IMKTA / Ingles Markets, Incorporated | 0.00 | 157.64 | 0.06 | 142.31 | 0.2600 | 0.0200 | |||
| TRNS / Transcat, Inc. | 0.00 | 169.90 | 0.06 | 177.27 | 0.2500 | 0.0500 | |||
| TNK / Teekay Tankers Ltd. | 0.00 | 151.42 | 0.06 | 160.87 | 0.2400 | 0.0200 | |||
| REZI / Resideo Technologies, Inc. | 0.00 | 160.07 | 0.06 | 96.67 | 0.2400 | -0.0400 | |||
| ASTH / Astrana Health, Inc. | 0.00 | 170.74 | 0.06 | 129.17 | 0.2300 | 0.0100 | |||
| AIN / Albany International Corp. | 0.00 | 153.05 | 0.05 | 107.69 | 0.2200 | -0.0200 | |||
| SEM / Select Medical Holdings Corporation | 0.00 | 159.10 | 0.05 | 140.91 | 0.2200 | 0.0200 | |||
| GNK / Genco Shipping & Trading Limited | 0.00 | 150.78 | 0.05 | 127.27 | 0.2000 | -0.0100 | |||
| KE / Kimball Electronics, Inc. | 0.00 | 157.86 | 0.05 | 108.33 | 0.2000 | -0.0300 | |||
| GTN / Gray Media, Inc. | 0.01 | 173.92 | 0.05 | 142.11 | 0.1900 | 0.0100 | |||
| NSSC / Napco Security Technologies, Inc. | 0.00 | 202.86 | 0.05 | 87.50 | 0.1900 | -0.0300 | |||
| ROG / Rogers Corporation | 0.00 | 164.68 | 0.04 | 76.00 | 0.1800 | -0.0500 | |||
| EYE / National Vision Holdings, Inc. | 0.00 | 155.38 | 0.04 | 173.33 | 0.1700 | 0.0300 | |||
| AMCX / AMC Networks Inc. | 0.01 | 169.17 | 0.04 | 77.27 | 0.1600 | -0.0400 | |||
| ICHR / Ichor Holdings, Ltd. | 0.00 | 172.43 | 0.04 | 100.00 | 0.1500 | -0.0200 | |||
| THRM / Gentherm Incorporated | 0.00 | 163.34 | 0.04 | 84.21 | 0.1400 | -0.0400 | |||
| ATKR / Atkore Inc. | 0.00 | 136.15 | 0.03 | 88.24 | 0.1300 | -0.0300 | |||
| ARCB / ArcBest Corporation | 0.00 | 149.32 | 0.03 | 55.00 | 0.1300 | -0.0600 | |||
| OMI / Owens & Minor, Inc. | 0.00 | 221.12 | 0.03 | 64.71 | 0.1100 | -0.0500 | |||
| SSTK / Shutterstock, Inc. | 0.00 | 158.45 | 0.03 | 38.89 | 0.1000 | -0.0700 | |||
| SUM / Summit Materials, Inc. | 0.00 | -100.00 | 0.00 | -100.00 | -0.3500 | ||||
| SUM / Summit Materials, Inc. | 0.00 | -100.00 | 0.00 | -100.00 | -0.3500 |