Mga Batayang Estadistika
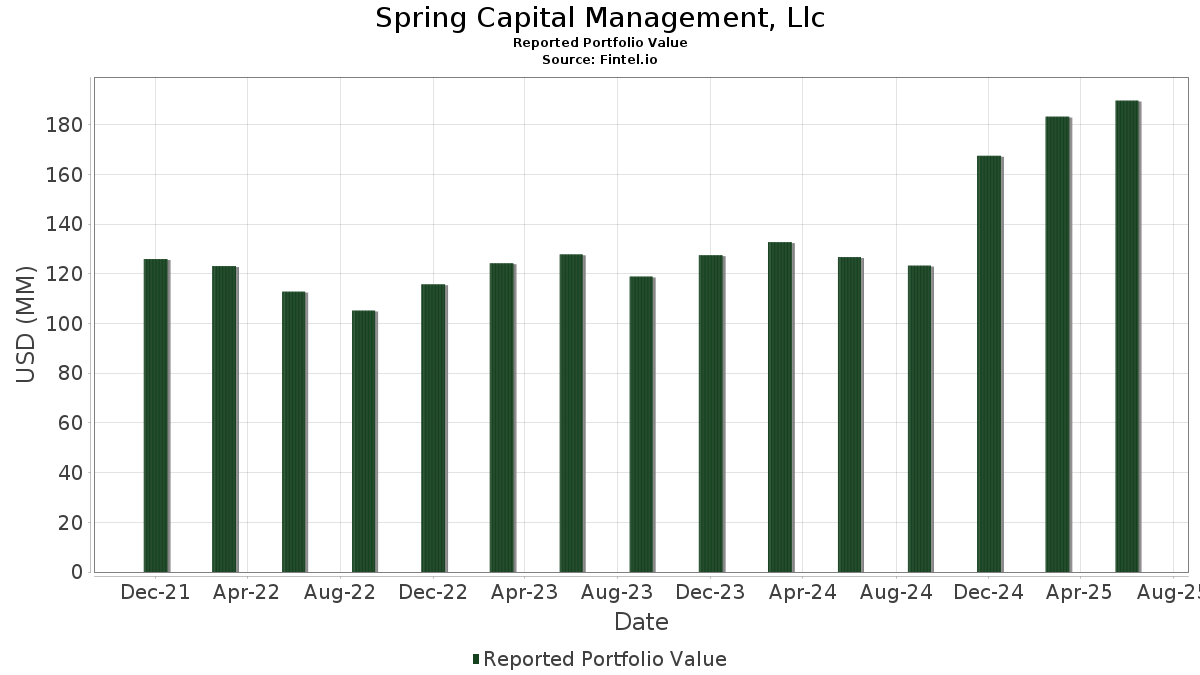
| Nilai Portofolio | $ 189,697,070 |
| Posisi Saat Ini | 51 |
Kepemilikan Terbaru, Kinerja, AUM (dari 13F, 13D)
Spring Capital Management, Llc telah mengungkapkan total kepemilikan 51 dalam pengajuan SEC terbaru mereka. Nilai portofolio terbaru dihitung sebesar $ 189,697,070 USD. Aset yang Dikelola (AUM) sebenarnya adalah nilai ini ditambah kas (yang tidak diungkapkan). Aset-aset utama Spring Capital Management, Llc adalah Oracle Corporation (US:ORCL) , Apple Inc. (US:AAPL) , Eaton Corporation plc (US:ETN) , Brown & Brown, Inc. (US:BRO) , and Deere & Company (US:DE) . Posisi baru Spring Capital Management, Llc meliputi: Broadcom Inc. (US:AVGO) , .
Peningkatan Tertinggi Kuartal Ini
Kami menggunakan perubahan dalam alokasi portofolio karena ini adalah metrik yang paling bermakna. Perubahan dapat disebabkan oleh perdagangan atau perubahan harga saham.
| Keamanan | Saham (MM) |
Nilai (Juta Dolar AS) |
Portfolio % | ΔPorsyento ng Portfolio |
|---|---|---|---|---|
| 0.06 | 13.81 | 7.2776 | 2.4475 | |
| 0.03 | 11.99 | 6.3222 | 1.3369 | |
| 0.02 | 3.23 | 1.7049 | 0.4941 | |
| 0.03 | 6.69 | 3.5246 | 0.4707 | |
| 0.09 | 8.56 | 4.5099 | 0.2932 | |
| 0.02 | 9.65 | 5.0869 | 0.2003 | |
| 0.00 | 1.50 | 0.7929 | 0.1734 | |
| 0.00 | 0.28 | 0.1475 | 0.1475 | |
| 0.00 | 0.23 | 0.1233 | 0.1233 | |
| 0.00 | 0.21 | 0.1114 | 0.1114 |
Penurunan Tertinggi Kuartal Ini
Kami menggunakan perubahan dalam alokasi portofolio karena ini adalah metrik yang paling bermakna. Perubahan dapat disebabkan oleh perdagangan atau perubahan harga saham.
| Keamanan | Saham (MM) |
Nilai (Juta Dolar AS) |
Portfolio % | ΔPorsyento ng Portfolio |
|---|---|---|---|---|
| 0.10 | 10.62 | 5.5959 | -0.9393 | |
| 0.07 | 13.39 | 7.0608 | -0.7531 | |
| 0.00 | 3.99 | 2.1050 | -0.6282 | |
| 0.04 | 5.16 | 2.7211 | -0.5073 | |
| 0.04 | 6.86 | 3.6148 | -0.4634 | |
| 0.03 | 3.70 | 1.9513 | -0.3279 | |
| 0.02 | 5.47 | 2.8829 | -0.3190 | |
| 0.06 | 4.61 | 2.4319 | -0.3121 | |
| 0.03 | 3.34 | 1.7596 | -0.2578 | |
| 0.09 | 3.68 | 1.9397 | -0.1795 |
Pengajuan 13F dan Dana
Formulir ini diajukan pada 2025-07-11 untuk periode pelaporan 2025-06-30. Klik ikon tautan untuk melihat riwayat transaksi selengkapnya.
Tingkatkan ke versi premium untuk membuka data premium dan ekspor ke Excel. ![]() .
.
| Keamanan | Ketik | Harga Saham Rata-rata | Saham (MM) |
ΔSaham (%) |
ΔSaham (%) |
Nilai ($MM) |
Portpolyo (%) |
ΔPortofolio (%) |
|
|---|---|---|---|---|---|---|---|---|---|
| ORCL / Oracle Corporation | 0.06 | -0.25 | 13.81 | 55.99 | 7.2776 | 2.4475 | |||
| AAPL / Apple Inc. | 0.07 | 1.28 | 13.39 | -6.45 | 7.0608 | -0.7531 | |||
| ETN / Eaton Corporation plc | 0.03 | -0.03 | 11.99 | 31.29 | 6.3222 | 1.3369 | |||
| BRO / Brown & Brown, Inc. | 0.10 | -0.54 | 10.62 | -11.36 | 5.5959 | -0.9393 | |||
| DE / Deere & Company | 0.02 | -0.53 | 9.65 | 7.76 | 5.0869 | 0.2003 | |||
| QCOM / QUALCOMM Incorporated | 0.06 | 0.02 | 9.21 | 3.70 | 4.8563 | 0.0082 | |||
| GWW / W.W. Grainger, Inc. | 0.01 | -0.12 | 8.57 | 5.18 | 4.5158 | 0.0710 | |||
| WMT / Walmart Inc. | 0.09 | -0.59 | 8.56 | 10.73 | 4.5099 | 0.2932 | |||
| V / Visa Inc. | 0.02 | -0.29 | 8.30 | 1.02 | 4.3765 | -0.1088 | |||
| JNJ / Johnson & Johnson | 0.04 | -0.38 | 6.86 | -8.24 | 3.6148 | -0.4634 | |||
| LHX / L3Harris Technologies, Inc. | 0.03 | -0.30 | 6.69 | 19.48 | 3.5246 | 0.4707 | |||
| ADP / Automatic Data Processing, Inc. | 0.02 | -0.33 | 6.50 | 0.60 | 3.4287 | -0.0994 | |||
| KR / The Kroger Co. | 0.08 | -0.52 | 5.93 | 5.42 | 3.1264 | 0.0563 | |||
| NEE / NextEra Energy, Inc. | 0.08 | 0.21 | 5.71 | -1.87 | 3.0116 | -0.1654 | |||
| MCD / McDonald's Corporation | 0.02 | -0.35 | 5.47 | -6.80 | 2.8829 | -0.3190 | |||
| APD / Air Products and Chemicals, Inc. | 0.02 | 2.34 | 5.44 | -2.12 | 2.8673 | -0.1654 | |||
| CVX / Chevron Corporation | 0.04 | 1.94 | 5.16 | -12.75 | 2.7211 | -0.5073 | |||
| MKC / McCormick & Company, Incorporated | 0.06 | -0.40 | 4.61 | -8.25 | 2.4319 | -0.3121 | |||
| TPL / Texas Pacific Land Corporation | 0.00 | 0.00 | 3.99 | -20.27 | 2.1050 | -0.6282 | |||
| PEP / PepsiCo, Inc. | 0.03 | 0.64 | 3.70 | -11.37 | 1.9513 | -0.3279 | |||
| VZ / Verizon Communications Inc. | 0.09 | -0.67 | 3.68 | -5.25 | 1.9397 | -0.1795 | |||
| MDT / Medtronic plc | 0.04 | -0.85 | 3.37 | -3.82 | 1.7784 | -0.1358 | |||
| KMB / Kimberly-Clark Corporation | 0.03 | -0.39 | 3.34 | -9.71 | 1.7596 | -0.2578 | |||
| NVDA / NVIDIA Corporation | 0.02 | 0.00 | 3.23 | 45.81 | 1.7049 | 0.4941 | |||
| SPY / SPDR S&P 500 ETF | 0.00 | 0.00 | 2.47 | 10.45 | 1.3041 | 0.0818 | |||
| MTDR / Matador Resources Company | 0.05 | 0.00 | 2.43 | -6.59 | 1.2786 | -0.1385 | |||
| XOM / Exxon Mobil Corporation | 0.02 | 0.00 | 2.01 | -9.35 | 1.0586 | -0.1505 | |||
| TIP / iShares Trust - iShares TIPS Bond ETF | 0.01 | 1.38 | 1.58 | 0.44 | 0.8345 | -0.0257 | |||
| MSFT / Microsoft Corporation | 0.00 | 0.00 | 1.50 | 32.51 | 0.7929 | 0.1734 | |||
| DIA / SPDR Dow Jones Industrial Average ETF Trust | 0.00 | 0.00 | 1.29 | 4.89 | 0.6783 | 0.0092 | |||
| BIV / Vanguard Bond Index Funds - Vanguard Intermediate-Term Bond ETF | 0.02 | 0.94 | 1.27 | 2.01 | 0.6674 | -0.0103 | |||
| SPYV / SPDR Series Trust - SPDR Portfolio S&P 500 Value ETF | 0.02 | 0.00 | 0.97 | 2.44 | 0.5102 | -0.0052 | |||
| TSCO / Tractor Supply Company | 0.02 | 0.00 | 0.95 | -4.24 | 0.5007 | -0.0405 | |||
| BAC / Bank of America Corporation | 0.02 | 0.00 | 0.85 | 13.32 | 0.4491 | 0.0391 | |||
| GOOG / Alphabet Inc. | 0.00 | 0.00 | 0.83 | 13.58 | 0.4367 | 0.0385 | |||
| OKE / ONEOK, Inc. | 0.01 | 0.00 | 0.64 | -17.78 | 0.3367 | -0.0870 | |||
| FANG / Diamondback Energy, Inc. | 0.00 | 0.00 | 0.57 | -14.14 | 0.3013 | -0.0617 | |||
| ET / Energy Transfer LP - Limited Partnership | 0.03 | 0.00 | 0.53 | -2.60 | 0.2772 | -0.0170 | |||
| TRN / Trinity Industries, Inc. | 0.02 | 0.00 | 0.49 | -3.76 | 0.2563 | -0.0193 | |||
| CAT / Caterpillar Inc. | 0.00 | 0.00 | 0.43 | 17.62 | 0.2292 | 0.0276 | |||
| HON / Honeywell International Inc. | 0.00 | 0.00 | 0.41 | 9.81 | 0.2186 | 0.0128 | |||
| AMZN / Amazon.com, Inc. | 0.00 | 0.00 | 0.39 | 15.38 | 0.2059 | 0.0210 | |||
| PLTR / Palantir Technologies Inc. | 0.00 | 0.00 | 0.34 | 61.14 | 0.1797 | 0.0645 | |||
| USAC / USA Compression Partners, LP - Limited Partnership | 0.01 | 0.00 | 0.29 | -9.91 | 0.1538 | -0.0229 | |||
| AVGO / Broadcom Inc. | 0.00 | 0.28 | 0.1475 | 0.1475 | |||||
| FDX / FedEx Corporation | 0.00 | 0.00 | 0.27 | -6.69 | 0.1397 | -0.0154 | |||
| CMC / Commercial Metals Company | 0.01 | 0.00 | 0.24 | 6.09 | 0.1289 | 0.0034 | |||
| TTD / The Trade Desk, Inc. | 0.00 | 0.23 | 0.1233 | 0.1233 | |||||
| ASO / Academy Sports and Outdoors, Inc. | 0.01 | 0.00 | 0.22 | -1.75 | 0.1181 | -0.0063 | |||
| WFC / Wells Fargo & Company | 0.00 | 0.21 | 0.1114 | 0.1114 | |||||
| PSX / Phillips 66 | 0.00 | 0.00 | 0.21 | -3.67 | 0.1111 | -0.0079 | |||
| COP / ConocoPhillips | 0.00 | -100.00 | 0.00 | 0.0000 | |||||
| X / United States Steel Corporation | 0.00 | -100.00 | 0.00 | 0.0000 |