Mga Batayang Estadistika
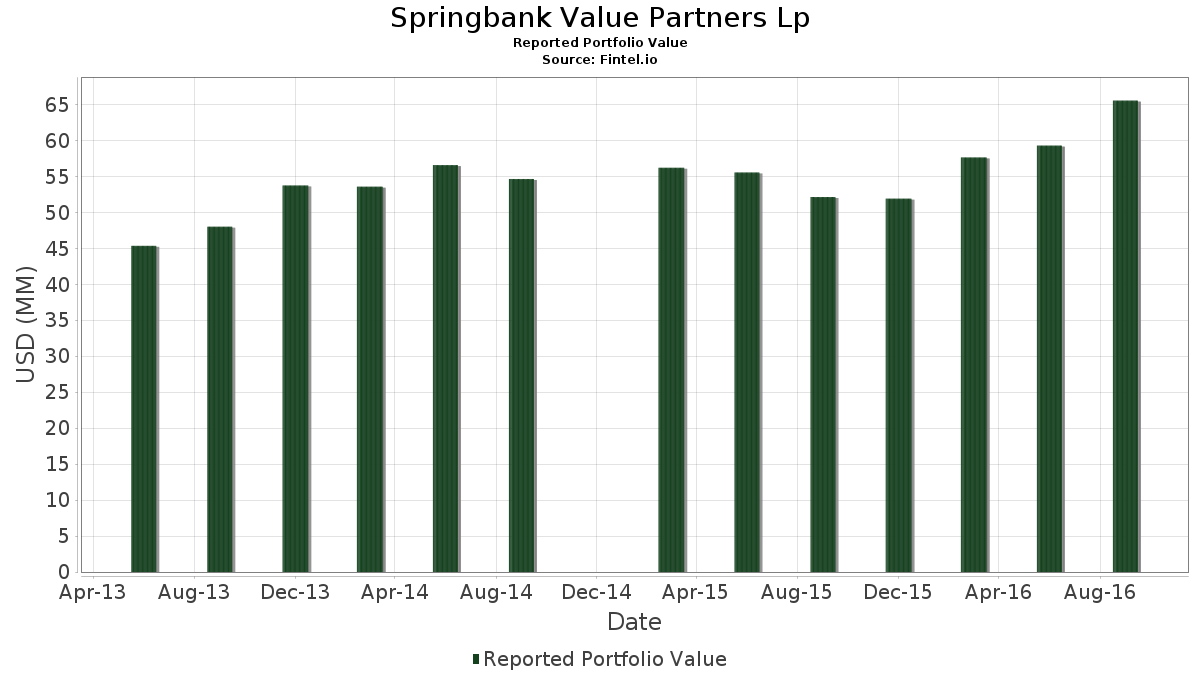
| Nilai Portofolio | $ 65,531,000 |
| Posisi Saat Ini | 38 |
Kepemilikan Terbaru, Kinerja, AUM (dari 13F, 13D)
Springbank Value Partners Lp telah mengungkapkan total kepemilikan 38 dalam pengajuan SEC terbaru mereka. Nilai portofolio terbaru dihitung sebesar $ 65,531,000 USD. Aset yang Dikelola (AUM) sebenarnya adalah nilai ini ditambah kas (yang tidak diungkapkan). Aset-aset utama Springbank Value Partners Lp adalah MKS Inc. (US:MKSI) , Global Payments Inc. (US:GPN) , Westinghouse Air Brake Technologies Corporation (US:WAB) , EMCOR Group, Inc. (US:EME) , and THOR Industries, Inc. (US:THO) . Posisi baru Springbank Value Partners Lp meliputi: SPDR Series Trust - SPDR S&P Oil & Gas Exploration & Production ETF (US:XOP) , OneSpan Inc. (US:OSPN) , .
Peningkatan Tertinggi Kuartal Ini
Kami menggunakan perubahan dalam alokasi portofolio karena ini adalah metrik yang paling bermakna. Perubahan dapat disebabkan oleh perdagangan atau perubahan harga saham.
| Keamanan | Saham (MM) |
Nilai (Juta Dolar AS) |
Portfolio % | ΔPorsyento ng Portfolio |
|---|---|---|---|---|
| 0.10 | 0.72 | 1.0972 | 1.0972 | |
| 0.05 | 4.18 | 6.3848 | 0.9895 | |
| 0.03 | 0.54 | 0.8256 | 0.8256 | |
| 0.08 | 4.54 | 6.9204 | 0.5989 | |
| 0.04 | 4.03 | 6.1498 | 0.5048 | |
| 0.02 | 0.32 | 0.4944 | 0.4944 | |
| 0.06 | 4.76 | 7.2637 | 0.4749 | |
| 0.11 | 5.69 | 8.6860 | 0.3720 | |
| 0.01 | 0.20 | 0.2976 | 0.2976 | |
| 0.01 | 0.19 | 0.2945 | 0.2945 |
Penurunan Tertinggi Kuartal Ini
Kami menggunakan perubahan dalam alokasi portofolio karena ini adalah metrik yang paling bermakna. Perubahan dapat disebabkan oleh perdagangan atau perubahan harga saham.
| Keamanan | Saham (MM) |
Nilai (Juta Dolar AS) |
Portfolio % | ΔPorsyento ng Portfolio |
|---|---|---|---|---|
| 0.09 | 4.08 | 6.2230 | -1.5274 | |
| 0.05 | 3.95 | 6.0292 | -1.0582 | |
| 0.13 | 3.81 | 5.8064 | -0.6112 | |
| 0.09 | 3.60 | 5.5012 | -0.4306 | |
| 0.07 | 5.06 | 7.7185 | -0.3373 | |
| 0.02 | 1.39 | 2.1181 | -0.3366 | |
| 0.00 | 0.00 | -0.2952 | ||
| 0.03 | 2.33 | 3.5617 | -0.2241 | |
| 0.04 | 1.68 | 2.5683 | -0.1733 | |
| 0.02 | 0.53 | 0.8118 | -0.0773 |
Pengajuan 13F dan Dana
Formulir ini diajukan pada 2016-11-10 untuk periode pelaporan 2016-09-30. Klik ikon tautan untuk melihat riwayat transaksi selengkapnya.
Tingkatkan ke versi premium untuk membuka data premium dan ekspor ke Excel. ![]() .
.
| Keamanan | Ketik | Harga Saham Rata-rata | Saham (MM) |
ΔSaham (%) |
ΔSaham (%) |
Nilai ($MM) |
Portpolyo (%) |
ΔPortofolio (%) |
|
|---|---|---|---|---|---|---|---|---|---|
| MKSI / MKS Inc. | 0.11 | 0.00 | 5.69 | 15.50 | 8.6860 | 0.3720 | |||
| GPN / Global Payments Inc. | 0.07 | -1.49 | 5.06 | 5.93 | 7.7185 | -0.3373 | |||
| WAB / Westinghouse Air Brake Technologies Corporation | 0.06 | 1.75 | 4.76 | 18.29 | 7.2637 | 0.4749 | |||
| EME / EMCOR Group, Inc. | 0.08 | 0.00 | 4.54 | 21.03 | 6.9204 | 0.5989 | |||
| THO / THOR Industries, Inc. | 0.05 | 0.00 | 4.18 | 30.83 | 6.3848 | 0.9895 | |||
| TSS / Total System Services, Inc. | 0.09 | 0.00 | 4.08 | -11.23 | 6.2230 | -1.5274 | |||
| COHR / Coherent Corp. | 0.04 | 0.00 | 4.03 | 20.44 | 6.1498 | 0.5048 | |||
| NSP / Insperity, Inc. | 0.05 | 0.00 | 3.95 | -5.95 | 6.0292 | -1.0582 | |||
| ROL / Rollins, Inc. | 0.13 | 0.00 | 3.81 | 0.03 | 5.8064 | -0.6112 | |||
| CSGS / CSG Systems International, Inc. | 0.09 | 0.00 | 3.60 | 2.53 | 5.5012 | -0.4306 | |||
| TTEK / Tetra Tech, Inc. | 0.09 | 0.00 | 3.05 | 15.38 | 4.6589 | 0.1948 | |||
| PRIM / Primoris Services Corporation | 0.13 | 0.77 | 2.70 | 9.67 | 4.1171 | -0.0331 | |||
| MSM / MSC Industrial Direct Co., Inc. | 0.03 | 0.00 | 2.33 | 4.01 | 3.5617 | -0.2241 | |||
| US2296691064 / Cubic Corporation | 0.04 | 2.43 | 1.98 | 19.41 | 3.0138 | 0.2234 | |||
| XEC / Cimarex Energy Co. | 0.01 | 0.00 | 1.95 | 12.60 | 2.9726 | 0.0540 | |||
| AIT / Applied Industrial Technologies, Inc. | 0.04 | 0.00 | 1.68 | 3.57 | 2.5683 | -0.1733 | |||
| DRQ / Dril-Quip, Inc. | 0.02 | 0.00 | 1.39 | -4.60 | 2.1181 | -0.3366 | |||
| LCII / LCI Industries | 0.01 | 0.00 | 0.78 | 15.46 | 1.1964 | 0.0509 | |||
| SRCI / SRC Energy Inc | 0.10 | 65.39 | 0.72 | 72.01 | 1.0972 | 1.0972 | |||
| GIFI / Gulf Island Fabrication, Inc. | 0.07 | 8.09 | 0.61 | 43.36 | 0.9385 | 0.2147 | |||
| RTEC / Rudolph Technologies, Inc. | 0.03 | 3.39 | 0.54 | 18.12 | 0.8256 | 0.8256 | |||
| HURC / Hurco Companies, Inc. | 0.02 | 0.00 | 0.53 | 0.95 | 0.8118 | -0.0773 | |||
| ROG / Rogers Corporation | 0.01 | 0.00 | 0.43 | 0.00 | 0.6531 | -0.0689 | |||
| ONTO / Onto Innovation Inc. | 0.02 | 12.89 | 0.39 | 21.05 | 0.5967 | 0.0517 | |||
| VECO / Veeco Instruments Inc. | 0.02 | 50.00 | 0.35 | 77.39 | 0.5387 | 0.2029 | |||
| MRCY / Mercury Systems, Inc. | 0.01 | 0.00 | 0.35 | -1.13 | 0.5356 | -0.0633 | |||
| RAIL / FreightCar America, Inc. | 0.02 | 15.38 | 0.32 | 18.25 | 0.4944 | 0.4944 | |||
| BW / Babcock & Wilcox Enterprises, Inc. | 0.02 | 36.50 | 0.31 | 53.73 | 0.4715 | 0.1324 | |||
| MTDR / Matador Resources Company | 0.01 | 14.29 | 0.20 | 40.29 | 0.2976 | 0.2976 | |||
| GHM / Graham Corporation | 0.01 | -11.46 | 0.19 | -8.10 | 0.2945 | 0.2945 | |||
| VMI / Valmont Industries, Inc. | 0.00 | 0.00 | 0.19 | -0.53 | 0.2869 | -0.0320 | |||
| MTRX / Matrix Service Company | 0.01 | 900.00 | 0.19 | 1,075.00 | 0.2869 | 0.2869 | |||
| PDFS / PDF Solutions, Inc. | 0.01 | 0.00 | 0.18 | 30.00 | 0.2777 | 0.2777 | |||
| COHU / Cohu, Inc. | 0.01 | 11.20 | 0.16 | 19.85 | 0.2487 | 0.2487 | |||
| XOP / SPDR Series Trust - SPDR S&P Oil & Gas Exploration & Production ETF | 0.00 | 0.12 | 0.1755 | 0.1755 | |||||
| PLPM / Planet Payment, Inc. | 0.03 | 511.11 | 0.10 | 410.00 | 0.1557 | 0.1557 | |||
| DGII / Digi International Inc. | 0.00 | 300.00 | 0.05 | 318.18 | 0.0702 | 0.0702 | |||
| OSPN / OneSpan Inc. | 0.00 | 0.04 | 0.0534 | 0.0534 | |||||
| ZBRA / Zebra Technologies Corporation | 0.00 | -100.00 | 0.00 | -100.00 | -0.2952 |