Mga Batayang Estadistika
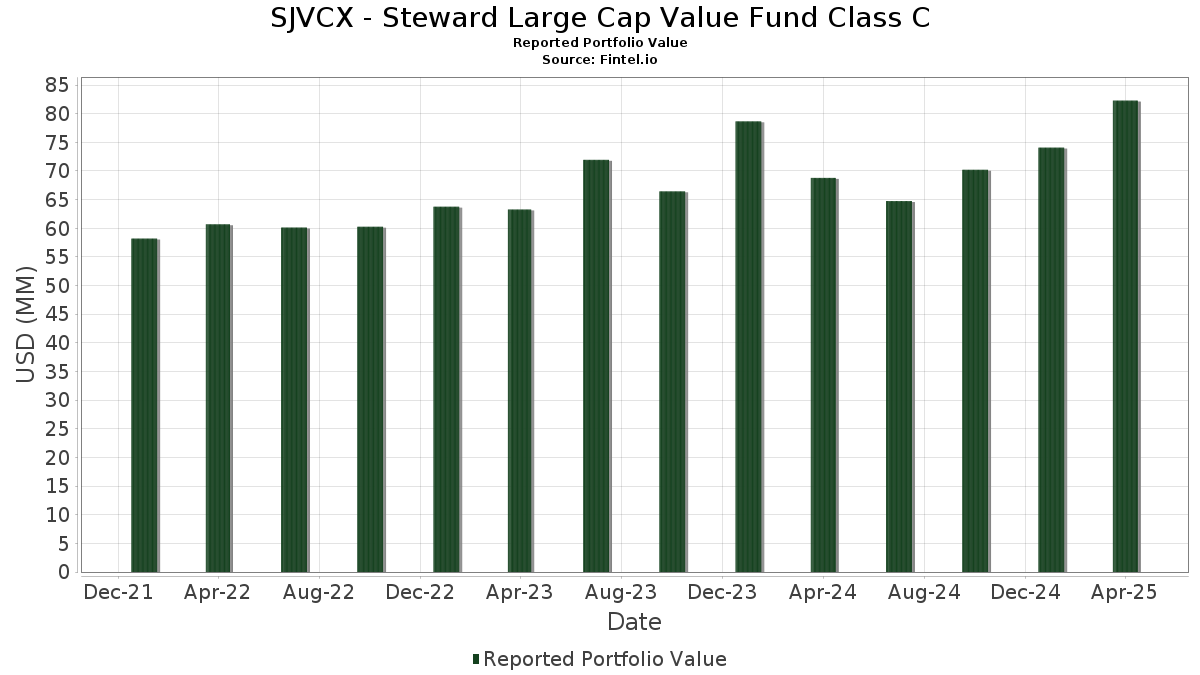
| Nilai Portofolio | $ 82,291,298 |
| Posisi Saat Ini | 98 |
Kepemilikan Terbaru, Kinerja, AUM (dari 13F, 13D)
SJVCX - Steward Large Cap Value Fund Class C telah mengungkapkan total kepemilikan 98 dalam pengajuan SEC terbaru mereka. Nilai portofolio terbaru dihitung sebesar $ 82,291,298 USD. Aset yang Dikelola (AUM) sebenarnya adalah nilai ini ditambah kas (yang tidak diungkapkan). Aset-aset utama SJVCX - Steward Large Cap Value Fund Class C adalah Berkshire Hathaway Inc. (US:BRK.B) , International Business Machines Corporation (US:IBM) , Cisco Systems, Inc. (US:CSCO) , JPMorgan Chase & Co. (US:JPM) , and Wells Fargo & Company (US:WFC) . Posisi baru SJVCX - Steward Large Cap Value Fund Class C meliputi: Sensata Technologies Holding plc (US:ST) , Aptiv PLC (US:APTV) , F5, Inc. (US:FFIV) , Axalta Coating Systems Ltd. (DE:9AX) , and Avnet, Inc. (US:AVT) .
Peningkatan Tertinggi Kuartal Ini
Kami menggunakan perubahan dalam alokasi portofolio karena ini adalah metrik yang paling bermakna. Perubahan dapat disebabkan oleh perdagangan atau perubahan harga saham.
| Keamanan | Saham (MM) |
Nilai (Juta Dolar AS) |
Portfolio % | ΔPorsyento ng Portfolio |
|---|---|---|---|---|
| 0.02 | 1.51 | 1.8365 | 1.4537 | |
| 0.04 | 0.88 | 1.0705 | 1.0705 | |
| 0.02 | 0.87 | 1.0600 | 1.0600 | |
| 0.00 | 0.85 | 1.0286 | 1.0286 | |
| 0.03 | 0.84 | 1.0141 | 1.0141 | |
| 0.02 | 0.81 | 0.9870 | 0.9870 | |
| 0.03 | 0.79 | 0.9639 | 0.9639 | |
| 0.00 | 0.79 | 0.9636 | 0.9636 | |
| 0.00 | 1.09 | 1.3277 | 0.9173 | |
| 0.01 | 0.83 | 1.0080 | 0.8351 |
Penurunan Tertinggi Kuartal Ini
Kami menggunakan perubahan dalam alokasi portofolio karena ini adalah metrik yang paling bermakna. Perubahan dapat disebabkan oleh perdagangan atau perubahan harga saham.
| Keamanan | Saham (MM) |
Nilai (Juta Dolar AS) |
Portfolio % | ΔPorsyento ng Portfolio |
|---|---|---|---|---|
| 0.01 | 0.61 | 0.7439 | -1.7462 | |
| 0.00 | 0.00 | -1.1890 | ||
| 0.00 | 0.00 | -1.1869 | ||
| 0.00 | 0.02 | 0.0253 | -1.0024 | |
| 0.00 | 0.16 | 0.1910 | -0.8181 | |
| 0.00 | 0.00 | -0.8068 | ||
| 0.02 | 0.54 | 0.6532 | -0.3289 | |
| 0.04 | 0.39 | 0.4717 | -0.2900 | |
| 0.04 | 0.46 | 0.5602 | -0.2892 | |
| 0.02 | 0.46 | 0.5557 | -0.2293 |
Pengajuan 13F dan Dana
Formulir ini diajukan pada 2025-06-26 untuk periode pelaporan 2025-04-30. Klik ikon tautan untuk melihat riwayat transaksi selengkapnya.
Tingkatkan ke versi premium untuk membuka data premium dan ekspor ke Excel. ![]() .
.
| Keamanan | Ketik | Harga Saham Rata-rata | Saham (MM) |
ΔSaham (%) |
ΔSaham (%) |
Nilai ($MM) |
Portpolyo (%) |
ΔPortofolio (%) |
|
|---|---|---|---|---|---|---|---|---|---|
| BRK.B / Berkshire Hathaway Inc. | 0.00 | 27.03 | 2.51 | 44.52 | 3.0431 | 0.7032 | |||
| IBM / International Business Machines Corporation | 0.01 | 11.67 | 1.62 | 5.61 | 1.9672 | -0.1030 | |||
| CSCO / Cisco Systems, Inc. | 0.03 | 15.70 | 1.62 | 10.23 | 1.9627 | -0.0162 | |||
| JPM / JPMorgan Chase & Co. | 0.01 | 14.81 | 1.52 | 5.06 | 1.8415 | -0.1062 | |||
| WFC / Wells Fargo & Company | 0.02 | 491.67 | 1.51 | 434.28 | 1.8365 | 1.4537 | |||
| VZ / Verizon Communications Inc. | 0.03 | 9.03 | 1.49 | 21.95 | 1.8082 | 0.1605 | |||
| SPGI / S&P Global Inc. | 0.00 | 16.67 | 1.40 | 11.91 | 1.7000 | 0.0114 | |||
| T / AT&T Inc. | 0.05 | -10.47 | 1.33 | 4.49 | 1.6110 | -0.1021 | |||
| C / Citigroup Inc. | 0.02 | 27.70 | 1.29 | 7.22 | 1.5692 | -0.0570 | |||
| GILD / Gilead Sciences, Inc. | 0.01 | 4.31 | 1.29 | 14.37 | 1.5652 | 0.0438 | |||
| GS / The Goldman Sachs Group, Inc. | 0.00 | 21.05 | 1.26 | 3.54 | 1.5291 | -0.1128 | |||
| CMCSA / Comcast Corporation | 0.04 | 19.87 | 1.26 | 21.78 | 1.5281 | 0.1337 | |||
| CAT / Caterpillar Inc. | 0.00 | 29.03 | 1.24 | 7.47 | 1.5020 | -0.0517 | |||
| LOW / Lowe's Companies, Inc. | 0.01 | 20.00 | 1.21 | 3.16 | 1.4658 | -0.1132 | |||
| MDT / Medtronic plc | 0.01 | 122.95 | 1.15 | 107.94 | 1.3996 | 0.6521 | |||
| AXP / American Express Company | 0.00 | 22.86 | 1.15 | 3.06 | 1.3909 | -0.1083 | |||
| CI / The Cigna Group | 0.00 | 0.00 | 1.12 | 15.67 | 1.3625 | 0.0524 | |||
| EQIX / Equinix, Inc. | 0.00 | 18.18 | 1.12 | 11.24 | 1.3586 | 0.0025 | |||
| BAC / Bank of America Corporation | 0.03 | 84.67 | 1.10 | 59.08 | 1.3413 | 0.4041 | |||
| CVS / CVS Health Corporation | 0.02 | 132.39 | 1.10 | 108.33 | 1.3365 | 0.6641 | |||
| COF / Capital One Financial Corporation | 0.01 | 29.79 | 1.10 | 14.84 | 1.3351 | 0.0432 | |||
| ELV / Elevance Health, Inc. | 0.00 | 420.00 | 1.09 | 310.90 | 1.3277 | 0.9173 | |||
| MMC / Marsh & McLennan Companies, Inc. | 0.00 | 4.35 | 1.08 | 8.53 | 1.3141 | -0.0321 | |||
| PYPL / PayPal Holdings, Inc. | 0.02 | 41.74 | 1.07 | 5.40 | 1.3031 | -0.0715 | |||
| PNC / The PNC Financial Services Group, Inc. | 0.01 | 32.65 | 1.04 | 6.10 | 1.2682 | -0.0605 | |||
| USB / U.S. Bancorp | 0.03 | 29.80 | 1.04 | 9.51 | 1.2588 | -0.0178 | |||
| BKNG / Booking Holdings Inc. | 0.00 | 0.00 | 1.02 | 7.60 | 1.2383 | -0.0403 | |||
| UNP / Union Pacific Corporation | 0.00 | 291.67 | 1.01 | 256.69 | 1.2307 | 0.8173 | |||
| CRM / Salesforce, Inc. | 0.00 | 37.04 | 0.99 | 7.81 | 1.2072 | -0.0377 | |||
| MET / MetLife, Inc. | 0.01 | 19.63 | 0.96 | 4.22 | 1.1714 | -0.0777 | |||
| PGR / The Progressive Corporation | 0.00 | 0.00 | 0.96 | 14.34 | 1.1631 | 0.0325 | |||
| HIG / The Hartford Insurance Group, Inc. | 0.01 | 2.67 | 0.94 | 12.92 | 1.1469 | 0.0180 | |||
| CBRE / CBRE Group, Inc. | 0.01 | 16.67 | 0.94 | -1.57 | 1.1423 | -0.1467 | |||
| SYF / Synchrony Financial | 0.02 | 48.36 | 0.94 | 11.77 | 1.1417 | 0.0061 | |||
| CL / Colgate-Palmolive Company | 0.01 | 4.21 | 0.91 | 10.81 | 1.1082 | -0.0032 | |||
| JBL / Jabil Inc. | 0.01 | 34.78 | 0.91 | 60.99 | 1.1033 | 0.2554 | |||
| FTNT / Fortinet, Inc. | 0.01 | 8.75 | 0.90 | 11.77 | 1.0961 | 0.0071 | |||
| AFL / Aflac Incorporated | 0.01 | 0.00 | 0.90 | 1.23 | 1.0952 | -0.1074 | |||
| AMGN / Amgen Inc. | 0.00 | -3.12 | 0.90 | -10.35 | 1.0950 | -0.1855 | |||
| GEN / Gen Digital Inc. | 0.03 | 20.21 | 0.89 | 15.54 | 1.0837 | 0.0415 | |||
| QCOM / QUALCOMM Incorporated | 0.01 | 30.43 | 0.89 | 11.95 | 1.0815 | 0.0082 | |||
| JLL / Jones Lang LaSalle Incorporated | 0.00 | 44.44 | 0.89 | 16.12 | 1.0769 | 0.0465 | |||
| G / Genpact Limited | 0.02 | 2.33 | 0.88 | 5.62 | 1.0740 | -0.0560 | |||
| BK / The Bank of New York Mellon Corporation | 0.01 | 0.00 | 0.88 | -6.46 | 1.0740 | -0.2015 | |||
| ST / Sensata Technologies Holding plc | 0.04 | 0.88 | 1.0705 | 1.0705 | |||||
| WSM / Williams-Sonoma, Inc. | 0.01 | 50.00 | 0.88 | 9.59 | 1.0691 | -0.0148 | |||
| WCC / WESCO International, Inc. | 0.01 | 28.57 | 0.88 | 13.13 | 1.0685 | 0.0200 | |||
| BWA / BorgWarner Inc. | 0.03 | 30.93 | 0.88 | 16.49 | 1.0648 | 0.0489 | |||
| APTV / Aptiv PLC | 0.02 | 0.87 | 1.0600 | 1.0600 | |||||
| ADP / Automatic Data Processing, Inc. | 0.00 | 11.54 | 0.87 | 10.67 | 1.0585 | -0.0046 | |||
| NKE / NIKE, Inc. | 0.02 | 34.21 | 0.86 | -1.60 | 1.0477 | -0.1352 | |||
| FFIV / F5, Inc. | 0.00 | 0.85 | 1.0286 | 1.0286 | |||||
| BBY / Best Buy Co., Inc. | 0.01 | 47.67 | 0.85 | 14.63 | 1.0284 | 0.0320 | |||
| XP / XP Inc. | 0.05 | 50.43 | 0.84 | 18.31 | 1.0204 | -0.0113 | |||
| 9AX / Axalta Coating Systems Ltd. | 0.03 | 0.84 | 1.0141 | 1.0141 | |||||
| PINC / Premier, Inc. | 0.04 | 21.79 | 0.83 | 9.35 | 1.0081 | -0.0162 | |||
| BPOP / Popular, Inc. | 0.01 | 521.43 | 0.83 | 603.39 | 1.0080 | 0.8351 | |||
| AVT / Avnet, Inc. | 0.02 | 0.81 | 0.9870 | 0.9870 | |||||
| AMCR / Amcor plc | 0.09 | 27.14 | 0.81 | 5.22 | 0.9799 | -0.1129 | |||
| CAH / Cardinal Health, Inc. | 0.01 | -10.94 | 0.81 | 1.77 | 0.9778 | -0.0901 | |||
| DBX / Dropbox, Inc. | 0.03 | 107.41 | 0.80 | 84.10 | 0.9706 | 0.3850 | |||
| IRDM / Iridium Communications Inc. | 0.03 | 0.79 | 0.9639 | 0.9639 | |||||
| FI / Fiserv, Inc. | 0.00 | 0.79 | 0.9636 | 0.9636 | |||||
| XOM / Exxon Mobil Corporation | 0.01 | 17.19 | 0.79 | 15.96 | 0.9619 | 0.0393 | |||
| HOG / Harley-Davidson, Inc. | 0.03 | 88.11 | 0.78 | 56.00 | 0.9473 | 0.2718 | |||
| GIS / General Mills, Inc. | 0.01 | -3.57 | 0.77 | -9.04 | 0.9301 | -0.2061 | |||
| GAP / The Gap, Inc. | 0.03 | 6.37 | 0.73 | -3.18 | 0.8881 | -0.1317 | |||
| CROX / Crocs, Inc. | 0.01 | 17.19 | 0.72 | 10.72 | 0.8780 | -0.0034 | |||
| PVH / PVH Corp. | 0.01 | 41.10 | 0.71 | 8.56 | 0.8627 | -0.0199 | |||
| PRI / Primerica, Inc. | 0.00 | 285.71 | 0.71 | 248.28 | 0.8591 | 0.5851 | |||
| JWN / Nordstrom, Inc. | 0.03 | 0.00 | 0.70 | -0.29 | 0.8471 | -0.0967 | |||
| MAN / ManpowerGroup Inc. | 0.02 | 95.06 | 0.68 | 39.63 | 0.8263 | 0.1681 | |||
| CRUS / Cirrus Logic, Inc. | 0.01 | -9.09 | 0.67 | -13.07 | 0.8163 | -0.2273 | |||
| INCY / Incyte Corporation | 0.01 | 0.65 | 0.7836 | 0.7836 | |||||
| HRB / H&R Block, Inc. | 0.01 | 0.00 | 0.62 | 9.14 | 0.7550 | -0.0137 | |||
| WMT / Walmart Inc. | 0.01 | -66.49 | 0.61 | -66.83 | 0.7439 | -1.7462 | |||
| PG / The Procter & Gamble Company | 0.00 | 52.17 | 0.57 | 49.08 | 0.6909 | 0.1757 | |||
| IRM / Iron Mountain Incorporated | 0.01 | 0.00 | 0.56 | -11.76 | 0.6750 | -0.1747 | |||
| JHG / Janus Henderson Group plc | 0.02 | 0.00 | 0.54 | -26.00 | 0.6532 | -0.3289 | |||
| LOPE / Grand Canyon Education, Inc. | 0.00 | 0.00 | 0.52 | 1.57 | 0.6281 | -0.0592 | |||
| M / Macy's, Inc. | 0.04 | 0.00 | 0.46 | -26.71 | 0.5602 | -0.2892 | |||
| HPQ / HP Inc. | 0.02 | 0.00 | 0.46 | -21.34 | 0.5557 | -0.2293 | |||
| QEPC / Q.E.P. Co., Inc. | 0.04 | 0.43 | 0.5279 | 0.5279 | |||||
| ADT / ADT Inc. | 0.05 | 0.40 | 0.4908 | 0.4908 | |||||
| WU / The Western Union Company | 0.04 | -28.34 | 0.39 | -31.21 | 0.4717 | -0.2900 | |||
| EXC / Exelon Corporation | 0.01 | 0.00 | 0.38 | 17.19 | 0.4556 | 0.0238 | |||
| UNM / Unum Group | 0.00 | 0.00 | 0.30 | 2.08 | 0.3583 | -0.0327 | |||
| RL / Ralph Lauren Corporation | 0.00 | 0.00 | 0.29 | -9.88 | 0.3551 | -0.0829 | |||
| RHI / Robert Half Inc. | 0.01 | 0.00 | 0.28 | -31.64 | 0.3442 | -0.2153 | |||
| OVV / Ovintiv Inc. | 0.01 | 0.00 | 0.27 | -20.42 | 0.3221 | -0.1280 | |||
| DFS / Discover Financial Services | 0.00 | 50.00 | 0.16 | 36.67 | 0.1996 | 0.0368 | |||
| AMT / American Tower Corporation | 0.00 | 0.00 | 0.16 | 21.71 | 0.1916 | 0.0169 | |||
| HUM / Humana Inc. | 0.00 | -73.91 | 0.16 | -77.38 | 0.1910 | -0.8181 | |||
| NTPXX / Northern Institutional Funds - Northern Institutional Treasury Portfolio Premier Shares | 0.13 | 16.58 | 0.13 | 16.07 | 0.1588 | 0.0074 | |||
| CCK / Crown Holdings, Inc. | 0.00 | 0.00 | 0.11 | 9.38 | 0.1287 | -0.0018 | |||
| SLM / SLM Corporation | 0.00 | 0.10 | 0.1193 | 0.1193 | |||||
| YETI / YETI Holdings, Inc. | 0.00 | 0.06 | 0.0693 | 0.0693 | |||||
| WBA / Walgreens Boots Alliance, Inc. | 0.00 | -87.82 | 0.02 | -96.76 | 0.0253 | -1.0024 | |||
| LMT / Lockheed Martin Corporation | 0.00 | -100.00 | 0.00 | -100.00 | -1.1869 | ||||
| ITW / Illinois Tool Works Inc. | 0.00 | -100.00 | 0.00 | -100.00 | -1.1890 | ||||
| KR / The Kroger Co. | 0.00 | -100.00 | 0.00 | -100.00 | -0.8068 |