Mga Batayang Estadistika
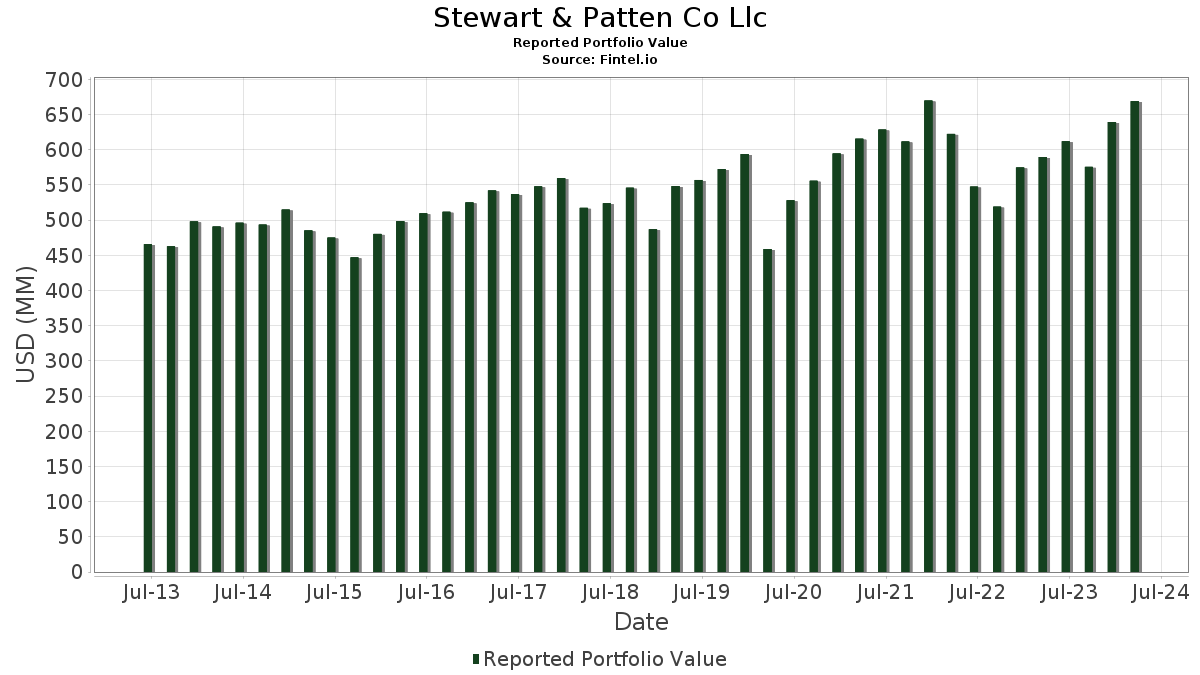
| Nilai Portofolio | $ 668,922,846 |
| Posisi Saat Ini | 94 |
Kepemilikan Terbaru, Kinerja, AUM (dari 13F, 13D)
Stewart & Patten Co Llc telah mengungkapkan total kepemilikan 94 dalam pengajuan SEC terbaru mereka. Nilai portofolio terbaru dihitung sebesar $ 668,922,846 USD. Aset yang Dikelola (AUM) sebenarnya adalah nilai ini ditambah kas (yang tidak diungkapkan). Aset-aset utama Stewart & Patten Co Llc adalah Microsoft Corporation (US:MSFT) , JPMorgan Chase & Co. (US:JPM) , Apple Inc. (US:AAPL) , The Home Depot, Inc. (US:HD) , and Stryker Corporation (US:SYK) .
Peningkatan Tertinggi Kuartal Ini
Kami menggunakan perubahan dalam alokasi portofolio karena ini adalah metrik yang paling bermakna. Perubahan dapat disebabkan oleh perdagangan atau perubahan harga saham.
| Keamanan | Saham (MM) |
Nilai (Juta Dolar AS) |
Portfolio % | ΔPorsyento ng Portfolio |
|---|---|---|---|---|
| 0.16 | 20.02 | 2.9934 | 0.6919 | |
| 0.13 | 28.89 | 4.3184 | 0.5020 | |
| 0.08 | 28.94 | 4.3256 | 0.4655 | |
| 0.10 | 25.36 | 3.7917 | 0.0515 | |
| 0.01 | 4.98 | 0.7449 | 0.0416 | |
| 0.10 | 15.65 | 2.3389 | 0.0341 | |
| 0.00 | 0.21 | 0.0315 | 0.0315 | |
| 0.00 | 0.21 | 0.0310 | 0.0310 | |
| 0.00 | 1.80 | 0.2692 | 0.0235 | |
| 0.64 | 11.22 | 1.6769 | 0.0168 |
Penurunan Tertinggi Kuartal Ini
Kami menggunakan perubahan dalam alokasi portofolio karena ini adalah metrik yang paling bermakna. Perubahan dapat disebabkan oleh perdagangan atau perubahan harga saham.
| Keamanan | Saham (MM) |
Nilai (Juta Dolar AS) |
Portfolio % | ΔPorsyento ng Portfolio |
|---|---|---|---|---|
| 0.20 | 40.37 | 3.1365 | -2.5278 | |
| 0.08 | 32.02 | 2.4883 | -2.1470 | |
| 0.18 | 28.56 | 2.2194 | -2.1424 | |
| 0.11 | 23.25 | 1.8068 | -1.8718 | |
| 0.31 | 16.91 | 1.3135 | -1.6878 | |
| 0.16 | 26.11 | 2.0289 | -1.6865 | |
| 0.02 | 24.95 | 1.9389 | -1.6438 | |
| 0.04 | 18.83 | 1.4627 | -1.6221 | |
| 0.19 | 21.65 | 1.6823 | -1.5997 | |
| 0.36 | 18.16 | 1.4113 | -1.4257 |
Pengajuan 13F dan Dana
Formulir ini diajukan pada 2024-04-18 untuk periode pelaporan 2024-03-31. Klik ikon tautan untuk melihat riwayat transaksi selengkapnya.
Tingkatkan ke versi premium untuk membuka data premium dan ekspor ke Excel. ![]() .
.
| Keamanan | Ketik | Harga Saham Rata-rata | Saham (MM) |
ΔSaham (%) |
ΔSaham (%) |
Nilai ($MM) |
Portpolyo (%) |
ΔPortofolio (%) |
|
|---|---|---|---|---|---|---|---|---|---|
| MSFT / Microsoft Corporation | 0.10 | -8.48 | 42.49 | 2.40 | 6.3519 | -0.1386 | |||
| JPM / JPMorgan Chase & Co. | 0.20 | -5.33 | 40.37 | 11.47 | 3.1365 | -2.5278 | |||
| AAPL / Apple Inc. | 0.19 | -1.44 | 32.51 | -12.21 | 4.8599 | -0.9327 | |||
| HD / The Home Depot, Inc. | 0.08 | -2.37 | 32.02 | 8.07 | 2.4883 | -2.1470 | |||
| SYK / Stryker Corporation | 0.08 | -1.89 | 28.94 | 17.25 | 4.3256 | 0.4655 | |||
| AXP / American Express Company | 0.13 | -2.58 | 28.89 | 18.39 | 4.3184 | 0.5020 | |||
| JNJ / Johnson & Johnson | 0.18 | 1.49 | 28.56 | 2.43 | 2.2194 | -2.1424 | |||
| GJR / Strats Trust For Procter & Gambel Security - Preferred Security | 0.16 | -0.71 | 26.11 | 9.94 | 2.0289 | -1.6865 | |||
| ADP / Automatic Data Processing, Inc. | 0.10 | -1.05 | 25.36 | 6.07 | 3.7917 | 0.0515 | |||
| AVGO / Broadcom Inc. | 0.02 | -8.25 | 24.95 | 8.95 | 1.9389 | -1.6438 | |||
| KO / The Coca-Cola Company | 0.39 | 0.96 | 23.66 | 4.81 | 3.5375 | 0.0059 | |||
| HON / Honeywell International Inc. | 0.11 | 1.03 | 23.25 | -1.12 | 1.8068 | -1.8718 | |||
| ABT / Abbott Laboratories | 0.19 | -0.07 | 21.65 | 3.19 | 1.6823 | -1.5997 | |||
| DIS / The Walt Disney Company | 0.16 | 0.42 | 20.02 | 36.09 | 2.9934 | 0.6919 | |||
| TXN / Texas Instruments Incorporated | 0.11 | 1.37 | 18.83 | 3.60 | 2.8157 | -0.0281 | |||
| UNH / UnitedHealth Group Incorporated | 0.04 | 1.59 | 18.83 | -4.54 | 1.4627 | -1.6221 | |||
| EMN / Eastman Chemical Company | 0.19 | 3.79 | 18.57 | 15.81 | 1.4431 | -1.0655 | |||
| ETN / Eaton Corporation plc | 0.06 | 0.10 | 18.49 | 29.96 | 1.4364 | -0.7885 | |||
| CSCO / Cisco Systems, Inc. | 0.36 | 1.37 | 18.16 | 0.14 | 1.4113 | -1.4257 | |||
| MDLZ / Mondelez International, Inc. | 0.25 | 1.49 | 17.33 | -1.92 | 1.3465 | -1.4172 | |||
| UPS / United Parcel Service, Inc. | 0.11 | 2.83 | 16.97 | -2.80 | 1.3185 | -1.4121 | |||
| XEL / Xcel Energy Inc. | 0.31 | 1.48 | 16.91 | -11.89 | 1.3135 | -1.6878 | |||
| PLD / Prologis, Inc. | 0.13 | 1.00 | 16.63 | -1.33 | 1.2924 | -1.3445 | |||
| NEE.PRN / NextEra Energy Capital Holdings, Inc. - Corporate Bond/Note | 0.26 | 6.81 | 16.40 | 12.38 | 1.2742 | -1.0082 | |||
| CVX / Chevron Corporation | 0.10 | 0.41 | 15.65 | 6.18 | 2.3389 | 0.0341 | |||
| SBUX / Starbucks Corporation | 0.14 | 15.85 | 12.48 | 10.28 | 0.9697 | -0.8005 | |||
| T / AT&T Inc. | 0.64 | 0.77 | 11.22 | 5.69 | 1.6769 | 0.0168 | |||
| COST / Costco Wholesale Corporation | 0.01 | -0.15 | 4.98 | 10.83 | 0.7449 | 0.0416 | |||
| UNP / Union Pacific Corporation | 0.01 | -6.91 | 3.66 | -6.77 | 0.2846 | -0.3300 | |||
| QEPC / Q.E.P. Co., Inc. | 0.19 | -47.50 | 2.90 | -57.16 | 0.2257 | -0.8348 | |||
| XOM / Exxon Mobil Corporation | 0.02 | -5.56 | 2.17 | 9.77 | 0.1686 | -0.1405 | |||
| BRK.B / Berkshire Hathaway Inc. | 0.00 | -4.02 | 2.01 | 13.15 | 0.1558 | -0.1214 | |||
| AMGN / Amgen Inc. | 0.01 | 0.00 | 1.84 | -1.29 | 0.1427 | -0.1483 | |||
| GWW / W.W. Grainger, Inc. | 0.00 | -6.60 | 1.80 | 14.65 | 0.2692 | 0.0235 | |||
| VTSAX / Vanguard Index Funds - Vanguard Total Stock Market Index Fund Admiral | 0.01 | 0.00 | 1.77 | 9.18 | 0.1377 | -0.1163 | |||
| GOOG / Alphabet Inc. | 0.01 | -0.90 | 1.67 | 7.06 | 0.1297 | -0.1141 | |||
| AMP / Ameriprise Financial, Inc. | 0.00 | 0.00 | 1.54 | 15.41 | 0.1193 | -0.0888 | |||
| GOOGL / Alphabet Inc. | 0.01 | -4.48 | 1.48 | 3.21 | 0.1150 | -0.1093 | |||
| INTC / Intel Corporation | 0.03 | -7.54 | 1.25 | -18.73 | 0.1862 | -0.0535 | |||
| MMM / 3M Company | 0.01 | -13.81 | 1.20 | -16.35 | 0.1797 | -0.0451 | |||
| GE / General Electric Company | 0.01 | -6.20 | 1.13 | 29.03 | 0.0878 | -0.0492 | |||
| MCD / McDonald's Corporation | 0.00 | 0.10 | 1.12 | -4.83 | 0.1679 | -0.0167 | |||
| WFC / Wells Fargo & Company | 0.02 | -1.89 | 1.05 | 15.59 | 0.1574 | 0.0149 | |||
| LLY / Eli Lilly and Company | 0.00 | -14.74 | 1.03 | 13.75 | 0.0804 | -0.0618 | |||
| CL / Colgate-Palmolive Company | 0.01 | -30.61 | 0.88 | -21.66 | 0.0684 | -0.1072 | |||
| MRK / Merck & Co., Inc. | 0.01 | -13.67 | 0.87 | 4.42 | 0.1308 | -0.0002 | |||
| AFL / Aflac Incorporated | 0.01 | -4.90 | 0.83 | -1.07 | 0.1245 | -0.0071 | |||
| American Funds Balanced Fd / COM STK (024071409) | 0.02 | 0.83 | 0.0000 | ||||||
| US9229087104 / VANGUARD 500 INDEX FUND VANGUARD 500 INDEX ADM | 0.00 | -1.18 | 0.81 | 8.85 | 0.0632 | -0.0537 | |||
| IBM / International Business Machines Corporation | 0.00 | -4.99 | 0.80 | 10.96 | 0.0622 | -0.0507 | |||
| PEP / PepsiCo, Inc. | 0.00 | 0.00 | 0.79 | 3.01 | 0.1176 | -0.0018 | |||
| MGRC / McGrath RentCorp | 0.01 | 0.00 | 0.71 | 3.20 | 0.0551 | -0.0525 | |||
| VTI / Vanguard Index Funds - Vanguard Total Stock Market ETF | 0.00 | 0.00 | 0.66 | 9.57 | 0.0516 | -0.0432 | |||
| ORCL / Oracle Corporation | 0.01 | 0.00 | 0.65 | 19.13 | 0.0979 | 0.0119 | |||
| V / Visa Inc. | 0.00 | 0.00 | 0.63 | 7.29 | 0.0947 | 0.0023 | |||
| EXPD / Expeditors International of Washington, Inc. | 0.00 | 0.00 | 0.58 | -4.43 | 0.0453 | -0.0502 | |||
| VUG / Vanguard Index Funds - Vanguard Growth ETF | 0.00 | 0.00 | 0.56 | 10.54 | 0.0433 | -0.0354 | |||
| TJX / The TJX Companies, Inc. | 0.00 | 0.00 | 0.49 | 8.13 | 0.0737 | 0.0024 | |||
| SCHX / Schwab Strategic Trust - Schwab U.S. Large-Cap ETF | 0.01 | -1.03 | 0.48 | 8.76 | 0.0377 | -0.0320 | |||
| ADI / Analog Devices, Inc. | 0.00 | 0.00 | 0.48 | -0.41 | 0.0724 | -0.0037 | |||
| AMZN / Amazon.com, Inc. | 0.00 | -1.86 | 0.48 | 16.71 | 0.0710 | 0.0072 | |||
| AGTHX / Growth Fund Of America - American Funds Growth Fund of America Class A | 0.01 | 0.00 | 0.46 | 12.44 | 0.0359 | -0.0283 | |||
| WMT / Walmart Inc. | 0.01 | 200.00 | 0.43 | 14.44 | 0.0333 | -0.0253 | |||
| NKE / NIKE, Inc. | 0.00 | 6.43 | 0.37 | -7.83 | 0.0284 | -0.0337 | |||
| SPY / SPDR S&P 500 ETF | 0.00 | 8.10 | 0.36 | 19.02 | 0.0282 | -0.0195 | |||
| DHR / Danaher Corporation | 0.00 | 3.28 | 0.35 | 11.67 | 0.0530 | 0.0033 | |||
| ACN / Accenture plc | 0.00 | 0.00 | 0.35 | -1.13 | 0.0525 | -0.0031 | |||
| DOV / Dover Corporation | 0.00 | 0.00 | 0.35 | 15.38 | 0.0268 | -0.0201 | |||
| GIS / General Mills, Inc. | 0.00 | 0.00 | 0.34 | 7.21 | 0.0266 | -0.0233 | |||
| LMT / Lockheed Martin Corporation | 0.00 | 0.00 | 0.34 | 0.59 | 0.0510 | -0.0022 | |||
| ALL / The Allstate Corporation | 0.00 | 0.00 | 0.34 | 23.53 | 0.0261 | -0.0164 | |||
| ABBV / AbbVie Inc. | 0.00 | -29.11 | 0.32 | -16.71 | 0.0485 | -0.0124 | |||
| FAST / Fastenal Company | 0.00 | 0.00 | 0.32 | 19.25 | 0.0246 | -0.0170 | |||
| VIG / Vanguard Specialized Funds - Vanguard Dividend Appreciation ETF | 0.00 | -47.79 | 0.31 | -44.09 | 0.0243 | -0.0630 | |||
| CTAS / Cintas Corporation | 0.00 | 0.00 | 0.31 | 14.02 | 0.0462 | 0.0038 | |||
| VEU / Vanguard International Equity Index Funds - Vanguard FTSE All-World ex-US ETF | 0.01 | 0.00 | 0.30 | 4.55 | 0.0232 | -0.0215 | |||
| VTV / Vanguard Index Funds - Vanguard Value ETF | 0.00 | 0.00 | 0.29 | 8.89 | 0.0229 | -0.0194 | |||
| CAT / Caterpillar Inc. | 0.00 | 0.00 | 0.28 | 24.22 | 0.0414 | 0.0064 | |||
| DE / Deere & Company | 0.00 | -23.39 | 0.27 | -21.11 | 0.0209 | -0.0326 | |||
| DRI / Darden Restaurants, Inc. | 0.00 | -6.03 | 0.26 | -4.41 | 0.0202 | -0.0224 | |||
| TMO / Thermo Fisher Scientific Inc. | 0.00 | 0.00 | 0.25 | 9.57 | 0.0378 | 0.0017 | |||
| BKNG / Booking Holdings Inc. | 0.00 | 0.00 | 0.25 | 2.46 | 0.0195 | -0.0188 | |||
| NSC / Norfolk Southern Corporation | 0.00 | 0.00 | 0.24 | 8.04 | 0.0362 | 0.0011 | |||
| CLX / The Clorox Company | 0.00 | 0.00 | 0.24 | 7.62 | 0.0359 | 0.0009 | |||
| AWK / American Water Works Company, Inc. | 0.00 | 0.00 | 0.24 | -7.39 | 0.0356 | -0.0046 | |||
| AMCR / Amcor plc | 0.02 | -10.83 | 0.24 | -11.94 | 0.0354 | -0.0067 | |||
| USB / U.S. Bancorp | 0.01 | -21.89 | 0.23 | -19.35 | 0.0337 | -0.0100 | |||
| US9229086940 / Vanguard Extended Market Index Admiral Shares | 0.00 | 0.25 | 0.21 | 5.42 | 0.0167 | -0.0151 | |||
| ITW / Illinois Tool Works Inc. | 0.00 | 0.00 | 0.21 | 2.39 | 0.0321 | -0.0007 | |||
| MFS Reaearch Fund Class A / COM STK (552981102) | 0.00 | 0.21 | 0.0000 | ||||||
| SAP / SAP SE - Depositary Receipt (Common Stock) | 0.00 | 0.21 | 0.0315 | 0.0315 | |||||
| TROW / T. Rowe Price Group, Inc. | 0.00 | 0.21 | 0.0310 | 0.0310 | |||||
| CRM / Salesforce, Inc. | 0.00 | -12.94 | 0.20 | -0.49 | 0.0303 | -0.0015 | |||
| JCI / Johnson Controls International plc | 0.00 | -12.92 | 0.20 | -1.47 | 0.0157 | -0.0163 | |||
| CWT / California Water Service Group | 0.00 | -100.00 | 0.00 | 0.0000 | |||||
| FDRR / Fidelity Covington Trust - Fidelity Dividend ETF for Rising Rates | 0.00 | -100.00 | 0.00 | -100.00 | -0.0338 | ||||
| TSLA / Tesla, Inc. | 0.00 | -100.00 | 0.00 | 0.0000 | |||||
| FMI International Institutiona / COM STK (302933700) | 0.00 | -100.00 | 0.00 | 0.0000 | |||||
| Hartford Core Equity Y / COM STK (41664R192) | 0.00 | -100.00 | 0.00 | 0.0000 |