Mga Batayang Estadistika
| Profil Orang Dalam | SUMITOMO LIFE INSURANCE CO |
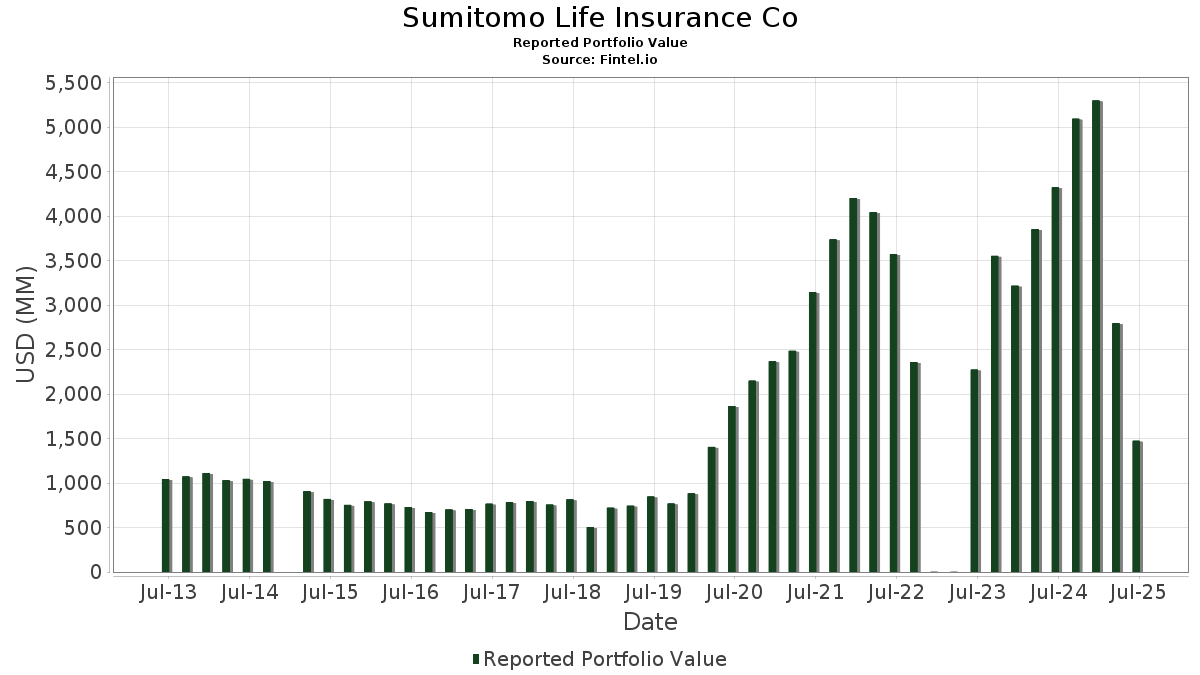
| Nilai Portofolio | $ 1,474,317,199 |
| Posisi Saat Ini | 265 |
Kepemilikan Terbaru, Kinerja, AUM (dari 13F, 13D)
Sumitomo Life Insurance Co telah mengungkapkan total kepemilikan 265 dalam pengajuan SEC terbaru mereka. Nilai portofolio terbaru dihitung sebesar $ 1,474,317,199 USD. Aset yang Dikelola (AUM) sebenarnya adalah nilai ini ditambah kas (yang tidak diungkapkan). Aset-aset utama Sumitomo Life Insurance Co adalah iShares Trust - iShares S&P 500 BuyWrite ETF (US:IVVW) , iShares Trust - iShares TIPS Bond ETF (US:TIP) , NVIDIA Corporation (US:NVDA) , Microsoft Corporation (US:MSFT) , and Apple Inc. (US:AAPL) . Posisi baru Sumitomo Life Insurance Co meliputi: iShares Trust - iShares S&P 500 BuyWrite ETF (US:IVVW) , KKR & Co. Inc. (US:KKR) , Spotify Technology S.A. (US:SPOT) , GE Vernova Inc. (US:GEV) , and Teledyne Technologies Incorporated (US:TDY) .
Peningkatan Tertinggi Kuartal Ini
Kami menggunakan perubahan dalam alokasi portofolio karena ini adalah metrik yang paling bermakna. Perubahan dapat disebabkan oleh perdagangan atau perubahan harga saham.
| Keamanan | Saham (MM) |
Nilai (Juta Dolar AS) |
Portfolio % | ΔPorsyento ng Portfolio |
|---|---|---|---|---|
| 3.03 | 139.28 | 9.4469 | 9.4469 | |
| 0.55 | 86.28 | 5.8519 | 3.7503 | |
| 0.17 | 82.95 | 5.6261 | 3.3998 | |
| 0.20 | 44.07 | 2.9894 | 1.7317 | |
| 0.14 | 37.42 | 2.5379 | 1.7048 | |
| 0.06 | 41.98 | 2.8475 | 1.6965 | |
| 0.28 | 58.28 | 3.9533 | 1.6588 | |
| 0.26 | 23.22 | 1.5749 | 1.5749 | |
| 1.02 | 112.26 | 7.6144 | 1.2243 | |
| 0.18 | 32.52 | 2.2059 | 1.2167 |
Penurunan Tertinggi Kuartal Ini
Kami menggunakan perubahan dalam alokasi portofolio karena ini adalah metrik yang paling bermakna. Perubahan dapat disebabkan oleh perdagangan atau perubahan harga saham.
| Keamanan | Saham (MM) |
Nilai (Juta Dolar AS) |
Portfolio % | ΔPorsyento ng Portfolio |
|---|---|---|---|---|
| 0.18 | 4.75 | 0.3223 | -0.7022 | |
| 0.11 | 7.20 | 0.4885 | -0.5238 | |
| 0.22 | 8.25 | 0.5595 | -0.2513 | |
| 0.00 | 1.82 | 0.1236 | -0.1359 | |
| 0.00 | 5.08 | 0.3446 | -0.1270 | |
| 0.02 | 2.53 | 0.1713 | -0.1037 | |
| 0.01 | 4.49 | 0.3044 | -0.0726 | |
| 0.00 | 0.36 | 0.0243 | -0.0523 | |
| 0.00 | 0.43 | 0.0293 | -0.0233 | |
| 0.00 | 0.33 | 0.0221 | -0.0215 |
Pengajuan 13F dan Dana
Formulir ini diajukan pada 2025-08-05 untuk periode pelaporan 2025-06-30. Klik ikon tautan untuk melihat riwayat transaksi selengkapnya.
Tingkatkan ke versi premium untuk membuka data premium dan ekspor ke Excel. ![]() .
.
| Keamanan | Ketik | Harga Saham Rata-rata | Saham (MM) |
ΔSaham (%) |
ΔSaham (%) |
Nilai ($MM) |
Portpolyo (%) |
ΔPortofolio (%) |
|
|---|---|---|---|---|---|---|---|---|---|
| IVVW / iShares Trust - iShares S&P 500 BuyWrite ETF | 3.03 | 139.28 | 9.4469 | 9.4469 | |||||
| TIP / iShares Trust - iShares TIPS Bond ETF | 1.02 | -36.55 | 112.26 | -37.14 | 7.6144 | 1.2243 | |||
| NVDA / NVIDIA Corporation | 0.55 | 0.75 | 86.28 | 46.87 | 5.8519 | 3.7503 | |||
| MSFT / Microsoft Corporation | 0.17 | 0.60 | 82.95 | 33.30 | 5.6261 | 3.3998 | |||
| AAPL / Apple Inc. | 0.28 | -1.61 | 58.28 | -9.12 | 3.9533 | 1.6588 | |||
| BKLN / Invesco Exchange-Traded Fund Trust II - Invesco Senior Loan ETF | 2.17 | -35.26 | 45.34 | -34.57 | 3.0752 | 0.5961 | |||
| AMZN / Amazon.com, Inc. | 0.20 | 8.73 | 44.07 | 25.37 | 2.9894 | 1.7317 | |||
| META / Meta Platforms, Inc. | 0.06 | 1.90 | 41.98 | 30.50 | 2.8475 | 1.6965 | |||
| AVGO / Broadcom Inc. | 0.14 | -2.39 | 37.42 | 60.70 | 2.5379 | 1.7048 | |||
| GOOGL / Alphabet Inc. | 0.18 | 3.22 | 32.52 | 17.63 | 2.2059 | 1.2167 | |||
| JPM / JPMorgan Chase & Co. | 0.10 | -2.84 | 29.65 | 14.83 | 2.0111 | 1.0873 | |||
| LLY / Eli Lilly and Company | 0.03 | 1.17 | 24.23 | -4.51 | 1.6433 | 0.7356 | |||
| VNQ / Vanguard Specialized Funds - Vanguard Real Estate ETF | 0.26 | 23.22 | 1.5749 | 1.5749 | |||||
| NOW / ServiceNow, Inc. | 0.02 | 18.76 | 18.69 | 53.37 | 1.2676 | 0.8316 | |||
| MA / Mastercard Incorporated | 0.03 | -9.39 | 17.65 | -7.11 | 1.1969 | 0.5172 | |||
| PG / The Procter & Gamble Company | 0.10 | 0.41 | 15.57 | -6.13 | 1.0564 | 0.4627 | |||
| SPGI / S&P Global Inc. | 0.03 | -1.15 | 15.14 | 2.59 | 1.0266 | 0.4987 | |||
| FEZ / SPDR Index Shares Funds - SPDR EURO STOXX 50 ETF | 0.24 | -5.03 | 14.10 | 4.26 | 0.9565 | 0.4726 | |||
| WMT / Walmart Inc. | 0.14 | 12.03 | 13.63 | 24.78 | 0.9247 | 0.5338 | |||
| ISRG / Intuitive Surgical, Inc. | 0.02 | 0.42 | 13.47 | 10.18 | 0.9136 | 0.4762 | |||
| GSCE / GS Connect S&P GSCI Enhanced Commodity Total Return ETN | 0.02 | -20.80 | 13.44 | 2.61 | 0.9114 | 0.4429 | |||
| UBER / Uber Technologies, Inc. | 0.13 | 8.47 | 12.42 | 38.90 | 0.8427 | 0.5227 | |||
| WM / Waste Management, Inc. | 0.05 | -5.25 | 11.73 | -6.36 | 0.7955 | 0.3474 | |||
| GOOGL / Alphabet Inc. | 0.07 | -5.44 | 11.61 | 7.36 | 0.7874 | 0.4006 | |||
| BSX / Boston Scientific Corporation | 0.10 | -5.87 | 11.27 | 0.22 | 0.7645 | 0.3621 | |||
| PANW / Palo Alto Networks, Inc. | 0.05 | 37.50 | 10.50 | 64.91 | 0.7119 | 0.4842 | |||
| TMO / Thermo Fisher Scientific Inc. | 0.03 | 7.69 | 10.45 | -12.24 | 0.7087 | 0.2827 | |||
| NEE / NextEra Energy, Inc. | 0.15 | -13.38 | 10.15 | -15.17 | 0.6885 | 0.2604 | |||
| ADBE / Adobe Inc. | 0.02 | 14.86 | 9.46 | 15.86 | 0.6417 | 0.3495 | |||
| SYY / Sysco Corporation | 0.12 | -0.35 | 9.25 | 0.58 | 0.6271 | 0.2982 | |||
| PAYX / Paychex, Inc. | 0.06 | 9.20 | 9.15 | 2.96 | 0.6206 | 0.3026 | |||
| V / Visa Inc. | 0.03 | -5.00 | 8.99 | -3.76 | 0.6097 | 0.2755 | |||
| MELI / MercadoLibre, Inc. | 0.00 | -12.82 | 8.89 | 16.80 | 0.6027 | 0.3305 | |||
| ZTS / Zoetis Inc. | 0.06 | 7.93 | 8.78 | 2.24 | 0.5954 | 0.2882 | |||
| CME / CME Group Inc. | 0.03 | 382.00 | 8.29 | 400.79 | 0.5622 | 0.5030 | |||
| USHY / iShares Trust - iShares Broad USD High Yield Corporate Bond ETF | 0.22 | -64.28 | 8.25 | -63.60 | 0.5595 | -0.2513 | |||
| ABNB / Airbnb, Inc. | 0.06 | -10.48 | 7.60 | -0.84 | 0.5156 | 0.2413 | |||
| KKR / KKR & Co. Inc. | 0.06 | 7.56 | 0.5125 | 0.5125 | |||||
| TSLA / Tesla, Inc. | 0.02 | -41.27 | 7.49 | -28.01 | 0.5080 | 0.1358 | |||
| VRT / Vertiv Holdings Co | 0.06 | 13.11 | 7.47 | 101.16 | 0.5064 | 0.3736 | |||
| BAC / Bank of America Corporation | 0.15 | -13.48 | 7.26 | -1.89 | 0.4921 | 0.2275 | |||
| VWOB / Vanguard Whitehall Funds - Vanguard Emerging Markets Government Bond ETF | 0.11 | -74.99 | 7.20 | -74.55 | 0.4885 | -0.5238 | |||
| VMC / Vulcan Materials Company | 0.03 | -1.07 | 6.76 | 10.60 | 0.4586 | 0.2399 | |||
| IEMG / iShares, Inc. - iShares Core MSCI Emerging Markets ETF | 0.11 | -37.26 | 6.59 | -30.21 | 0.4471 | 0.1092 | |||
| INTU / Intuit Inc. | 0.01 | -3.81 | 6.54 | 23.41 | 0.4435 | 0.2539 | |||
| BKNG / Booking Holdings Inc. | 0.00 | -3.86 | 6.50 | 20.81 | 0.4406 | 0.2482 | |||
| ORCL / Oracle Corporation | 0.03 | -4.52 | 6.28 | 49.32 | 0.4257 | 0.2753 | |||
| BX / Blackstone Inc. | 0.04 | -26.13 | 5.88 | -20.95 | 0.3987 | 0.1327 | |||
| BRK.B / Berkshire Hathaway Inc. | 0.01 | 11.19 | 5.56 | 1.42 | 0.3771 | 0.1810 | |||
| PM / Philip Morris International Inc. | 0.03 | 59.71 | 5.28 | 83.28 | 0.3583 | 0.2552 | |||
| CRWD / CrowdStrike Holdings, Inc. | 0.01 | -4.31 | 5.19 | 38.22 | 0.3518 | 0.2176 | |||
| NFLX / Netflix, Inc. | 0.00 | -73.16 | 5.08 | -61.46 | 0.3446 | -0.1270 | |||
| AXP / American Express Company | 0.02 | -16.95 | 4.96 | -1.53 | 0.3362 | 0.1561 | |||
| SCHP / Schwab Strategic Trust - Schwab U.S. TIPS ETF | 0.18 | -83.28 | 4.75 | -83.41 | 0.3223 | -0.7022 | |||
| TT / Trane Technologies plc | 0.01 | -3.29 | 4.70 | 25.55 | 0.3191 | 0.1850 | |||
| APH / Amphenol Corporation | 0.05 | -3.70 | 4.69 | 45.00 | 0.3180 | 0.2023 | |||
| COST / Costco Wholesale Corporation | 0.00 | -5.85 | 4.53 | -1.46 | 0.3071 | 0.1427 | |||
| VOO / Vanguard Index Funds - Vanguard S&P 500 ETF | 0.01 | -61.46 | 4.49 | -57.41 | 0.3044 | -0.0726 | |||
| WMB / The Williams Companies, Inc. | 0.07 | 4.09 | 4.46 | 9.39 | 0.3026 | 0.1567 | |||
| ETN / Eaton Corporation plc | 0.01 | -3.91 | 4.34 | 26.19 | 0.2945 | 0.1714 | |||
| SNPS / Synopsys, Inc. | 0.01 | -3.70 | 4.27 | 15.14 | 0.2899 | 0.1571 | |||
| FTNT / Fortinet, Inc. | 0.04 | -2.72 | 4.24 | 6.85 | 0.2879 | 0.1458 | |||
| SYK / Stryker Corporation | 0.01 | -3.98 | 4.15 | 2.04 | 0.2816 | 0.1360 | |||
| CDNS / Cadence Design Systems, Inc. | 0.01 | -20.83 | 4.10 | -4.07 | 0.2780 | 0.1251 | |||
| HD / The Home Depot, Inc. | 0.01 | -15.48 | 3.95 | -15.46 | 0.2682 | 0.1009 | |||
| XOM / Exxon Mobil Corporation | 0.04 | -5.86 | 3.91 | -14.65 | 0.2651 | 0.1012 | |||
| ECL / Ecolab Inc. | 0.01 | 7.26 | 3.86 | 14.02 | 0.2621 | 0.1408 | |||
| PWR / Quanta Services, Inc. | 0.01 | 12.84 | 3.61 | 67.88 | 0.2450 | 0.1680 | |||
| SPOT / Spotify Technology S.A. | 0.00 | 3.60 | 0.2445 | 0.2445 | |||||
| ACN / Accenture plc | 0.01 | -20.85 | 3.58 | -24.17 | 0.2428 | 0.0739 | |||
| QCOM / QUALCOMM Incorporated | 0.02 | -4.11 | 3.55 | -0.59 | 0.2405 | 0.1129 | |||
| TW / Tradeweb Markets Inc. | 0.02 | -2.73 | 3.54 | -4.07 | 0.2400 | 0.1080 | |||
| PH / Parker-Hannifin Corporation | 0.01 | -3.31 | 3.49 | 11.10 | 0.2369 | 0.1244 | |||
| ANET / Arista Networks Inc | 0.03 | -3.68 | 3.48 | 27.19 | 0.2358 | 0.1380 | |||
| CTAS / Cintas Corporation | 0.02 | -3.95 | 3.42 | 4.17 | 0.2320 | 0.1145 | |||
| FI / Fiserv, Inc. | 0.02 | -3.55 | 3.41 | -24.70 | 0.2312 | 0.0692 | |||
| ARES / Ares Management Corporation | 0.02 | -3.14 | 3.40 | 14.45 | 0.2304 | 0.1242 | |||
| IBKR / Interactive Brokers Group, Inc. | 0.06 | 289.30 | 3.28 | 30.29 | 0.2226 | 0.1325 | |||
| VRTX / Vertex Pharmaceuticals Incorporated | 0.01 | -3.99 | 3.22 | -11.85 | 0.2185 | 0.0878 | |||
| HWM / Howmet Aerospace Inc. | 0.02 | 11.87 | 3.18 | 60.51 | 0.2159 | 0.1450 | |||
| TJX / The TJX Companies, Inc. | 0.03 | 58.28 | 3.18 | 60.45 | 0.2155 | 0.1447 | |||
| WFC / Wells Fargo & Company | 0.04 | -5.86 | 3.15 | 5.07 | 0.2137 | 0.1064 | |||
| JNJ / Johnson & Johnson | 0.02 | -5.86 | 3.06 | -13.29 | 0.2075 | 0.0813 | |||
| TRMB / Trimble Inc. | 0.04 | -3.97 | 3.05 | 11.15 | 0.2069 | 0.1087 | |||
| IFRA / iShares Trust - iShares U.S. Infrastructure ETF | 0.06 | -50.69 | 3.00 | -46.19 | 0.2035 | 0.0041 | |||
| CVX / Chevron Corporation | 0.02 | -5.86 | 2.96 | -19.41 | 0.2006 | 0.0693 | |||
| DDOG / Datadog, Inc. | 0.02 | -3.84 | 2.95 | 30.18 | 0.1998 | 0.1189 | |||
| ABBV / AbbVie Inc. | 0.02 | -5.86 | 2.94 | -16.61 | 0.1996 | 0.0734 | |||
| MS / Morgan Stanley | 0.02 | -5.86 | 2.93 | 13.65 | 0.1988 | 0.1065 | |||
| MMC / Marsh & McLennan Companies, Inc. | 0.01 | -4.13 | 2.89 | -14.12 | 0.1961 | 0.0757 | |||
| PLTR / Palantir Technologies Inc. | 0.02 | 38.46 | 2.87 | 123.63 | 0.1945 | 0.1486 | |||
| EOG / EOG Resources, Inc. | 0.02 | -4.15 | 2.77 | -10.59 | 0.1878 | 0.0770 | |||
| TDG / TransDigm Group Incorporated | 0.00 | -5.88 | 2.75 | 3.46 | 0.1865 | 0.0914 | |||
| UNH / UnitedHealth Group Incorporated | 0.01 | -5.86 | 2.75 | -43.94 | 0.1863 | 0.0111 | |||
| USRT / iShares Trust - iShares Core U.S. REIT ETF | 0.05 | -35.40 | 2.71 | -36.57 | 0.1841 | 0.0310 | |||
| TKO / TKO Group Holdings, Inc. | 0.01 | 65.86 | 2.71 | 97.59 | 0.1839 | 0.1348 | |||
| CRM / Salesforce, Inc. | 0.01 | -5.85 | 2.69 | -4.33 | 0.1827 | 0.0820 | |||
| MCD / McDonald's Corporation | 0.01 | -5.86 | 2.65 | -11.95 | 0.1794 | 0.0719 | |||
| CAT / Caterpillar Inc. | 0.01 | -5.85 | 2.56 | 10.82 | 0.1738 | 0.0911 | |||
| KO / The Coca-Cola Company | 0.04 | -5.86 | 2.56 | -6.99 | 0.1734 | 0.0750 | |||
| COF / Capital One Financial Corporation | 0.01 | 187.27 | 2.54 | 241.02 | 0.1726 | 0.1459 | |||
| AMD / Advanced Micro Devices, Inc. | 0.02 | -76.21 | 2.53 | -67.14 | 0.1713 | -0.1037 | |||
| DIS / The Walt Disney Company | 0.02 | -5.86 | 2.45 | 18.25 | 0.1662 | 0.0921 | |||
| GE / General Electric Company | 0.01 | -6.36 | 2.40 | 20.39 | 0.1630 | 0.0916 | |||
| MSCI / MSCI Inc. | 0.00 | -4.27 | 2.38 | -2.38 | 0.1613 | 0.0742 | |||
| ADP / Automatic Data Processing, Inc. | 0.01 | -5.85 | 2.37 | -4.97 | 0.1608 | 0.0716 | |||
| WELL / Welltower Inc. | 0.02 | -5.86 | 2.33 | -5.52 | 0.1578 | 0.0697 | |||
| CSCO / Cisco Systems, Inc. | 0.03 | -5.86 | 2.31 | 5.86 | 0.1569 | 0.0787 | |||
| ADI / Analog Devices, Inc. | 0.01 | -5.85 | 2.27 | 11.09 | 0.1542 | 0.0810 | |||
| C / Citigroup Inc. | 0.03 | -5.86 | 2.26 | 12.89 | 0.1533 | 0.0817 | |||
| WDAY / Workday, Inc. | 0.01 | -3.92 | 2.23 | -1.24 | 0.1511 | 0.0704 | |||
| CL / Colgate-Palmolive Company | 0.02 | 75.69 | 2.20 | 70.51 | 0.1495 | 0.1032 | |||
| DE / Deere & Company | 0.00 | -5.84 | 2.13 | 2.06 | 0.1447 | 0.0699 | |||
| RY / Royal Bank of Canada | 0.02 | -5.85 | 2.04 | 9.87 | 0.1382 | 0.0718 | |||
| SHW / The Sherwin-Williams Company | 0.01 | -5.86 | 1.92 | -7.42 | 0.1303 | 0.0561 | |||
| MRK / Merck & Co., Inc. | 0.02 | -5.86 | 1.92 | -16.97 | 0.1301 | 0.0475 | |||
| PEP / PepsiCo, Inc. | 0.01 | -29.09 | 1.89 | -37.55 | 0.1285 | 0.0199 | |||
| AME / AMETEK, Inc. | 0.01 | -5.86 | 1.89 | -1.05 | 0.1284 | 0.0600 | |||
| GEV / GE Vernova Inc. | 0.00 | 1.87 | 0.1266 | 0.1266 | |||||
| LIN / Linde plc | 0.00 | -6.34 | 1.85 | -5.62 | 0.1254 | 0.0553 | |||
| CSL / Carlisle Companies Incorporated | 0.00 | -77.08 | 1.82 | -74.88 | 0.1236 | -0.1359 | |||
| IR / Ingersoll Rand Inc. | 0.02 | -5.86 | 1.81 | -2.16 | 0.1229 | 0.0566 | |||
| IDXX / IDEXX Laboratories, Inc. | 0.00 | -2.47 | 1.80 | 24.52 | 0.1220 | 0.0703 | |||
| BLK / BlackRock, Inc. | 0.00 | -6.31 | 1.79 | 3.88 | 0.1216 | 0.0598 | |||
| GILD / Gilead Sciences, Inc. | 0.02 | -5.86 | 1.79 | -6.86 | 0.1215 | 0.0527 | |||
| TMUS / T-Mobile US, Inc. | 0.01 | -6.35 | 1.78 | -16.34 | 0.1206 | 0.0446 | |||
| UNP / Union Pacific Corporation | 0.01 | -6.34 | 1.73 | -8.78 | 0.1170 | 0.0494 | |||
| HEI / HEICO Corporation | 0.01 | 97.41 | 1.65 | 142.50 | 0.1119 | 0.0875 | |||
| ABT / Abbott Laboratories | 0.01 | -5.87 | 1.64 | -3.54 | 0.1111 | 0.0504 | |||
| CB / Chubb Limited | 0.01 | -6.37 | 1.62 | -10.16 | 0.1098 | 0.0453 | |||
| KEYS / Keysight Technologies, Inc. | 0.01 | -6.36 | 1.59 | 2.45 | 0.1079 | 0.0523 | |||
| TXN / Texas Instruments Incorporated | 0.01 | -36.78 | 1.56 | -26.98 | 0.1060 | 0.0295 | |||
| VZ / Verizon Communications Inc. | 0.04 | -6.35 | 1.55 | -10.71 | 0.1052 | 0.0431 | |||
| SO / The Southern Company | 0.02 | -6.35 | 1.55 | -6.48 | 0.1048 | 0.0457 | |||
| MDLZ / Mondelez International, Inc. | 0.02 | -6.35 | 1.53 | -6.95 | 0.1036 | 0.0449 | |||
| IBM / International Business Machines Corporation | 0.01 | -5.48 | 1.51 | 12.07 | 0.1028 | 0.0544 | |||
| TD / The Toronto-Dominion Bank | 0.02 | -5.49 | 1.51 | 15.86 | 0.1026 | 0.0559 | |||
| VEEV / Veeva Systems Inc. | 0.01 | 69.73 | 1.51 | 111.05 | 0.1024 | 0.0768 | |||
| AMGN / Amgen Inc. | 0.01 | -6.35 | 1.50 | -16.09 | 0.1019 | 0.0379 | |||
| TRV / The Travelers Companies, Inc. | 0.01 | -5.87 | 1.43 | -4.78 | 0.0972 | 0.0434 | |||
| BK / The Bank of New York Mellon Corporation | 0.02 | 1.43 | 0.0970 | 0.0970 | |||||
| T / AT&T Inc. | 0.05 | -5.49 | 1.43 | -3.32 | 0.0970 | 0.0441 | |||
| KLAC / KLA Corporation | 0.00 | -5.45 | 1.43 | 24.61 | 0.0969 | 0.0559 | |||
| CEG / Constellation Energy Corporation | 0.00 | -5.48 | 1.41 | 51.45 | 0.0958 | 0.0624 | |||
| VLTO / Veralto Corporation | 0.01 | -4.34 | 1.41 | -0.91 | 0.0956 | 0.0447 | |||
| LOW / Lowe's Companies, Inc. | 0.01 | -6.36 | 1.39 | -10.93 | 0.0946 | 0.0386 | |||
| MIR / Mirion Technologies, Inc. | 0.06 | 184.42 | 1.39 | 323.17 | 0.0942 | 0.0824 | |||
| COR / Cencora, Inc. | 0.00 | -5.50 | 1.37 | 1.85 | 0.0932 | 0.0450 | |||
| SHOP / Shopify Inc. | 0.01 | -5.49 | 1.37 | 14.21 | 0.0932 | 0.0502 | |||
| DHR / Danaher Corporation | 0.01 | -6.36 | 1.37 | -9.79 | 0.0932 | 0.0387 | |||
| LPLA / LPL Financial Holdings Inc. | 0.00 | -5.50 | 1.35 | 8.33 | 0.0917 | 0.0470 | |||
| CSX / CSX Corporation | 0.04 | -5.49 | 1.34 | 4.77 | 0.0909 | 0.0452 | |||
| SU / Suncor Energy Inc. | 0.03 | -4.87 | 1.28 | -7.97 | 0.0870 | 0.0371 | |||
| GRMN / Garmin Ltd. | 0.01 | -5.51 | 1.27 | -9.18 | 0.0859 | 0.0360 | |||
| SCHW / The Charles Schwab Corporation | 0.01 | -5.49 | 1.21 | 10.16 | 0.0824 | 0.0429 | |||
| COP / ConocoPhillips | 0.01 | -5.49 | 1.21 | -19.21 | 0.0821 | 0.0285 | |||
| MU / Micron Technology, Inc. | 0.01 | -6.72 | 1.20 | 32.34 | 0.0816 | 0.0491 | |||
| ALL / The Allstate Corporation | 0.01 | -5.47 | 1.20 | -8.05 | 0.0814 | 0.0347 | |||
| ANSS / ANSYS, Inc. | 0.00 | -45.35 | 1.20 | -39.40 | 0.0811 | 0.0106 | |||
| EQIX / Equinix, Inc. | 0.00 | -5.49 | 1.19 | -7.82 | 0.0808 | 0.0346 | |||
| PFE / Pfizer Inc. | 0.05 | -5.49 | 1.18 | -9.66 | 0.0800 | 0.0333 | |||
| PGR / The Progressive Corporation | 0.00 | -5.51 | 1.18 | -10.91 | 0.0798 | 0.0326 | |||
| TDY / Teledyne Technologies Incorporated | 0.00 | 1.17 | 0.0791 | 0.0791 | |||||
| CSGP / CoStar Group, Inc. | 0.01 | -39.54 | 1.16 | -38.68 | 0.0787 | 0.0110 | |||
| AWK / American Water Works Company, Inc. | 0.01 | 78.09 | 1.16 | 67.97 | 0.0786 | 0.0539 | |||
| CI / The Cigna Group | 0.00 | -6.70 | 1.13 | -6.29 | 0.0768 | 0.0336 | |||
| MO / Altria Group, Inc. | 0.02 | -6.72 | 1.12 | -8.90 | 0.0757 | 0.0319 | |||
| MSI / Motorola Solutions, Inc. | 0.00 | -5.96 | 1.12 | -9.64 | 0.0756 | 0.0315 | |||
| CVS / CVS Health Corporation | 0.02 | -6.73 | 1.10 | -5.00 | 0.0747 | 0.0332 | |||
| CCK / Crown Holdings, Inc. | 0.01 | -6.73 | 1.09 | 7.60 | 0.0740 | 0.0377 | |||
| CNI / Canadian National Railway Company | 0.01 | -5.49 | 1.09 | 0.93 | 0.0736 | 0.0351 | |||
| AMAT / Applied Materials, Inc. | 0.01 | -6.72 | 1.08 | 17.67 | 0.0732 | 0.0404 | |||
| DLR / Digital Realty Trust, Inc. | 0.01 | -6.71 | 1.07 | 13.45 | 0.0727 | 0.0389 | |||
| ROL / Rollins, Inc. | 0.02 | 1.06 | 0.0717 | 0.0717 | |||||
| DOV / Dover Corporation | 0.01 | -5.52 | 1.04 | -1.43 | 0.0702 | 0.0326 | |||
| DUK / Duke Energy Corporation | 0.01 | -6.73 | 1.01 | -9.79 | 0.0688 | 0.0286 | |||
| DUOL / Duolingo, Inc. | 0.00 | -5.98 | 1.01 | 24.07 | 0.0682 | 0.0392 | |||
| PSA / Public Storage | 0.00 | -6.72 | 0.99 | -8.54 | 0.0668 | 0.0283 | |||
| GM / General Motors Company | 0.02 | -6.11 | 0.98 | -1.80 | 0.0665 | 0.0308 | |||
| ORLY / O'Reilly Automotive, Inc. | 0.01 | 1,299.36 | 0.98 | -11.97 | 0.0664 | 0.0266 | |||
| RYAN / Ryan Specialty Holdings, Inc. | 0.01 | -2.17 | 0.95 | -9.95 | 0.0645 | 0.0267 | |||
| WSO / Watsco, Inc. | 0.00 | 54.32 | 0.92 | 34.21 | 0.0625 | 0.0379 | |||
| LECO / Lincoln Electric Holdings, Inc. | 0.00 | -5.50 | 0.92 | 3.51 | 0.0621 | 0.0305 | |||
| CHTR / Charter Communications, Inc. | 0.00 | -5.44 | 0.91 | 4.85 | 0.0616 | 0.0306 | |||
| MFC / Manulife Financial Corporation | 0.03 | -5.48 | 0.89 | -2.94 | 0.0605 | 0.0276 | |||
| NKE / NIKE, Inc. | 0.01 | -6.63 | 0.87 | 4.46 | 0.0589 | 0.0292 | |||
| ENB / Enbridge Inc. | 0.02 | -5.48 | 0.87 | -3.35 | 0.0588 | 0.0267 | |||
| AIG / American International Group, Inc. | 0.01 | -4.00 | 0.82 | -5.50 | 0.0560 | 0.0247 | |||
| POOL / Pool Corporation | 0.00 | -43.56 | 0.82 | -48.34 | 0.0559 | -0.0012 | |||
| AEP / American Electric Power Company, Inc. | 0.01 | -5.48 | 0.82 | -10.15 | 0.0558 | 0.0230 | |||
| NSC / Norfolk Southern Corporation | 0.00 | -4.02 | 0.80 | 3.76 | 0.0543 | 0.0267 | |||
| GAH / Arthur J. Gallagher & Co. | 0.00 | 0.80 | 0.0541 | 0.0541 | |||||
| HCA / HCA Healthcare, Inc. | 0.00 | -4.02 | 0.80 | 6.42 | 0.0540 | 0.0272 | |||
| ELV / Elevance Health, Inc. | 0.00 | -6.74 | 0.80 | -16.56 | 0.0540 | 0.0198 | |||
| USB / U.S. Bancorp | 0.02 | -4.18 | 0.79 | 2.75 | 0.0533 | 0.0259 | |||
| MDT / Medtronic plc | 0.01 | -50.63 | 0.78 | -52.14 | 0.0532 | -0.0054 | |||
| SRE / Sempra | 0.01 | -5.28 | 0.78 | 0.52 | 0.0529 | 0.0251 | |||
| SBUX / Starbucks Corporation | 0.01 | -5.49 | 0.77 | -11.72 | 0.0521 | 0.0210 | |||
| ITW / Illinois Tool Works Inc. | 0.00 | -4.17 | 0.77 | -4.49 | 0.0520 | 0.0233 | |||
| NUE / Nucor Corporation | 0.01 | -5.51 | 0.76 | 1.74 | 0.0515 | 0.0248 | |||
| TGT / Target Corporation | 0.01 | -6.12 | 0.75 | -11.35 | 0.0509 | 0.0207 | |||
| PNC / The PNC Financial Services Group, Inc. | 0.00 | -58.41 | 0.75 | -55.92 | 0.0506 | -0.0099 | |||
| CMS / CMS Energy Corporation | 0.01 | -5.13 | 0.74 | -12.46 | 0.0501 | 0.0199 | |||
| PRU / Prudential Financial, Inc. | 0.01 | -2.63 | 0.72 | -6.25 | 0.0488 | 0.0213 | |||
| CMCSA / Comcast Corporation | 0.02 | -4.95 | 0.72 | -8.10 | 0.0485 | 0.0207 | |||
| COO / The Cooper Companies, Inc. | 0.01 | -6.72 | 0.71 | -21.30 | 0.0484 | 0.0160 | |||
| APP / AppLovin Corporation | 0.00 | 0.70 | 0.0475 | 0.0475 | |||||
| MAR / Marriott International, Inc. | 0.00 | -60.38 | 0.70 | -54.58 | 0.0474 | -0.0076 | |||
| DRI / Darden Restaurants, Inc. | 0.00 | 0.70 | 0.0472 | 0.0472 | |||||
| ALNY / Alnylam Pharmaceuticals, Inc. | 0.00 | 0.69 | 0.0468 | 0.0468 | |||||
| NEM / Newmont Corporation | 0.01 | -4.92 | 0.68 | 14.65 | 0.0462 | 0.0250 | |||
| SPG / Simon Property Group, Inc. | 0.00 | -5.28 | 0.68 | -8.36 | 0.0462 | 0.0196 | |||
| DHI / D.R. Horton, Inc. | 0.01 | -4.95 | 0.68 | -3.70 | 0.0460 | 0.0208 | |||
| A / Agilent Technologies, Inc. | 0.01 | -6.33 | 0.67 | -5.48 | 0.0457 | 0.0202 | |||
| CRH / CRH plc | 0.01 | -6.40 | 0.67 | -2.32 | 0.0457 | 0.0210 | |||
| AMT / American Tower Corporation | 0.00 | -6.15 | 0.66 | -4.78 | 0.0446 | 0.0199 | |||
| MKC / McCormick & Company, Incorporated | 0.01 | -4.81 | 0.65 | -12.33 | 0.0444 | 0.0177 | |||
| AEM / Agnico Eagle Mines Limited | 0.01 | -4.93 | 0.64 | 4.21 | 0.0437 | 0.0216 | |||
| APD / Air Products and Chemicals, Inc. | 0.00 | -4.84 | 0.64 | -8.92 | 0.0436 | 0.0183 | |||
| D / Dominion Energy, Inc. | 0.01 | -4.81 | 0.63 | -3.95 | 0.0429 | 0.0193 | |||
| TFC / Truist Financial Corporation | 0.01 | -4.92 | 0.63 | -0.63 | 0.0428 | 0.0201 | |||
| ROK / Rockwell Automation, Inc. | 0.00 | -66.19 | 0.63 | -56.54 | 0.0424 | -0.0091 | |||
| PCAR / PACCAR Inc | 0.01 | -55.24 | 0.62 | -56.34 | 0.0423 | -0.0088 | |||
| KMI / Kinder Morgan, Inc. | 0.02 | -6.13 | 0.61 | -3.31 | 0.0416 | 0.0189 | |||
| VLO / Valero Energy Corporation | 0.00 | -6.55 | 0.60 | -4.90 | 0.0408 | 0.0182 | |||
| FDX / FedEx Corporation | 0.00 | -3.70 | 0.59 | -10.17 | 0.0402 | 0.0166 | |||
| TREX / Trex Company, Inc. | 0.01 | -53.07 | 0.59 | -56.10 | 0.0399 | -0.0080 | |||
| GIS / General Mills, Inc. | 0.01 | -5.08 | 0.58 | -17.80 | 0.0395 | 0.0142 | |||
| LYV / Live Nation Entertainment, Inc. | 0.00 | -3.39 | 0.58 | 11.95 | 0.0394 | 0.0208 | |||
| QSR / Restaurant Brands International Inc. | 0.01 | -4.92 | 0.58 | -5.40 | 0.0392 | 0.0173 | |||
| EXC / Exelon Corporation | 0.01 | -5.03 | 0.57 | -10.49 | 0.0388 | 0.0159 | |||
| PYPL / PayPal Holdings, Inc. | 0.01 | -5.13 | 0.57 | 7.95 | 0.0387 | 0.0198 | |||
| SLB / Schlumberger Limited | 0.02 | -3.91 | 0.55 | -22.32 | 0.0373 | 0.0120 | |||
| IT / Gartner, Inc. | 0.00 | -4.18 | 0.55 | -7.76 | 0.0371 | 0.0159 | |||
| OMC / Omnicom Group Inc. | 0.01 | -5.12 | 0.52 | -17.75 | 0.0352 | 0.0127 | |||
| PEG / Public Service Enterprise Group Incorporated | 0.01 | -5.85 | 0.52 | -3.73 | 0.0350 | 0.0158 | |||
| UPS / United Parcel Service, Inc. | 0.01 | -3.38 | 0.51 | -11.25 | 0.0343 | 0.0139 | |||
| HSY / The Hershey Company | 0.00 | -5.14 | 0.49 | -8.08 | 0.0332 | 0.0142 | |||
| DVN / Devon Energy Corporation | 0.02 | -8.45 | 0.49 | -22.13 | 0.0332 | 0.0107 | |||
| BNS / The Bank of Nova Scotia | 0.01 | -4.22 | 0.47 | 11.75 | 0.0316 | 0.0167 | |||
| OXY / Occidental Petroleum Corporation | 0.01 | -6.55 | 0.45 | -20.53 | 0.0305 | 0.0103 | |||
| CHD / Church & Dwight Co., Inc. | 0.00 | -6.55 | 0.44 | -18.48 | 0.0300 | 0.0106 | |||
| TSN / Tyson Foods, Inc. | 0.01 | -3.84 | 0.44 | -15.80 | 0.0297 | 0.0111 | |||
| REGN / Regeneron Pharmaceuticals, Inc. | 0.00 | -64.48 | 0.43 | -70.63 | 0.0293 | -0.0233 | |||
| EQR / Equity Residential | 0.01 | -6.54 | 0.42 | -11.85 | 0.0288 | 0.0116 | |||
| INTC / Intel Corporation | 0.02 | -2.93 | 0.42 | -4.36 | 0.0283 | 0.0127 | |||
| XEL / Xcel Energy Inc. | 0.01 | -0.15 | 0.41 | -3.95 | 0.0281 | 0.0126 | |||
| BDX / Becton, Dickinson and Company | 0.00 | -3.83 | 0.41 | -27.76 | 0.0276 | 0.0075 | |||
| LYB / LyondellBasell Industries N.V. | 0.01 | -5.28 | 0.39 | -22.24 | 0.0264 | 0.0085 | |||
| BMY / Bristol-Myers Squibb Company | 0.01 | -3.39 | 0.37 | -26.81 | 0.0254 | 0.0071 | |||
| DG / Dollar General Corporation | 0.00 | -4.20 | 0.36 | 24.65 | 0.0244 | 0.0141 | |||
| AVY / Avery Dennison Corporation | 0.00 | -83.02 | 0.36 | -83.28 | 0.0243 | -0.0523 | |||
| DD / DuPont de Nemours, Inc. | 0.00 | -4.67 | 0.33 | -12.27 | 0.0223 | 0.0089 | |||
| AON / Aon plc | 0.00 | -70.12 | 0.33 | -73.34 | 0.0221 | -0.0215 | |||
| WDC / Western Digital Corporation | 0.00 | -4.13 | 0.30 | 52.31 | 0.0202 | 0.0132 | |||
| TER / Teradyne, Inc. | 0.00 | -4.23 | 0.29 | 4.00 | 0.0195 | 0.0096 | |||
| ARE / Alexandria Real Estate Equities, Inc. | 0.00 | -4.19 | 0.27 | -24.73 | 0.0186 | 0.0056 | |||
| CF / CF Industries Holdings, Inc. | 0.00 | -4.94 | 0.27 | 11.93 | 0.0185 | 0.0098 | |||
| IP / International Paper Company | 0.01 | -2.10 | 0.24 | -13.98 | 0.0163 | 0.0063 | |||
| LUV / Southwest Airlines Co. | 0.01 | -4.23 | 0.23 | -7.38 | 0.0153 | 0.0066 | |||
| DOC / Healthpeak Properties, Inc. | 0.01 | -2.07 | 0.22 | -15.18 | 0.0148 | 0.0056 | |||
| MET / MetLife, Inc. | 0.00 | -4.85 | 0.21 | -4.59 | 0.0141 | 0.0063 | |||
| BIIB / Biogen Inc. | 0.00 | -3.21 | 0.21 | -11.54 | 0.0141 | 0.0057 | |||
| DOW / Dow Inc. | 0.01 | -4.21 | 0.20 | -27.21 | 0.0134 | 0.0037 | |||
| HAL / Halliburton Company | 0.01 | -4.16 | 0.18 | -22.81 | 0.0119 | 0.0038 | |||
| GXO / GXO Logistics, Inc. | 0.00 | -100.00 | 0.00 | 0.0000 | |||||
| IQV / IQVIA Holdings Inc. | 0.00 | -100.00 | 0.00 | 0.0000 | |||||
| WY / Weyerhaeuser Company | 0.00 | -100.00 | 0.00 | 0.0000 | |||||
| WSC / WillScot Holdings Corporation | 0.00 | -100.00 | 0.00 | 0.0000 | |||||
| YETI / YETI Holdings, Inc. | 0.00 | -100.00 | 0.00 | 0.0000 | |||||
| SCHD / Schwab Strategic Trust - Schwab U.S. Dividend Equity ETF | 0.00 | -100.00 | 0.00 | 0.0000 | |||||
| SNDK / Sandisk Corporation | 0.00 | -100.00 | 0.00 | 0.0000 | |||||
| BAH / Booz Allen Hamilton Holding Corporation | 0.00 | -100.00 | 0.00 | 0.0000 | |||||
| ENTG / Entegris, Inc. | 0.00 | -100.00 | 0.00 | 0.0000 | |||||
| FTV / Fortive Corporation | 0.00 | -100.00 | 0.00 | 0.0000 | |||||
| TTEK / Tetra Tech, Inc. | 0.00 | -100.00 | 0.00 | 0.0000 | |||||
| LULU / lululemon athletica inc. | 0.00 | -100.00 | 0.00 | 0.0000 | |||||
| SWK / Stanley Black & Decker, Inc. | 0.00 | -100.00 | 0.00 | 0.0000 | |||||
| VYM / Vanguard Whitehall Funds - Vanguard High Dividend Yield ETF | 0.00 | -100.00 | 0.00 | 0.0000 | |||||
| EMB / iShares Trust - iShares J.P. Morgan USD Emerging Markets Bond ETF | 0.00 | -100.00 | 0.00 | 0.0000 | |||||
| GSG / iShares S&P GSCI Commodity-Indexed Trust | 0.00 | -100.00 | 0.00 | 0.0000 | |||||
| ACGL / Arch Capital Group Ltd. | 0.00 | -100.00 | 0.00 | 0.0000 | |||||
| DFS / Discover Financial Services | 0.00 | -100.00 | 0.00 | 0.0000 | |||||
| DAR / Darling Ingredients Inc. | 0.00 | -100.00 | 0.00 | 0.0000 |