Mga Batayang Estadistika
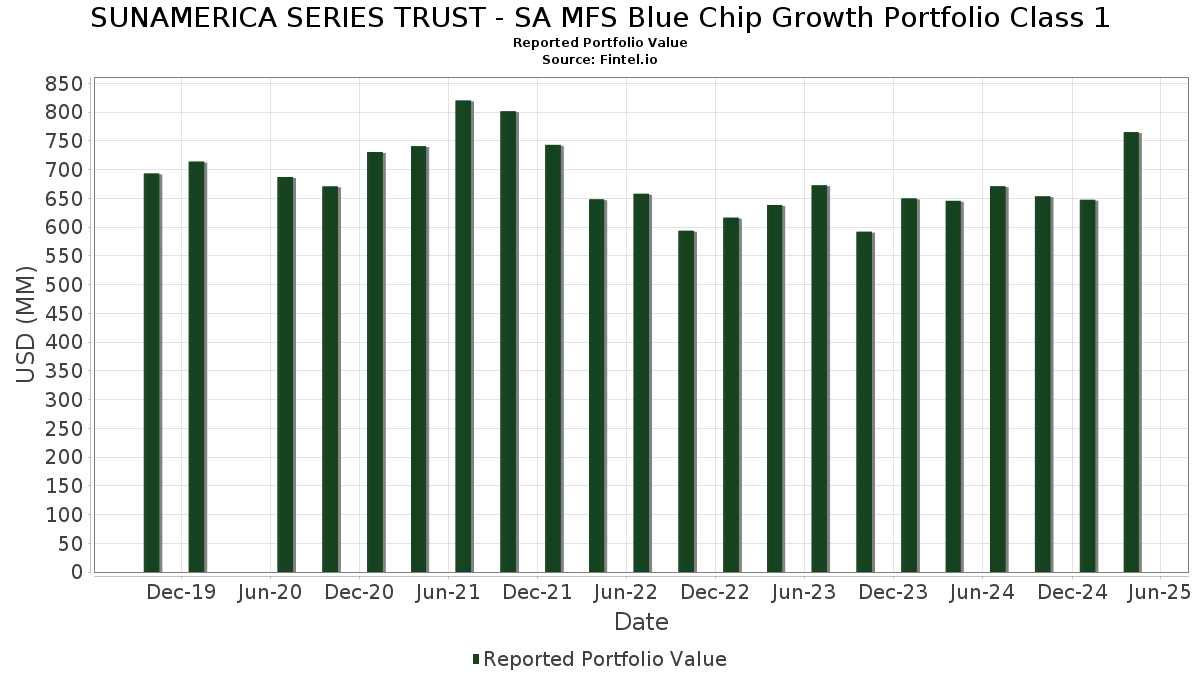
| Nilai Portofolio | $ 764,985,245 |
| Posisi Saat Ini | 91 |
Kepemilikan Terbaru, Kinerja, AUM (dari 13F, 13D)
SUNAMERICA SERIES TRUST - SA MFS Blue Chip Growth Portfolio Class 1 telah mengungkapkan total kepemilikan 91 dalam pengajuan SEC terbaru mereka. Nilai portofolio terbaru dihitung sebesar $ 764,985,245 USD. Aset yang Dikelola (AUM) sebenarnya adalah nilai ini ditambah kas (yang tidak diungkapkan). Aset-aset utama SUNAMERICA SERIES TRUST - SA MFS Blue Chip Growth Portfolio Class 1 adalah Apple Inc. (US:AAPL) , NVIDIA Corporation (US:NVDA) , Microsoft Corporation (US:MSFT) , Amazon.com, Inc. (US:AMZN) , and Alphabet Inc. (US:GOOGL) . Posisi baru SUNAMERICA SERIES TRUST - SA MFS Blue Chip Growth Portfolio Class 1 meliputi: V.F. Corporation (US:VFC) , Westinghouse Air Brake Technologies Corporation (US:WAB) , Vertiv Holdings Co (US:VRT) , Monster Beverage Corporation (US:MNST) , and DraftKings Inc. (US:DKNG) .
Peningkatan Tertinggi Kuartal Ini
Kami menggunakan perubahan dalam alokasi portofolio karena ini adalah metrik yang paling bermakna. Perubahan dapat disebabkan oleh perdagangan atau perubahan harga saham.
| Keamanan | Saham (MM) |
Nilai (Juta Dolar AS) |
Portfolio % | ΔPorsyento ng Portfolio |
|---|---|---|---|---|
| 0.11 | 7.42 | 0.9704 | 0.9122 | |
| 5.68 | 0.7431 | 0.7431 | ||
| 0.03 | 9.90 | 1.2950 | 0.5936 | |
| 0.19 | 75.40 | 9.8637 | 0.5447 | |
| 0.00 | 4.76 | 0.6227 | 0.5340 | |
| 0.00 | 4.95 | 0.6476 | 0.5147 | |
| 0.30 | 3.54 | 0.4627 | 0.4627 | |
| 0.01 | 6.84 | 0.8943 | 0.4167 | |
| 0.02 | 3.11 | 0.4070 | 0.4070 | |
| 0.04 | 2.94 | 0.3851 | 0.3851 |
Penurunan Tertinggi Kuartal Ini
Kami menggunakan perubahan dalam alokasi portofolio karena ini adalah metrik yang paling bermakna. Perubahan dapat disebabkan oleh perdagangan atau perubahan harga saham.
| Keamanan | Saham (MM) |
Nilai (Juta Dolar AS) |
Portfolio % | ΔPorsyento ng Portfolio |
|---|---|---|---|---|
| 0.09 | 13.98 | 1.8284 | -1.3985 | |
| 0.05 | 14.58 | 1.9072 | -1.1180 | |
| 0.06 | 32.06 | 4.1935 | -1.0981 | |
| 0.28 | 52.35 | 6.8488 | -1.0095 | |
| 0.02 | 2.38 | 0.3114 | -0.8373 | |
| 0.21 | 33.78 | 4.4193 | -0.7271 | |
| 0.00 | 0.54 | 0.0709 | -0.4120 | |
| 0.00 | 0.39 | 0.0516 | -0.3952 | |
| 0.00 | 5.75 | 0.7520 | -0.3770 | |
| 0.02 | 6.38 | 0.8340 | -0.3659 |
Pengajuan 13F dan Dana
Formulir ini diajukan pada 2025-06-27 untuk periode pelaporan 2025-04-30. Klik ikon tautan untuk melihat riwayat transaksi selengkapnya.
Tingkatkan ke versi premium untuk membuka data premium dan ekspor ke Excel. ![]() .
.
| Keamanan | Ketik | Harga Saham Rata-rata | Saham (MM) |
ΔSaham (%) |
ΔSaham (%) |
Nilai ($MM) |
Portpolyo (%) |
ΔPortofolio (%) |
|
|---|---|---|---|---|---|---|---|---|---|
| AAPL / Apple Inc. | 0.37 | 30.84 | 79.27 | 17.81 | 10.3696 | -0.0307 | |||
| NVDA / NVIDIA Corporation | 0.71 | 28.70 | 77.82 | 16.75 | 10.1798 | -0.1228 | |||
| MSFT / Microsoft Corporation | 0.19 | 31.33 | 75.40 | 25.07 | 9.8637 | 0.5447 | |||
| AMZN / Amazon.com, Inc. | 0.28 | 32.72 | 52.35 | 2.98 | 6.8488 | -1.0095 | |||
| GOOGL / Alphabet Inc. | 0.21 | 30.36 | 33.78 | 1.47 | 4.4193 | -0.7271 | |||
| META / Meta Platforms, Inc. | 0.06 | 17.55 | 32.06 | -6.36 | 4.1935 | -1.0981 | |||
| AVGO / Broadcom Inc. | 0.08 | 32.38 | 15.92 | 15.16 | 2.0831 | -0.0544 | |||
| NOW / ServiceNow, Inc. | 0.02 | 32.74 | 15.38 | 24.48 | 2.0125 | 0.1021 | |||
| TSLA / Tesla, Inc. | 0.05 | 6.82 | 14.58 | -25.51 | 1.9072 | -1.1180 | |||
| BKNG / Booking Holdings Inc. | 0.00 | 32.91 | 14.27 | 43.05 | 1.8672 | 0.3249 | |||
| GOOG / Alphabet Inc. | 0.09 | -14.44 | 13.98 | -33.05 | 1.8284 | -1.3985 | |||
| SPOT / Spotify Technology S.A. | 0.02 | -2.60 | 13.33 | 9.02 | 1.7434 | -0.1463 | |||
| QCOM / QUALCOMM Incorporated | 0.08 | 77.33 | 12.02 | 52.24 | 1.5730 | 0.3521 | |||
| LLY / Eli Lilly and Company | 0.01 | 43.19 | 11.00 | 58.70 | 1.4394 | 0.3677 | |||
| EQH / Equitable Holdings, Inc. | 0.21 | 31.94 | 10.32 | 19.90 | 1.3497 | 0.0195 | |||
| GWRE / Guidewire Software, Inc. | 0.05 | 33.13 | 10.18 | 29.04 | 1.3323 | 0.1123 | |||
| V / Visa Inc. | 0.03 | 115.84 | 9.90 | 118.16 | 1.2950 | 0.5936 | |||
| VRSK / Verisk Analytics, Inc. | 0.03 | 32.34 | 9.89 | 36.49 | 1.2944 | 0.1738 | |||
| VEEV / Veeva Systems Inc. | 0.04 | 33.14 | 9.72 | 33.38 | 1.2714 | 0.1451 | |||
| AXP / American Express Company | 0.04 | 31.92 | 9.67 | 10.71 | 1.2656 | -0.0851 | |||
| AMP / Ameriprise Financial, Inc. | 0.02 | 31.92 | 9.48 | 14.36 | 1.2408 | -0.0412 | |||
| LRCX / Lam Research Corporation | 0.12 | 31.94 | 8.83 | 16.67 | 1.1548 | -0.0148 | |||
| ADSK / Autodesk, Inc. | 0.03 | 31.94 | 8.75 | 16.22 | 1.1447 | -0.0191 | |||
| KMB / Kimberly-Clark Corporation | 0.06 | 32.23 | 8.22 | 34.07 | 1.0749 | 0.1276 | |||
| CI / The Cigna Group | 0.02 | 33.15 | 8.15 | 53.90 | 1.0657 | 0.2475 | |||
| NTRS / Northern Trust Corporation | 0.08 | 33.13 | 7.53 | 11.42 | 0.9845 | -0.0595 | |||
| AMAT / Applied Materials, Inc. | 0.05 | 8.82 | 7.50 | -9.06 | 0.9805 | -0.2936 | |||
| RBLX / Roblox Corporation | 0.11 | 1,990.89 | 7.42 | 1,872.61 | 0.9704 | 0.9122 | |||
| ABBV / AbbVie Inc. | 0.04 | 32.76 | 7.35 | 40.86 | 0.9619 | 0.1549 | |||
| BLDR / Builders FirstSource, Inc. | 0.06 | 118.43 | 7.19 | 56.20 | 0.9400 | 0.2290 | |||
| DBX / Dropbox, Inc. | 0.25 | 32.81 | 7.09 | 17.95 | 0.9269 | -0.0017 | |||
| MA / Mastercard Incorporated | 0.01 | 124.21 | 6.84 | 121.27 | 0.8943 | 0.4167 | |||
| LAMR / Lamar Advertising Company | 0.06 | 33.03 | 6.61 | 19.77 | 0.8648 | 0.0116 | |||
| PFE / Pfizer Inc. | 0.27 | 32.76 | 6.61 | 22.19 | 0.8647 | 0.0285 | |||
| APP / AppLovin Corporation | 0.02 | 12.71 | 6.38 | -17.87 | 0.8340 | -0.3659 | |||
| TEAM / Atlassian Corporation | 0.03 | 112.36 | 6.32 | 58.06 | 0.8270 | 0.2087 | |||
| MCK / McKesson Corporation | 0.01 | -30.63 | 5.81 | -16.87 | 0.7607 | -0.3204 | |||
| ORLY / O'Reilly Automotive, Inc. | 0.00 | -43.49 | 5.75 | -21.08 | 0.7520 | -0.3770 | |||
| US3130AK6H44 / Federal Home Loan Banks | 5.68 | 0.7431 | 0.7431 | ||||||
| CRM / Salesforce, Inc. | 0.02 | 32.76 | 5.63 | 4.39 | 0.7370 | -0.0971 | |||
| NRG / NRG Energy, Inc. | 0.05 | 32.72 | 5.21 | 41.97 | 0.6811 | 0.1142 | |||
| TGT / Target Corporation | 0.05 | 20.07 | 5.10 | -15.81 | 0.6666 | -0.2690 | |||
| IQV / IQVIA Holdings Inc. | 0.03 | 31.77 | 5.03 | 1.47 | 0.6582 | -0.1082 | |||
| NFLX / Netflix, Inc. | 0.00 | 129.25 | 4.95 | 530.57 | 0.6476 | 0.5147 | |||
| LDOS / Leidos Holdings, Inc. | 0.03 | 5.21 | 4.93 | 9.04 | 0.6454 | -0.0541 | |||
| COST / Costco Wholesale Corporation | 0.00 | 718.12 | 4.76 | 730.54 | 0.6227 | 0.5340 | |||
| APH / Amphenol Corporation | 0.06 | 31.94 | 4.73 | 43.47 | 0.6192 | 0.1091 | |||
| BPOP / Popular, Inc. | 0.04 | 95.40 | 4.14 | 81.11 | 0.5419 | 0.1884 | |||
| GDDY / GoDaddy Inc. | 0.02 | -58.55 | 3.96 | 1.28 | 0.5178 | -0.0638 | |||
| VFC / V.F. Corporation | 0.30 | 3.54 | 0.4627 | 0.4627 | |||||
| EXPE / Expedia Group, Inc. | 0.02 | 44.24 | 3.39 | 52.61 | 0.4436 | 0.1013 | |||
| TYL / Tyler Technologies, Inc. | 0.01 | 33.13 | 3.36 | 20.23 | 0.4401 | 0.0076 | |||
| MHK / Mohawk Industries, Inc. | 0.03 | 32.33 | 3.22 | 15.08 | 0.4214 | -0.0113 | |||
| WAB / Westinghouse Air Brake Technologies Corporation | 0.02 | 3.11 | 0.4070 | 0.4070 | |||||
| DXCM / DexCom, Inc. | 0.04 | 2.94 | 0.3851 | 0.3851 | |||||
| VRTX / Vertex Pharmaceuticals Incorporated | 0.00 | 32.76 | 2.50 | 46.49 | 0.3274 | 0.0633 | |||
| VRT / Vertiv Holdings Co | 0.03 | 2.50 | 0.3268 | 0.3268 | |||||
| CL / Colgate-Palmolive Company | 0.03 | 33.01 | 2.46 | 41.50 | 0.3212 | 0.0528 | |||
| DDOG / Datadog, Inc. | 0.02 | -55.25 | 2.38 | -67.97 | 0.3114 | -0.8373 | |||
| RPM / RPM International Inc. | 0.02 | 31.37 | 2.38 | 10.76 | 0.3110 | -0.0208 | |||
| JLL / Jones Lang LaSalle Incorporated | 0.01 | -8.17 | 2.38 | -26.15 | 0.3107 | -0.1865 | |||
| PEGA / Pegasystems Inc. | 0.03 | 142.84 | 2.34 | 106.44 | 0.3063 | 0.1310 | |||
| RJF / Raymond James Financial, Inc. | 0.01 | 32.71 | 2.03 | 7.97 | 0.2657 | -0.0252 | |||
| TJX / The TJX Companies, Inc. | 0.01 | 33.02 | 1.79 | 37.22 | 0.2339 | 0.0324 | |||
| INCY / Incyte Corporation | 0.03 | 33.03 | 1.68 | 12.39 | 0.2196 | -0.0113 | |||
| FLS / Flowserve Corporation | 0.03 | 32.40 | 1.53 | -4.39 | 0.1996 | -0.0470 | |||
| MNST / Monster Beverage Corporation | 0.02 | 1.40 | 0.1825 | 0.1825 | |||||
| DKNG / DraftKings Inc. | 0.04 | 1.37 | 0.1793 | 0.1793 | |||||
| SYF / Synchrony Financial | 0.03 | 1.33 | 0.1737 | 0.1737 | |||||
| BMY / Bristol-Myers Squibb Company | 0.03 | 1.31 | 0.1717 | 0.1717 | |||||
| TXRH / Texas Roadhouse, Inc. | 0.01 | 32.78 | 1.15 | 21.66 | 0.1500 | 0.0043 | |||
| Aptiv PLC / EC (JE00BTDN8H13) | 0.02 | 1.12 | 0.1461 | 0.1461 | |||||
| EPIC GAMES INC PP / EC (000000000) | 0.00 | 0.95 | 0.1249 | 0.1249 | |||||
| SCHW / The Charles Schwab Corporation | 0.01 | -64.70 | 0.85 | -65.29 | 0.1112 | -0.2670 | |||
| SRPT / Sarepta Therapeutics, Inc. | 0.01 | 0.82 | 0.1070 | 0.1070 | |||||
| NURO, INC. / EP (000000000) | 0.05 | 0.60 | 0.0791 | 0.0791 | |||||
| ROST / Ross Stores, Inc. | 0.00 | -81.21 | 0.54 | -82.68 | 0.0709 | -0.4120 | |||
| REDWOOD MATERIALS SER C / EP (000000000) | 0.01 | 0.51 | 0.0672 | 0.0672 | |||||
| HD / The Home Depot, Inc. | 0.00 | 32.74 | 0.51 | 16.14 | 0.0669 | -0.0012 | |||
| SPG / Simon Property Group, Inc. | 0.00 | -89.60 | 0.39 | -86.88 | 0.0516 | -0.3952 | |||
| STRIPE INC CL B COMMON PP / EC (000000000) | 0.01 | 0.38 | 0.0500 | 0.0500 | |||||
| WAYMO LLC / EP (000000000) | 0.00 | 0.34 | 0.0446 | 0.0446 | |||||
| RAPPI INC SER E CVT PFD / EP (000000000) | 0.01 | 0.31 | 0.0404 | 0.0404 | |||||
| CANVA COMMON STOCK PP / EC (000000000) | 0.00 | 0.30 | 0.0391 | 0.0391 | |||||
| SILA NANO SER F CVT PFD / EP (000000000) | 0.01 | 0.15 | 0.0203 | 0.0203 | |||||
| FORMAGRID INC SER F C / EP (000000000) | 0.00 | 0.15 | 0.0191 | 0.0191 | |||||
| NURO SERIES D CVT PFD / EP (000000000) | 0.01 | 0.13 | 0.0173 | 0.0173 | |||||
| CANVA SERIES A CVT / EP (000000000) | 0.00 | 0.03 | 0.0045 | 0.0045 | |||||
| CELONIS SERIES D CVT PFD / EP (000000000) | 0.00 | 0.01 | 0.0017 | 0.0017 | |||||
| CANVA SERIES A 3 CVT / EP (000000000) | 0.00 | 0.01 | 0.0009 | 0.0009 | |||||
| MAGIC LEAP CL A COMMON / EC (000000000) | 0.00 | 0.00 | 0.0001 | 0.0001 |