Mga Batayang Estadistika
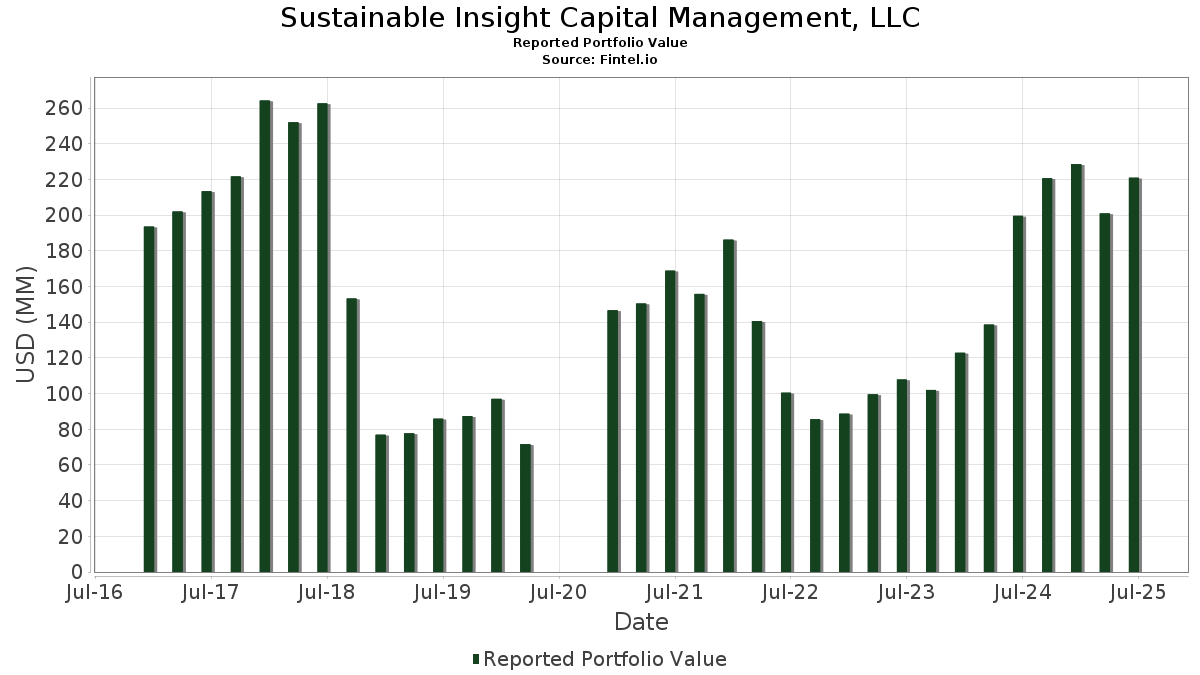
| Nilai Portofolio | $ 220,912,353 |
| Posisi Saat Ini | 61 |
Kepemilikan Terbaru, Kinerja, AUM (dari 13F, 13D)
Sustainable Insight Capital Management, LLC telah mengungkapkan total kepemilikan 61 dalam pengajuan SEC terbaru mereka. Nilai portofolio terbaru dihitung sebesar $ 220,912,353 USD. Aset yang Dikelola (AUM) sebenarnya adalah nilai ini ditambah kas (yang tidak diungkapkan). Aset-aset utama Sustainable Insight Capital Management, LLC adalah Apple Inc. (US:AAPL) , NVIDIA Corporation (US:NVDA) , Microsoft Corporation (US:MSFT) , Amazon.com, Inc. (US:AMZN) , and Broadcom Inc. (US:AVGO) . Posisi baru Sustainable Insight Capital Management, LLC meliputi: Ferrari N.V. (US:RACE) , Willis Towers Watson Public Limited Company (US:WTW) , Vistra Corp. (US:VST) , .
Peningkatan Tertinggi Kuartal Ini
Kami menggunakan perubahan dalam alokasi portofolio karena ini adalah metrik yang paling bermakna. Perubahan dapat disebabkan oleh perdagangan atau perubahan harga saham.
| Keamanan | Saham (MM) |
Nilai (Juta Dolar AS) |
Portfolio % | ΔPorsyento ng Portfolio |
|---|---|---|---|---|
| 0.06 | 12.38 | 5.6054 | 5.6054 | |
| 0.10 | 15.99 | 7.2383 | 3.4424 | |
| 0.03 | 15.93 | 7.2110 | 3.0003 | |
| 0.01 | 4.07 | 1.8436 | 1.8436 | |
| 0.01 | 4.95 | 2.2425 | 1.7657 | |
| 0.07 | 15.01 | 6.7951 | 1.3058 | |
| 0.02 | 3.47 | 1.5717 | 1.3008 | |
| 0.01 | 2.17 | 0.9807 | 0.9807 | |
| 0.02 | 2.15 | 0.9748 | 0.9748 | |
| 0.01 | 2.15 | 0.9728 | 0.9728 |
Penurunan Tertinggi Kuartal Ini
Kami menggunakan perubahan dalam alokasi portofolio karena ini adalah metrik yang paling bermakna. Perubahan dapat disebabkan oleh perdagangan atau perubahan harga saham.
| Keamanan | Saham (MM) |
Nilai (Juta Dolar AS) |
Portfolio % | ΔPorsyento ng Portfolio |
|---|---|---|---|---|
| 0.03 | 4.03 | 1.8244 | -1.8655 | |
| 0.02 | 3.91 | 1.7703 | -1.7518 | |
| 0.03 | 6.87 | 3.1097 | -1.5768 | |
| 0.01 | 2.38 | 1.0794 | -1.5277 | |
| 0.24 | 7.02 | 3.1759 | -1.5141 | |
| 0.03 | 2.21 | 1.0019 | -1.4388 | |
| 0.00 | 1.15 | 0.5215 | -1.3367 | |
| 0.00 | 1.84 | 0.8328 | -0.7826 | |
| 0.01 | 1.10 | 0.4998 | -0.7624 | |
| 0.01 | 1.86 | 0.8429 | -0.7207 |
Pengajuan 13F dan Dana
Formulir ini diajukan pada 2025-08-06 untuk periode pelaporan 2025-06-30. Klik ikon tautan untuk melihat riwayat transaksi selengkapnya.
Tingkatkan ke versi premium untuk membuka data premium dan ekspor ke Excel. ![]() .
.
| Keamanan | Ketik | Harga Saham Rata-rata | Saham (MM) |
ΔSaham (%) |
ΔSaham (%) |
Nilai ($MM) |
Portpolyo (%) |
ΔPortofolio (%) |
|
|---|---|---|---|---|---|---|---|---|---|
| AAPL / Apple Inc. | 0.08 | 20.99 | 17.17 | 11.75 | 7.7734 | 0.1247 | |||
| NVDA / NVIDIA Corporation | 0.10 | 43.84 | 15.99 | 109.68 | 7.2383 | 3.4424 | |||
| MSFT / Microsoft Corporation | 0.03 | 42.12 | 15.93 | 88.32 | 7.2110 | 3.0003 | |||
| AMZN / Amazon.com, Inc. | 0.07 | 18.04 | 15.01 | 36.12 | 6.7951 | 1.3058 | |||
| AVGO / Broadcom Inc. | 0.05 | -31.58 | 14.78 | 12.64 | 6.6886 | 0.1592 | |||
| PANW / Palo Alto Networks, Inc. | 0.07 | -5.03 | 14.35 | 13.89 | 6.4936 | 0.2240 | |||
| DRI / Darden Restaurants, Inc. | 0.06 | 12.38 | 5.6054 | 5.6054 | |||||
| LLY / Eli Lilly and Company | 0.01 | 37.55 | 10.04 | 29.82 | 4.5464 | 0.6956 | |||
| T / AT&T Inc. | 0.24 | -27.24 | 7.02 | -25.55 | 3.1759 | -1.5141 | |||
| TMUS / T-Mobile US, Inc. | 0.03 | -18.32 | 6.87 | -27.04 | 3.1097 | -1.5768 | |||
| META / Meta Platforms, Inc. | 0.01 | 303.85 | 4.95 | 417.66 | 2.2425 | 1.7657 | |||
| ALL / The Allstate Corporation | 0.02 | -5.58 | 4.33 | -8.20 | 1.9616 | -0.3882 | |||
| MMC / Marsh & McLennan Companies, Inc. | 0.02 | -0.39 | 4.25 | -10.75 | 1.9241 | -0.4467 | |||
| MSCI / MSCI Inc. | 0.01 | -12.70 | 4.21 | -10.97 | 1.9071 | -0.4483 | |||
| COST / Costco Wholesale Corporation | 0.00 | 52.83 | 4.18 | 59.96 | 1.8901 | 0.5908 | |||
| RACE / Ferrari N.V. | 0.01 | 4.07 | 1.8436 | 1.8436 | |||||
| TDG / TransDigm Group Incorporated | 0.00 | 23.67 | 4.07 | 35.93 | 1.8413 | 0.3520 | |||
| CPRT / Copart, Inc. | 0.08 | 45.34 | 4.06 | 26.02 | 1.8398 | 0.2346 | |||
| ABT / Abbott Laboratories | 0.03 | -46.98 | 4.03 | -45.64 | 1.8244 | -1.8655 | |||
| HUM / Humana Inc. | 0.02 | -40.18 | 3.91 | -44.73 | 1.7703 | -1.7518 | |||
| TD / The Toronto-Dominion Bank | 0.05 | 32.82 | 3.81 | 63.12 | 1.7260 | 0.5626 | |||
| GOOGL / Alphabet Inc. | 0.02 | 459.72 | 3.47 | 538.24 | 1.5717 | 1.3008 | |||
| GOOG / Alphabet Inc. | 0.01 | 1,508.70 | 2.63 | 2.42 | 1.1884 | -0.6348 | |||
| JPM / JPMorgan Chase & Co. | 0.01 | -61.48 | 2.38 | -54.48 | 1.0794 | -1.5277 | |||
| WFC / Wells Fargo & Company | 0.03 | -59.55 | 2.21 | -54.86 | 1.0019 | -1.4388 | |||
| ICE / Intercontinental Exchange, Inc. | 0.01 | 2.17 | 0.9807 | 0.9807 | |||||
| HIG / The Hartford Insurance Group, Inc. | 0.02 | 2.15 | 0.9748 | 0.9748 | |||||
| COF / Capital One Financial Corporation | 0.01 | 2.15 | 0.9728 | 0.9728 | |||||
| ACGL / Arch Capital Group Ltd. | 0.02 | 2.14 | 0.9669 | 0.9669 | |||||
| WTW / Willis Towers Watson Public Limited Company | 0.01 | 2.11 | 0.9561 | 0.9561 | |||||
| NFLX / Netflix, Inc. | 0.00 | 468.15 | 2.05 | 718.33 | 0.9299 | 0.8046 | |||
| JCI / Johnson Controls International plc | 0.02 | 1.90 | 0.8581 | 0.8581 | |||||
| DOV / Dover Corporation | 0.01 | -43.16 | 1.86 | -40.72 | 0.8429 | -0.7207 | |||
| PH / Parker-Hannifin Corporation | 0.00 | -50.66 | 1.84 | -43.33 | 0.8328 | -0.7826 | |||
| ORCL / Oracle Corporation | 0.01 | 1.68 | 0.7596 | 0.7596 | |||||
| CNQ / Canadian Natural Resources Limited | 0.04 | 79.40 | 1.31 | 83.26 | 0.5952 | 0.2382 | |||
| FNV / Franco-Nevada Corporation | 0.01 | 57.40 | 1.17 | 64.47 | 0.5303 | 0.1756 | |||
| SHW / The Sherwin-Williams Company | 0.00 | -68.62 | 1.15 | -69.17 | 0.5215 | -1.3367 | |||
| CP / Canadian Pacific Kansas City Limited | 0.01 | 37.07 | 1.14 | 54.88 | 0.5177 | 0.1501 | |||
| WMT / Walmart Inc. | 0.01 | -60.91 | 1.10 | -56.45 | 0.4998 | -0.7624 | |||
| NOW / ServiceNow, Inc. | 0.00 | 55.30 | 1.05 | 100.57 | 0.4770 | 0.2155 | |||
| FSV / FirstService Corporation | 0.00 | 68.78 | 0.77 | 77.42 | 0.3489 | 0.1328 | |||
| CRWD / CrowdStrike Holdings, Inc. | 0.00 | 55.88 | 0.64 | 125.18 | 0.2875 | 0.1471 | |||
| MOS / The Mosaic Company | 0.02 | 0.60 | 0.2725 | 0.2725 | |||||
| ANET / Arista Networks Inc | 0.01 | 54.87 | 0.55 | 104.44 | 0.2502 | 0.1157 | |||
| KR / The Kroger Co. | 0.01 | -59.59 | 0.55 | -57.18 | 0.2501 | -0.3920 | |||
| CHD / Church & Dwight Co., Inc. | 0.01 | -51.46 | 0.52 | -57.68 | 0.2362 | -0.3767 | |||
| DG / Dollar General Corporation | 0.00 | 0.51 | 0.2296 | 0.2296 | |||||
| EQIX / Equinix, Inc. | 0.00 | 11.88 | 0.50 | 9.15 | 0.2272 | -0.0017 | |||
| SPG / Simon Property Group, Inc. | 0.00 | -3.05 | 0.46 | -6.13 | 0.2081 | -0.0357 | |||
| APH / Amphenol Corporation | 0.00 | 0.44 | 0.1992 | 0.1992 | |||||
| TSLA / Tesla, Inc. | 0.00 | -54.06 | 0.33 | -43.68 | 0.1513 | -0.1441 | |||
| BRK.B / Berkshire Hathaway Inc. | 0.00 | -54.42 | 0.32 | -58.44 | 0.1427 | -0.2348 | |||
| TRGP / Targa Resources Corp. | 0.00 | 0.24 | 0.1103 | 0.1103 | |||||
| PLD / Prologis, Inc. | 0.00 | -49.81 | 0.24 | -52.84 | 0.1093 | -0.1454 | |||
| CCI / Crown Castle Inc. | 0.00 | 0.23 | 0.1061 | 0.1061 | |||||
| SBAC / SBA Communications Corporation | 0.00 | -55.24 | 0.23 | -52.32 | 0.1026 | -0.1335 | |||
| BXP / Boston Properties, Inc. | 0.00 | -51.28 | 0.22 | -51.11 | 0.1002 | -0.1251 | |||
| V / Visa Inc. | 0.00 | -54.42 | 0.22 | -53.89 | 0.0995 | -0.1374 | |||
| VST / Vistra Corp. | 0.00 | 0.21 | 0.0965 | 0.0965 | |||||
| TPIC / TPI Composites, Inc. | 0.02 | 0.01 | 0.0063 | 0.0063 | |||||
| JNJ / Johnson & Johnson | 0.00 | -100.00 | 0.00 | 0.0000 | |||||
| CMG / Chipotle Mexican Grill, Inc. | 0.00 | -100.00 | 0.00 | 0.0000 | |||||
| MSI / Motorola Solutions, Inc. | 0.00 | -100.00 | 0.00 | 0.0000 | |||||
| PSX / Phillips 66 | 0.00 | -100.00 | 0.00 | 0.0000 | |||||
| HES / Hess Corporation | 0.00 | -100.00 | 0.00 | 0.0000 | |||||
| UBS / UBS Group AG | 0.00 | -100.00 | 0.00 | 0.0000 | |||||
| CM / Canadian Imperial Bank of Commerce | 0.00 | -100.00 | 0.00 | 0.0000 | |||||
| CRM / Salesforce, Inc. | 0.00 | -100.00 | 0.00 | 0.0000 | |||||
| FTNT / Fortinet, Inc. | 0.00 | -100.00 | 0.00 | 0.0000 | |||||
| HD / The Home Depot, Inc. | 0.00 | -100.00 | 0.00 | 0.0000 | |||||
| MA / Mastercard Incorporated | 0.00 | -100.00 | 0.00 | 0.0000 | |||||
| CNI / Canadian National Railway Company | 0.00 | -100.00 | 0.00 | 0.0000 | |||||
| MNST / Monster Beverage Corporation | 0.00 | -100.00 | 0.00 | 0.0000 | |||||
| NI / NiSource Inc. | 0.00 | -100.00 | 0.00 | 0.0000 | |||||
| PLTR / Palantir Technologies Inc. | 0.00 | -100.00 | 0.00 | 0.0000 | |||||
| WELL / Welltower Inc. | 0.00 | -100.00 | 0.00 | 0.0000 | |||||
| PG / The Procter & Gamble Company | 0.00 | -100.00 | 0.00 | 0.0000 | |||||
| ATO / Atmos Energy Corporation | 0.00 | -100.00 | 0.00 | 0.0000 | |||||
| MAA / Mid-America Apartment Communities, Inc. | 0.00 | -100.00 | 0.00 | 0.0000 | |||||
| ABBV / AbbVie Inc. | 0.00 | -100.00 | 0.00 | 0.0000 | |||||
| UNH / UnitedHealth Group Incorporated | 0.00 | -100.00 | 0.00 | 0.0000 | |||||
| MET / MetLife, Inc. | 0.00 | -100.00 | 0.00 | 0.0000 |