Mga Batayang Estadistika
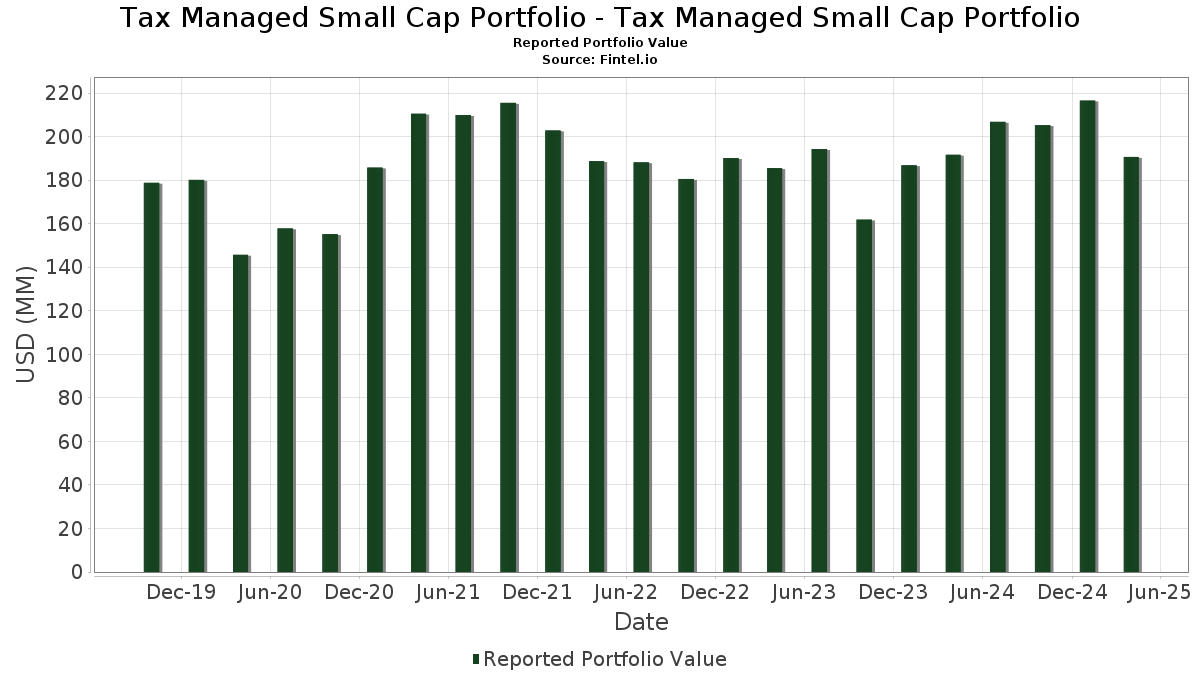
| Nilai Portofolio | $ 190,652,488 |
| Posisi Saat Ini | 73 |
Kepemilikan Terbaru, Kinerja, AUM (dari 13F, 13D)
Tax Managed Small Cap Portfolio - Tax Managed Small Cap Portfolio telah mengungkapkan total kepemilikan 73 dalam pengajuan SEC terbaru mereka. Nilai portofolio terbaru dihitung sebesar $ 190,652,488 USD. Aset yang Dikelola (AUM) sebenarnya adalah nilai ini ditambah kas (yang tidak diungkapkan). Aset-aset utama Tax Managed Small Cap Portfolio - Tax Managed Small Cap Portfolio adalah Commerce Bancshares, Inc. (US:CBSH) , AptarGroup, Inc. (US:ATR) , Core & Main, Inc. (US:CNM) , CBIZ, Inc. (US:CBZ) , and Essential Properties Realty Trust, Inc. (US:EPRT) . Posisi baru Tax Managed Small Cap Portfolio - Tax Managed Small Cap Portfolio meliputi: A. O. Smith Corporation (US:AOS) , AZZ Inc. (US:AZZ) , Kemper Corporation (US:KMPR) , Taylor Morrison Home Corporation (DE:THM) , and Freshpet, Inc. (US:FRPT) .
Peningkatan Tertinggi Kuartal Ini
Kami menggunakan perubahan dalam alokasi portofolio karena ini adalah metrik yang paling bermakna. Perubahan dapat disebabkan oleh perdagangan atau perubahan harga saham.
| Keamanan | Saham (MM) |
Nilai (Juta Dolar AS) |
Portfolio % | ΔPorsyento ng Portfolio |
|---|---|---|---|---|
| 0.04 | 3.02 | 1.5844 | 1.5844 | |
| 0.02 | 2.04 | 1.0712 | 1.0712 | |
| 0.03 | 1.75 | 0.9190 | 0.9190 | |
| 0.02 | 1.38 | 0.7220 | 0.7220 | |
| 0.11 | 1.94 | 1.0205 | 0.6280 | |
| 3.55 | 3.55 | 1.8609 | 0.5783 | |
| 0.01 | 4.40 | 2.3102 | 0.4927 | |
| 0.02 | 3.38 | 1.7755 | 0.4783 | |
| 0.04 | 5.41 | 2.8416 | 0.4486 | |
| 0.01 | 0.77 | 0.4064 | 0.4064 |
Penurunan Tertinggi Kuartal Ini
Kami menggunakan perubahan dalam alokasi portofolio karena ini adalah metrik yang paling bermakna. Perubahan dapat disebabkan oleh perdagangan atau perubahan harga saham.
| Keamanan | Saham (MM) |
Nilai (Juta Dolar AS) |
Portfolio % | ΔPorsyento ng Portfolio |
|---|---|---|---|---|
| 0.02 | 2.20 | 1.1554 | -0.6838 | |
| 0.01 | 2.89 | 1.5174 | -0.5629 | |
| 0.05 | 4.53 | 2.3789 | -0.4921 | |
| 0.05 | 3.87 | 2.0298 | -0.3867 | |
| 0.01 | 0.70 | 0.3677 | -0.3824 | |
| 0.00 | 0.60 | 0.3165 | -0.3182 | |
| 0.01 | 2.74 | 1.4370 | -0.3073 | |
| 0.02 | 1.77 | 0.9301 | -0.2853 | |
| 0.07 | 4.87 | 2.5571 | -0.2802 | |
| 0.03 | 3.71 | 1.9452 | -0.2743 |
Pengajuan 13F dan Dana
Formulir ini diajukan pada 2025-06-23 untuk periode pelaporan 2025-04-30. Klik ikon tautan untuk melihat riwayat transaksi selengkapnya.
Tingkatkan ke versi premium untuk membuka data premium dan ekspor ke Excel. ![]() .
.
| Keamanan | Ketik | Harga Saham Rata-rata | Saham (MM) |
ΔSaham (%) |
ΔSaham (%) |
Nilai ($MM) |
Portpolyo (%) |
ΔPortofolio (%) |
|
|---|---|---|---|---|---|---|---|---|---|
| CBSH / Commerce Bancshares, Inc. | 0.10 | 0.00 | 5.92 | -9.07 | 3.1094 | 0.0982 | |||
| ATR / AptarGroup, Inc. | 0.04 | 9.58 | 5.41 | 4.56 | 2.8416 | 0.4486 | |||
| CNM / Core & Main, Inc. | 0.10 | 0.00 | 5.11 | -6.67 | 2.6820 | 0.1518 | |||
| CBZ / CBIZ, Inc. | 0.07 | 0.00 | 4.87 | -20.64 | 2.5571 | -0.2802 | |||
| EPRT / Essential Properties Realty Trust, Inc. | 0.14 | -19.06 | 4.66 | -18.88 | 2.4468 | -0.2093 | |||
| WH / Wyndham Hotels & Resorts, Inc. | 0.05 | -10.17 | 4.53 | -27.04 | 2.3789 | -0.4921 | |||
| CHE / Chemed Corporation | 0.01 | 8.17 | 4.40 | 11.95 | 2.3102 | 0.4927 | |||
| WTM / White Mountains Insurance Group, Ltd. | 0.00 | 0.00 | 4.27 | -8.53 | 2.2392 | 0.0834 | |||
| RLI / RLI Corp. | 0.05 | 0.00 | 4.02 | 0.90 | 2.1093 | 0.2685 | |||
| SSB / SouthState Corporation | 0.05 | 0.00 | 3.99 | -17.82 | 2.0932 | -0.1495 | |||
| SF / Stifel Financial Corp. | 0.05 | 0.00 | 3.87 | -26.03 | 2.0298 | -0.3867 | |||
| IDA / IDACORP, Inc. | 0.03 | -21.82 | 3.75 | -16.03 | 1.9693 | -0.0958 | |||
| PFGC / Performance Food Group Company | 0.05 | 0.00 | 3.73 | -10.69 | 1.9561 | 0.0276 | |||
| DORM / Dorman Products, Inc. | 0.03 | -10.58 | 3.71 | -22.82 | 1.9452 | -0.2743 | |||
| FFIN / First Financial Bankshares, Inc. | 0.11 | 0.00 | 3.64 | -10.07 | 1.9124 | 0.0400 | |||
| CBU / Community Financial System, Inc. | 0.07 | 0.00 | 3.57 | -16.70 | 1.8722 | -0.1068 | |||
| AAON / AAON, Inc. | 0.04 | 27.88 | 3.57 | 0.31 | 1.8710 | 0.2283 | |||
| ARMK / Aramark | 0.11 | 0.00 | 3.56 | -14.10 | 1.8682 | -0.0465 | |||
| US61747C7074 / Morgan Stanley Institutional Liquidity Funds Government Portfolio, Institutional Class | 3.55 | 27.76 | 3.55 | 27.75 | 1.8609 | 0.5783 | |||
| BMI / Badger Meter, Inc. | 0.02 | 0.00 | 3.50 | 3.24 | 1.8386 | 0.2703 | |||
| VVV / Valvoline Inc. | 0.10 | 0.00 | 3.46 | -7.68 | 1.8181 | 0.0840 | |||
| OPCH / Option Care Health, Inc. | 0.11 | -12.47 | 3.45 | -8.54 | 1.8102 | 0.0675 | |||
| EGP / EastGroup Properties, Inc. | 0.02 | 0.00 | 3.44 | -3.64 | 1.8045 | 0.1552 | |||
| ESE / ESCO Technologies Inc. | 0.02 | 2.26 | 3.38 | 20.56 | 1.7755 | 0.4783 | |||
| CNS / Cohen & Steers, Inc. | 0.04 | 0.00 | 3.35 | -13.90 | 1.7595 | -0.0398 | |||
| MIDD / The Middleby Corporation | 0.02 | 0.00 | 3.09 | -22.09 | 1.6198 | -0.2107 | |||
| AOS / A. O. Smith Corporation | 0.04 | 3.02 | 1.5844 | 1.5844 | |||||
| USPH / U.S. Physical Therapy, Inc. | 0.04 | 0.00 | 3.00 | -19.84 | 1.5738 | -0.1550 | |||
| CSWI / CSW Industrials, Inc. | 0.01 | -32.21 | 2.89 | -35.77 | 1.5174 | -0.5629 | |||
| FELE / Franklin Electric Co., Inc. | 0.03 | 13.29 | 2.83 | -3.74 | 1.4858 | 0.1266 | |||
| TRNO / Terreno Realty Corporation | 0.05 | 0.00 | 2.76 | -13.89 | 1.4508 | -0.0329 | |||
| WWD / Woodward, Inc. | 0.01 | -28.35 | 2.74 | -27.45 | 1.4370 | -0.3073 | |||
| CCCS / CCC Intelligent Solutions Holdings Inc. | 0.29 | 0.00 | 2.72 | -16.65 | 1.4297 | -0.0808 | |||
| AIN / Albany International Corp. | 0.04 | 0.00 | 2.58 | -18.55 | 1.3552 | -0.1102 | |||
| HAYW / Hayward Holdings, Inc. | 0.19 | 39.84 | 2.56 | 23.82 | 1.3452 | 0.3882 | |||
| ATMU / Atmus Filtration Technologies Inc. | 0.07 | 0.00 | 2.49 | -17.09 | 1.3084 | -0.0813 | |||
| BFAM / Bright Horizons Family Solutions Inc. | 0.02 | 0.00 | 2.46 | 2.28 | 1.2935 | 0.1801 | |||
| GPI / Group 1 Automotive, Inc. | 0.01 | 0.00 | 2.44 | -11.57 | 1.2792 | 0.0053 | |||
| DCI / Donaldson Company, Inc. | 0.04 | 0.00 | 2.41 | -7.67 | 1.2647 | 0.0585 | |||
| EEFT / Euronet Worldwide, Inc. | 0.02 | 0.00 | 2.37 | 0.59 | 1.2457 | 0.1554 | |||
| LSTR / Landstar System, Inc. | 0.02 | 0.00 | 2.31 | -18.53 | 1.2135 | -0.0981 | |||
| BCPC / Balchem Corporation | 0.01 | 18.97 | 2.31 | 16.44 | 1.2118 | 0.2954 | |||
| ITGR / Integer Holdings Corporation | 0.02 | 0.00 | 2.28 | -11.17 | 1.1941 | 0.0102 | |||
| ADUS / Addus HomeCare Corporation | 0.02 | -33.78 | 2.20 | -44.68 | 1.1554 | -0.6838 | |||
| LKQ / LKQ Corporation | 0.06 | 0.00 | 2.18 | 2.20 | 1.1464 | 0.1586 | |||
| AZZ / AZZ Inc. | 0.02 | 2.04 | 1.0712 | 1.0712 | |||||
| WMS / Advanced Drainage Systems, Inc. | 0.02 | 34.10 | 1.98 | 25.86 | 1.0375 | 0.3117 | |||
| AGS / The Hour Glass Limited | 0.11 | 136.77 | 1.94 | 128.98 | 1.0205 | 0.6280 | |||
| SYBT / Stock Yards Bancorp, Inc. | 0.03 | 0.00 | 1.85 | -1.23 | 0.9732 | 0.1054 | |||
| FAF / First American Financial Corporation | 0.03 | 0.00 | 1.84 | -3.81 | 0.9680 | 0.0818 | |||
| ALGM / Allegro MicroSystems, Inc. | 0.10 | 0.00 | 1.81 | -20.84 | 0.9512 | -0.1069 | |||
| SIGI / Selective Insurance Group, Inc. | 0.02 | -35.01 | 1.77 | -32.62 | 0.9301 | -0.2853 | |||
| KMPR / Kemper Corporation | 0.03 | 1.75 | 0.9190 | 0.9190 | |||||
| CWAN / Clearwater Analytics Holdings, Inc. | 0.08 | 0.00 | 1.73 | -19.26 | 0.9088 | -0.0822 | |||
| DIOD / Diodes Incorporated | 0.04 | 15.59 | 1.70 | -24.75 | 0.8923 | -0.1518 | |||
| KWR / Quaker Chemical Corporation | 0.02 | 0.00 | 1.65 | -24.99 | 0.8684 | -0.1506 | |||
| PRGS / Progress Software Corporation | 0.03 | 0.00 | 1.63 | 4.63 | 0.8535 | 0.1349 | |||
| JW.A / John Wiley & Sons Inc. - Class A | 0.04 | 0.00 | 1.60 | 6.60 | 0.8395 | 0.1462 | |||
| HXL / Hexcel Corporation | 0.03 | 0.00 | 1.57 | -25.65 | 0.8248 | -0.1522 | |||
| AMSF / AMERISAFE, Inc. | 0.03 | 0.00 | 1.50 | -7.07 | 0.7865 | 0.0413 | |||
| SPSC / SPS Commerce, Inc. | 0.01 | 0.00 | 1.40 | -22.29 | 0.7338 | -0.0977 | |||
| THM / Taylor Morrison Home Corporation | 0.02 | 1.38 | 0.7220 | 0.7220 | |||||
| CHEF / The Chefs' Warehouse, Inc. | 0.02 | 0.00 | 1.24 | 5.81 | 0.6504 | 0.1089 | |||
| CERT / Certara, Inc. | 0.08 | 189.15 | 1.11 | 181.93 | 0.5818 | 0.3999 | |||
| MTH / Meritage Homes Corporation | 0.01 | 0.00 | 0.95 | -12.48 | 0.5008 | -0.0032 | |||
| NOVT / Novanta Inc. | 0.01 | 66.59 | 0.87 | 32.37 | 0.4576 | 0.1530 | |||
| OLED / Universal Display Corporation | 0.01 | 0.00 | 0.82 | -16.26 | 0.4328 | -0.0220 | |||
| FRPT / Freshpet, Inc. | 0.01 | 0.77 | 0.4064 | 0.4064 | |||||
| TXRH / Texas Roadhouse, Inc. | 0.00 | 0.00 | 0.75 | -8.38 | 0.3959 | 0.0155 | |||
| JJSF / J&J Snack Foods Corp. | 0.01 | -54.29 | 0.70 | -56.87 | 0.3677 | -0.3824 | |||
| NCNO / nCino, Inc. | 0.03 | 0.00 | 0.66 | -31.81 | 0.3456 | -0.1005 | |||
| LANC / Lancaster Colony Corporation | 0.00 | -23.37 | 0.63 | -26.03 | 0.3297 | -0.0630 | |||
| RH / RH | 0.00 | 0.00 | 0.60 | -56.08 | 0.3165 | -0.3182 |