Mga Batayang Estadistika
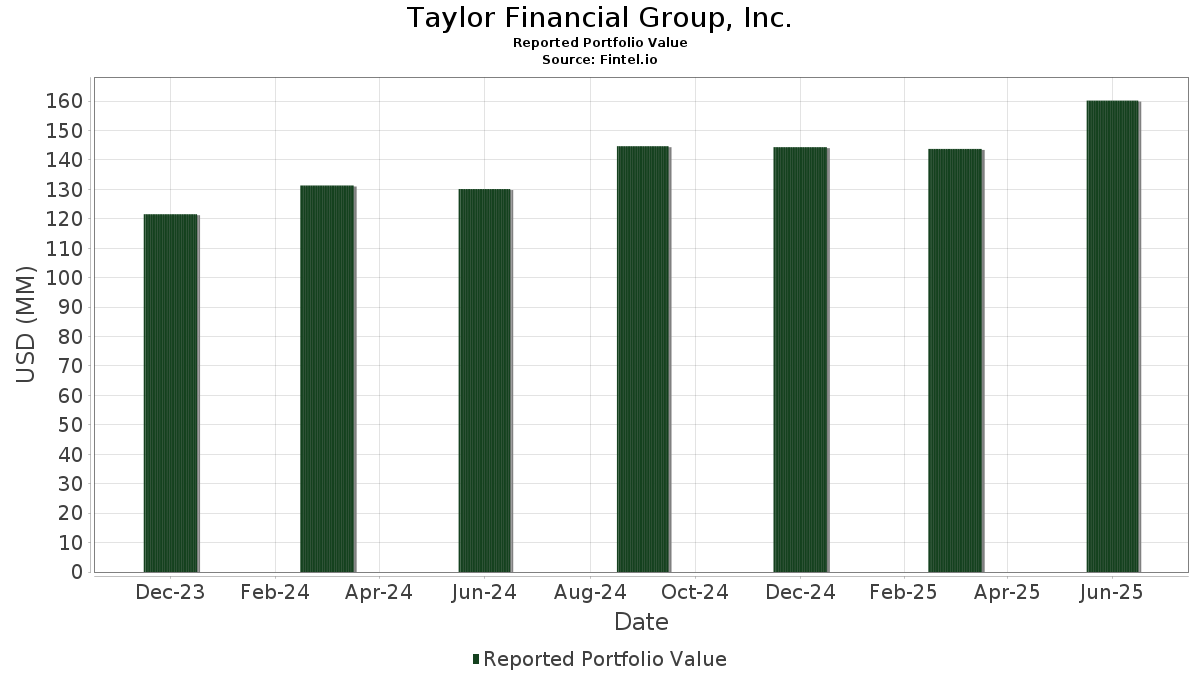
| Nilai Portofolio | $ 160,179,762 |
| Posisi Saat Ini | 104 |
Kepemilikan Terbaru, Kinerja, AUM (dari 13F, 13D)
Taylor Financial Group, Inc. telah mengungkapkan total kepemilikan 104 dalam pengajuan SEC terbaru mereka. Nilai portofolio terbaru dihitung sebesar $ 160,179,762 USD. Aset yang Dikelola (AUM) sebenarnya adalah nilai ini ditambah kas (yang tidak diungkapkan). Aset-aset utama Taylor Financial Group, Inc. adalah Vanguard Index Funds - Vanguard Growth ETF (US:VUG) , Norfolk Southern Corporation (US:NSC) , Fiserv, Inc. (US:FI) , Oracle Corporation (US:ORCL) , and Berkshire Hathaway Inc. (US:BRK.B) . Posisi baru Taylor Financial Group, Inc. meliputi: Broadcom Inc. (US:AVGO) , Corning Incorporated (US:GLW) , Uber Technologies, Inc. (US:UBER) , Bank of America Corporation (US:BAC) , and Milestone Pharmaceuticals Inc. (US:MIST) .
Peningkatan Tertinggi Kuartal Ini
Kami menggunakan perubahan dalam alokasi portofolio karena ini adalah metrik yang paling bermakna. Perubahan dapat disebabkan oleh perdagangan atau perubahan harga saham.
| Keamanan | Saham (MM) |
Nilai (Juta Dolar AS) |
Portfolio % | ΔPorsyento ng Portfolio |
|---|---|---|---|---|
| 0.06 | 27.47 | 17.1475 | 1.5912 | |
| 0.02 | 4.78 | 2.9820 | 0.8708 | |
| 0.01 | 3.78 | 2.3591 | 0.3570 | |
| 0.02 | 1.62 | 1.0090 | 0.2181 | |
| 0.01 | 0.97 | 0.6053 | 0.1955 | |
| 0.10 | 3.49 | 2.1789 | 0.1535 | |
| 0.00 | 0.24 | 0.1487 | 0.1487 | |
| 0.00 | 0.23 | 0.1458 | 0.1458 | |
| 0.00 | 0.23 | 0.1449 | 0.1449 | |
| 0.00 | 0.23 | 0.1424 | 0.1424 |
Penurunan Tertinggi Kuartal Ini
Kami menggunakan perubahan dalam alokasi portofolio karena ini adalah metrik yang paling bermakna. Perubahan dapat disebabkan oleh perdagangan atau perubahan harga saham.
| Keamanan | Saham (MM) |
Nilai (Juta Dolar AS) |
Portfolio % | ΔPorsyento ng Portfolio |
|---|---|---|---|---|
| 0.03 | 4.80 | 2.9990 | -1.2635 | |
| 0.01 | 4.66 | 2.9092 | -0.6447 | |
| 0.02 | 3.98 | 2.4853 | -0.4923 | |
| 0.08 | 21.55 | 13.4537 | -0.3752 | |
| 0.00 | 2.72 | 1.6999 | -0.2483 | |
| 0.01 | 1.19 | 0.7403 | -0.2423 | |
| 0.01 | 3.30 | 2.0584 | -0.2342 | |
| 0.01 | 1.77 | 1.1063 | -0.1968 | |
| 0.01 | 0.67 | 0.4181 | -0.1576 | |
| 0.00 | 0.61 | 0.3811 | -0.1451 |
Pengajuan 13F dan Dana
Formulir ini diajukan pada 2025-08-01 untuk periode pelaporan 2025-06-30. Klik ikon tautan untuk melihat riwayat transaksi selengkapnya.
Tingkatkan ke versi premium untuk membuka data premium dan ekspor ke Excel. ![]() .
.
| Keamanan | Ketik | Harga Saham Rata-rata | Saham (MM) |
ΔSaham (%) |
ΔSaham (%) |
Nilai ($MM) |
Portpolyo (%) |
ΔPortofolio (%) |
|
|---|---|---|---|---|---|---|---|---|---|
| VUG / Vanguard Index Funds - Vanguard Growth ETF | 0.06 | 3.89 | 27.47 | 22.82 | 17.1475 | 1.5912 | |||
| NSC / Norfolk Southern Corporation | 0.08 | 0.31 | 21.55 | 8.41 | 13.4537 | -0.3752 | |||
| FI / Fiserv, Inc. | 0.03 | 0.41 | 4.80 | -21.61 | 2.9990 | -1.2635 | |||
| ORCL / Oracle Corporation | 0.02 | 0.64 | 4.78 | 57.42 | 2.9820 | 0.8708 | |||
| BRK.B / Berkshire Hathaway Inc. | 0.01 | 0.00 | 4.66 | -8.81 | 2.9092 | -0.6447 | |||
| AAPL / Apple Inc. | 0.02 | 0.69 | 3.98 | -7.01 | 2.4853 | -0.4923 | |||
| MSFT / Microsoft Corporation | 0.01 | -0.91 | 3.78 | 31.27 | 2.3591 | 0.3570 | |||
| DIVB / iShares Trust - iShares Core Dividend ETF | 0.07 | 12.35 | 3.51 | 16.53 | 2.1923 | 0.0959 | |||
| DVY / iShares Trust - iShares Select Dividend ETF | 0.03 | 12.72 | 3.51 | 11.47 | 2.1906 | 0.0010 | |||
| CGBL / Capital Group Core Balanced ETF | 0.10 | 11.05 | 3.49 | 19.89 | 2.1789 | 0.1535 | |||
| HD / The Home Depot, Inc. | 0.01 | 0.00 | 3.30 | 0.06 | 2.0584 | -0.2342 | |||
| GAL / SSGA Active Trust - SPDR SSGA Global Allocation ETF | 0.07 | 12.92 | 3.27 | 18.41 | 2.0445 | 0.1205 | |||
| AOM / iShares Trust - iShares Core 40/60 Moderate Allocation ETF | 0.07 | 13.50 | 3.15 | 19.09 | 1.9676 | 0.1267 | |||
| LLY / Eli Lilly and Company | 0.00 | 3.01 | 2.72 | -2.79 | 1.6999 | -0.2483 | |||
| VTV / Vanguard Index Funds - Vanguard Value ETF | 0.01 | 12.92 | 2.58 | 15.53 | 1.6115 | 0.0573 | |||
| IJH / iShares Trust - iShares Core S&P Mid-Cap ETF | 0.04 | 8.88 | 2.48 | 15.76 | 1.5459 | 0.0574 | |||
| BX / Blackstone Inc. | 0.02 | 0.79 | 2.28 | 7.86 | 1.4232 | -0.0470 | |||
| IJT / iShares Trust - iShares S&P Small-Cap 600 Growth ETF | 0.02 | 4.99 | 2.27 | 12.23 | 1.4154 | 0.0096 | |||
| IJS / iShares Trust - iShares S&P Small-Cap 600 Value ETF | 0.02 | 1.79 | 2.07 | 3.86 | 1.2945 | -0.0940 | |||
| SPY / SPDR S&P 500 ETF | 0.00 | -0.51 | 1.83 | 9.87 | 1.1398 | -0.0159 | |||
| LOW / Lowe's Companies, Inc. | 0.01 | -0.56 | 1.77 | -5.39 | 1.1063 | -0.1968 | |||
| IVE / iShares Trust - iShares S&P 500 Value ETF | 0.01 | 3.31 | 1.71 | 5.96 | 1.0659 | -0.0552 | |||
| PH / Parker-Hannifin Corporation | 0.00 | -1.03 | 1.68 | 13.76 | 1.0478 | 0.0212 | |||
| MCHP / Microchip Technology Incorporated | 0.02 | -2.21 | 1.62 | 42.13 | 1.0090 | 0.2181 | |||
| T / AT&T Inc. | 0.06 | 0.00 | 1.59 | 2.31 | 0.9949 | -0.0884 | |||
| LMT / Lockheed Martin Corporation | 0.00 | 0.00 | 1.53 | 3.67 | 0.9539 | -0.0713 | |||
| QQQ / Invesco QQQ Trust, Series 1 | 0.00 | 2.16 | 1.51 | 20.22 | 0.9429 | 0.0687 | |||
| TFC / Truist Financial Corporation | 0.03 | 8.56 | 1.43 | 13.46 | 0.8947 | 0.0157 | |||
| MAR / Marriott International, Inc. | 0.00 | 0.00 | 1.35 | 14.66 | 0.8450 | 0.0241 | |||
| AMZN / Amazon.com, Inc. | 0.01 | 2.57 | 1.27 | 18.30 | 0.7915 | 0.0459 | |||
| JPM / JPMorgan Chase & Co. | 0.00 | 0.00 | 1.22 | 18.19 | 0.7587 | 0.0434 | |||
| IVW / iShares Trust - iShares S&P 500 Growth ETF | 0.01 | 0.00 | 1.20 | 18.67 | 0.7462 | 0.0452 | |||
| PEP / PepsiCo, Inc. | 0.01 | -4.67 | 1.19 | -16.08 | 0.7403 | -0.2423 | |||
| GE / General Electric Company | 0.00 | -2.95 | 1.14 | 24.92 | 0.7137 | 0.0765 | |||
| MDY / SPDR S&P MidCap 400 ETF Trust | 0.00 | -4.69 | 1.09 | 1.20 | 0.6822 | -0.0689 | |||
| NFLX / Netflix, Inc. | 0.00 | 0.00 | 1.01 | 43.65 | 0.6287 | 0.1409 | |||
| PLTR / Palantir Technologies Inc. | 0.01 | 1.89 | 0.97 | 64.52 | 0.6053 | 0.1955 | |||
| PAYX / Paychex, Inc. | 0.01 | 0.00 | 0.92 | -5.74 | 0.5749 | -0.1045 | |||
| PPG / PPG Industries, Inc. | 0.01 | -1.87 | 0.88 | 2.10 | 0.5477 | -0.0501 | |||
| SDY / SPDR Series Trust - SPDR S&P Dividend ETF | 0.01 | 0.00 | 0.82 | 0.00 | 0.5105 | -0.0581 | |||
| XOM / Exxon Mobil Corporation | 0.01 | 0.00 | 0.78 | -9.36 | 0.4899 | -0.1123 | |||
| QQQM / Invesco Exchange-Traded Fund Trust II - Invesco NASDAQ 100 ETF | 0.00 | 12.44 | 0.78 | 32.43 | 0.4870 | 0.0768 | |||
| MCD / McDonald's Corporation | 0.00 | 4.06 | 0.75 | -2.73 | 0.4676 | -0.0677 | |||
| GS / The Goldman Sachs Group, Inc. | 0.00 | 0.00 | 0.74 | 29.58 | 0.4595 | 0.0643 | |||
| VZ / Verizon Communications Inc. | 0.02 | 0.39 | 0.73 | -4.18 | 0.4578 | -0.0749 | |||
| ELV / Elevance Health, Inc. | 0.00 | 0.00 | 0.73 | -10.60 | 0.4529 | -0.1114 | |||
| CAT / Caterpillar Inc. | 0.00 | -1.44 | 0.69 | 15.97 | 0.4312 | 0.0171 | |||
| ATO / Atmos Energy Corporation | 0.00 | 0.00 | 0.69 | -0.29 | 0.4296 | -0.0505 | |||
| UPS / United Parcel Service, Inc. | 0.01 | -11.83 | 0.67 | -19.11 | 0.4181 | -0.1576 | |||
| TT / Trane Technologies plc | 0.00 | 0.00 | 0.66 | 29.86 | 0.4129 | 0.0585 | |||
| COST / Costco Wholesale Corporation | 0.00 | 1.25 | 0.64 | 5.94 | 0.4011 | -0.0206 | |||
| DIS / The Walt Disney Company | 0.01 | 0.00 | 0.64 | 25.74 | 0.3996 | 0.0452 | |||
| NVDA / NVIDIA Corporation | 0.00 | -32.20 | 0.63 | -1.25 | 0.3956 | -0.0504 | |||
| DHR / Danaher Corporation | 0.00 | -16.26 | 0.61 | -19.31 | 0.3811 | -0.1451 | |||
| GEV / GE Vernova Inc. | 0.00 | -3.07 | 0.58 | 67.82 | 0.3650 | 0.1229 | |||
| QCOM / QUALCOMM Incorporated | 0.00 | 0.00 | 0.56 | 3.71 | 0.3491 | -0.0261 | |||
| AEP / American Electric Power Company, Inc. | 0.01 | 1.90 | 0.56 | -3.30 | 0.3482 | -0.0528 | |||
| ROK / Rockwell Automation, Inc. | 0.00 | 0.00 | 0.55 | 28.71 | 0.3418 | 0.0455 | |||
| VBK / Vanguard Index Funds - Vanguard Small-Cap Growth ETF | 0.00 | 4.51 | 0.55 | 14.98 | 0.3408 | 0.0105 | |||
| CSX / CSX Corporation | 0.02 | -1.85 | 0.52 | 8.81 | 0.3243 | -0.0078 | |||
| FDX / FedEx Corporation | 0.00 | 73.02 | 0.51 | 61.20 | 0.3194 | 0.0988 | |||
| HON / Honeywell International Inc. | 0.00 | 0.00 | 0.50 | 9.96 | 0.3104 | -0.0041 | |||
| IVV / iShares Trust - iShares Core S&P 500 ETF | 0.00 | -2.80 | 0.49 | 7.39 | 0.3089 | -0.0116 | |||
| VOO / Vanguard Index Funds - Vanguard S&P 500 ETF | 0.00 | 0.00 | 0.49 | 10.56 | 0.3075 | -0.0025 | |||
| AUB / Atlantic Union Bankshares Corporation | 0.02 | -12.31 | 0.49 | -11.98 | 0.3033 | -0.0804 | |||
| STLD / Steel Dynamics, Inc. | 0.00 | 0.00 | 0.47 | 2.20 | 0.2908 | -0.0258 | |||
| GPC / Genuine Parts Company | 0.00 | 0.00 | 0.46 | 1.79 | 0.2846 | -0.0268 | |||
| PG / The Procter & Gamble Company | 0.00 | -1.04 | 0.46 | -7.52 | 0.2846 | -0.0582 | |||
| WMT / Walmart Inc. | 0.00 | 34.54 | 0.44 | 49.83 | 0.2723 | 0.0698 | |||
| APD / Air Products and Chemicals, Inc. | 0.00 | 0.00 | 0.40 | -4.49 | 0.2527 | -0.0417 | |||
| JNJ / Johnson & Johnson | 0.00 | 0.00 | 0.40 | -8.03 | 0.2509 | -0.0526 | |||
| META / Meta Platforms, Inc. | 0.00 | 0.00 | 0.40 | 28.06 | 0.2479 | 0.0322 | |||
| GOOG / Alphabet Inc. | 0.00 | 4.71 | 0.39 | 19.03 | 0.2464 | 0.0155 | |||
| RTX / RTX Corporation | 0.00 | 0.00 | 0.38 | 10.20 | 0.2362 | -0.0025 | |||
| KMB / Kimberly-Clark Corporation | 0.00 | 0.00 | 0.38 | -9.40 | 0.2351 | -0.0539 | |||
| FAST / Fastenal Company | 0.01 | 100.09 | 0.38 | 8.36 | 0.2349 | -0.0066 | |||
| MO / Altria Group, Inc. | 0.01 | -9.37 | 0.37 | -11.54 | 0.2301 | -0.0595 | |||
| IBM / International Business Machines Corporation | 0.00 | 0.00 | 0.37 | 18.77 | 0.2291 | 0.0138 | |||
| PFE / Pfizer Inc. | 0.01 | 25.61 | 0.33 | 20.14 | 0.2089 | 0.0152 | |||
| VGK / Vanguard International Equity Index Funds - Vanguard FTSE Europe ETF | 0.00 | 15.14 | 0.32 | 27.06 | 0.2024 | 0.0250 | |||
| ABT / Abbott Laboratories | 0.00 | 0.00 | 0.30 | 2.41 | 0.1863 | -0.0162 | |||
| ABBV / AbbVie Inc. | 0.00 | 0.00 | 0.29 | -11.42 | 0.1797 | -0.0463 | |||
| DE / Deere & Company | 0.00 | 0.00 | 0.28 | 8.63 | 0.1730 | -0.0049 | |||
| TXN / Texas Instruments Incorporated | 0.00 | 0.00 | 0.27 | 15.38 | 0.1690 | 0.0060 | |||
| MLM / Martin Marietta Materials, Inc. | 0.00 | 0.00 | 0.26 | 14.54 | 0.1628 | 0.0048 | |||
| PNC / The PNC Financial Services Group, Inc. | 0.00 | 0.00 | 0.25 | 6.38 | 0.1562 | -0.0079 | |||
| KO / The Coca-Cola Company | 0.00 | 0.00 | 0.25 | -1.19 | 0.1556 | -0.0199 | |||
| ENB / Enbridge Inc. | 0.01 | 0.00 | 0.24 | 2.09 | 0.1526 | -0.0136 | |||
| ADP / Automatic Data Processing, Inc. | 0.00 | 0.00 | 0.24 | 0.84 | 0.1500 | -0.0156 | |||
| TSLA / Tesla, Inc. | 0.00 | 0.24 | 0.1487 | 0.1487 | |||||
| DUK / Duke Energy Corporation | 0.00 | 0.00 | 0.24 | -3.25 | 0.1487 | -0.0226 | |||
| AVGO / Broadcom Inc. | 0.00 | 0.23 | 0.1458 | 0.1458 | |||||
| ETN / Eaton Corporation plc | 0.00 | 0.23 | 0.1449 | 0.1449 | |||||
| GLW / Corning Incorporated | 0.00 | 0.23 | 0.1424 | 0.1424 | |||||
| DOW / Dow Inc. | 0.01 | 41.15 | 0.23 | 7.08 | 0.1418 | -0.0058 | |||
| V / Visa Inc. | 0.00 | 0.00 | 0.22 | 1.37 | 0.1388 | -0.0139 | |||
| GOOGL / Alphabet Inc. | 0.00 | 0.22 | 0.1364 | 0.1364 | |||||
| CMI / Cummins Inc. | 0.00 | 0.00 | 0.21 | 4.39 | 0.1339 | -0.0089 | |||
| DRI / Darden Restaurants, Inc. | 0.00 | 0.00 | 0.21 | 4.95 | 0.1327 | -0.0082 | |||
| UBER / Uber Technologies, Inc. | 0.00 | 0.21 | 0.1325 | 0.1325 | |||||
| BAC / Bank of America Corporation | 0.00 | 0.21 | 0.1289 | 0.1289 | |||||
| MMM / 3M Company | 0.00 | 0.20 | 0.1275 | 0.1275 | |||||
| CADL / Candel Therapeutics, Inc. | 0.01 | 0.00 | 0.05 | -10.71 | 0.0316 | -0.0077 | |||
| MIST / Milestone Pharmaceuticals Inc. | 0.01 | 0.02 | 0.0121 | 0.0121 | |||||
| UNH / UnitedHealth Group Incorporated | 0.00 | -100.00 | 0.00 | 0.0000 | |||||
| INTC / Intel Corporation | 0.00 | -100.00 | 0.00 | 0.0000 |