Mga Batayang Estadistika
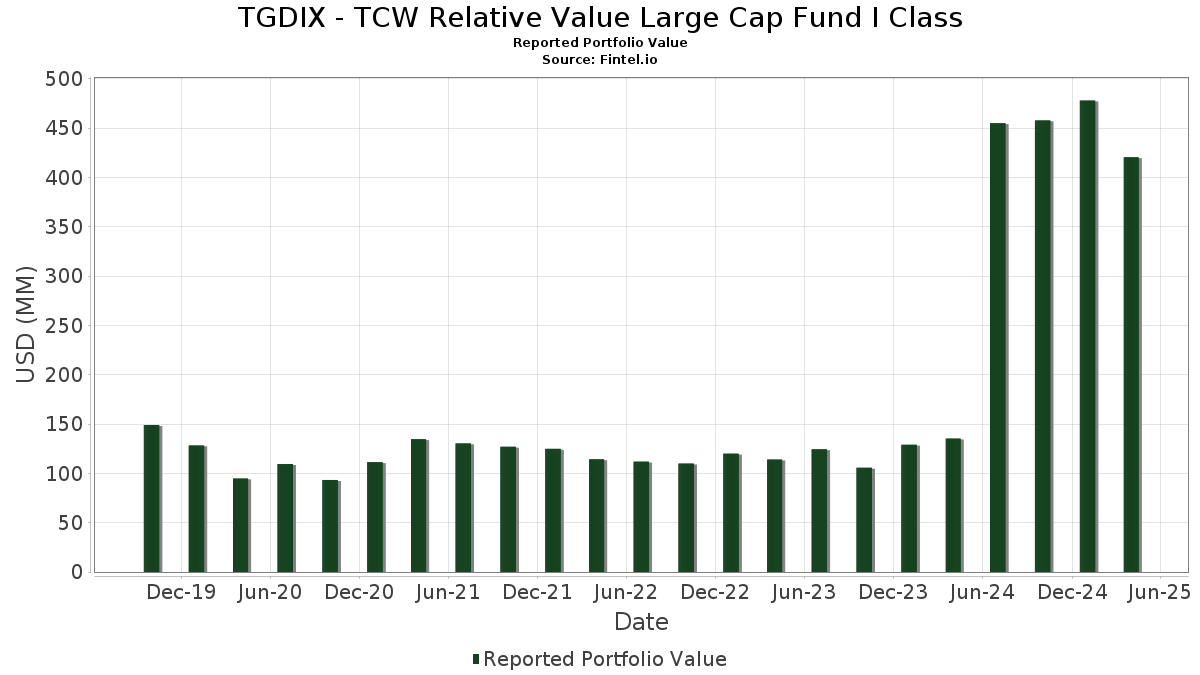
| Nilai Portofolio | $ 420,537,518 |
| Posisi Saat Ini | 49 |
Kepemilikan Terbaru, Kinerja, AUM (dari 13F, 13D)
TGDIX - TCW Relative Value Large Cap Fund I Class telah mengungkapkan total kepemilikan 49 dalam pengajuan SEC terbaru mereka. Nilai portofolio terbaru dihitung sebesar $ 420,537,518 USD. Aset yang Dikelola (AUM) sebenarnya adalah nilai ini ditambah kas (yang tidak diungkapkan). Aset-aset utama TGDIX - TCW Relative Value Large Cap Fund I Class adalah International Business Machines Corporation (US:IBM) , McKesson Corporation (US:MCK) , JPMorgan Chase & Co. (US:JPM) , Fiserv, Inc. (US:FI) , and Intercontinental Exchange, Inc. (US:ICE) . Posisi baru TGDIX - TCW Relative Value Large Cap Fund I Class meliputi: Texas Instruments Incorporated (US:TXN) , Intel Corporation (US:INTC) , Equitable Holdings, Inc. (US:EQH) , .
Peningkatan Tertinggi Kuartal Ini
Kami menggunakan perubahan dalam alokasi portofolio karena ini adalah metrik yang paling bermakna. Perubahan dapat disebabkan oleh perdagangan atau perubahan harga saham.
| Keamanan | Saham (MM) |
Nilai (Juta Dolar AS) |
Portfolio % | ΔPorsyento ng Portfolio |
|---|---|---|---|---|
| 0.04 | 6.83 | 1.6245 | 1.6245 | |
| 0.03 | 18.65 | 4.4351 | 1.4072 | |
| 0.09 | 16.68 | 3.9666 | 1.2461 | |
| 0.23 | 4.67 | 1.1113 | 1.1113 | |
| 0.04 | 6.41 | 1.5251 | 1.0465 | |
| 0.04 | 9.34 | 2.2197 | 0.9714 | |
| 0.08 | 3.82 | 0.9073 | 0.9073 | |
| 0.30 | 11.70 | 2.7821 | 0.8099 | |
| 0.12 | 8.49 | 2.0179 | 0.6938 | |
| 0.10 | 16.32 | 3.8807 | 0.6925 |
Penurunan Tertinggi Kuartal Ini
Kami menggunakan perubahan dalam alokasi portofolio karena ini adalah metrik yang paling bermakna. Perubahan dapat disebabkan oleh perdagangan atau perubahan harga saham.
| Keamanan | Saham (MM) |
Nilai (Juta Dolar AS) |
Portfolio % | ΔPorsyento ng Portfolio |
|---|---|---|---|---|
| 0.00 | 0.00 | -1.6266 | ||
| 0.07 | 6.15 | 1.4612 | -0.7395 | |
| 0.03 | 5.97 | 1.4199 | -0.5337 | |
| 0.24 | 8.48 | 2.0157 | -0.4678 | |
| 2.40 | 2.40 | 0.5706 | -0.4629 | |
| 0.05 | 1.91 | 0.4538 | -0.4303 | |
| 0.08 | 5.52 | 1.3131 | -0.3544 | |
| 0.03 | 6.99 | 1.6619 | -0.3454 | |
| 0.09 | 9.88 | 2.3485 | -0.3428 | |
| 0.09 | 9.25 | 2.2003 | -0.3230 |
Pengajuan 13F dan Dana
Formulir ini diajukan pada 2025-06-26 untuk periode pelaporan 2025-04-30. Klik ikon tautan untuk melihat riwayat transaksi selengkapnya.
Tingkatkan ke versi premium untuk membuka data premium dan ekspor ke Excel. ![]() .
.
| Keamanan | Ketik | Harga Saham Rata-rata | Saham (MM) |
ΔSaham (%) |
ΔSaham (%) |
Nilai ($MM) |
Portpolyo (%) |
ΔPortofolio (%) |
|
|---|---|---|---|---|---|---|---|---|---|
| IBM / International Business Machines Corporation | 0.08 | -9.74 | 20.00 | -14.64 | 4.7551 | -0.1867 | |||
| MCK / McKesson Corporation | 0.03 | 8.42 | 18.65 | 29.95 | 4.4351 | 1.4072 | |||
| JPM / JPMorgan Chase & Co. | 0.08 | -4.05 | 18.41 | -12.19 | 4.3780 | -0.0450 | |||
| FI / Fiserv, Inc. | 0.09 | 51.40 | 16.68 | 29.35 | 3.9666 | 1.2461 | |||
| ICE / Intercontinental Exchange, Inc. | 0.10 | 2.75 | 16.32 | 7.99 | 3.8807 | 0.6925 | |||
| BK / The Bank of New York Mellon Corporation | 0.17 | 0.00 | 13.92 | -6.42 | 3.3093 | 0.1719 | |||
| GE / General Electric Company | 0.07 | -10.34 | 13.79 | -11.24 | 3.2794 | 0.0018 | |||
| ABBV / AbbVie Inc. | 0.06 | 2.29 | 11.70 | 8.52 | 2.7822 | 0.5077 | |||
| NI / NiSource Inc. | 0.30 | 19.35 | 11.70 | 25.13 | 2.7821 | 0.8099 | |||
| JCI / Johnson Controls International plc | 0.14 | 0.00 | 11.39 | 7.57 | 2.7078 | 0.4745 | |||
| DIS / The Walt Disney Company | 0.12 | 9.34 | 10.89 | -12.04 | 2.5904 | -0.0222 | |||
| XOM / Exxon Mobil Corporation | 0.10 | 8.48 | 10.74 | 7.26 | 2.5545 | 0.4417 | |||
| PEP / PepsiCo, Inc. | 0.08 | 0.00 | 10.19 | -10.03 | 2.4219 | 0.0339 | |||
| MET / MetLife, Inc. | 0.13 | 3.76 | 10.04 | -9.60 | 2.3873 | 0.0446 | |||
| MS / Morgan Stanley | 0.09 | -7.15 | 9.88 | -22.59 | 2.3485 | -0.3428 | |||
| JLL / Jones Lang LaSalle Incorporated | 0.04 | 96.17 | 9.34 | 57.74 | 2.2197 | 0.9714 | |||
| LEN / Lennar Corporation | 0.09 | -6.52 | 9.25 | -22.65 | 2.2003 | -0.3230 | |||
| FLEX / Flex Ltd. | 0.26 | 14.65 | 8.89 | -5.46 | 2.1146 | 0.1301 | |||
| T / AT&T Inc. | 0.31 | 0.00 | 8.65 | 16.73 | 2.0570 | 0.4937 | |||
| TPR / Tapestry, Inc. | 0.12 | 39.58 | 8.49 | 35.19 | 2.0179 | 0.6938 | |||
| BKR / Baker Hughes Company | 0.24 | -6.07 | 8.48 | -28.00 | 2.0157 | -0.4678 | |||
| SPG / Simon Property Group, Inc. | 0.05 | 0.00 | 8.36 | -9.47 | 1.9881 | 0.0397 | |||
| APO / Apollo Global Management, Inc. | 0.06 | 13.60 | 8.32 | -9.32 | 1.9781 | 0.0429 | |||
| AMGN / Amgen Inc. | 0.03 | -9.35 | 8.28 | -7.60 | 1.9695 | 0.0785 | |||
| GEHC / GE HealthCare Technologies Inc. | 0.12 | 23.39 | 8.21 | -1.72 | 1.9511 | 0.1898 | |||
| AMP / Ameriprise Financial, Inc. | 0.02 | 0.00 | 8.08 | -13.31 | 1.9205 | -0.0449 | |||
| WFC / Wells Fargo & Company | 0.11 | 0.00 | 8.07 | -9.89 | 1.9194 | 0.0298 | |||
| GM / General Motors Company | 0.17 | 0.00 | 7.84 | -8.53 | 1.8638 | 0.0561 | |||
| CMCSA / Comcast Corporation | 0.22 | 0.00 | 7.52 | 1.61 | 1.7874 | 0.2268 | |||
| XYL / Xylem Inc. | 0.06 | 0.00 | 7.13 | -2.79 | 1.6954 | 0.1481 | |||
| GEV / GE Vernova Inc. | 0.02 | -5.74 | 7.07 | -6.25 | 1.6820 | 0.0901 | |||
| CRM / Salesforce, Inc. | 0.03 | -6.60 | 6.99 | -26.56 | 1.6619 | -0.3454 | |||
| TXN / Texas Instruments Incorporated | 0.04 | 6.83 | 1.6245 | 1.6245 | |||||
| PG / The Procter & Gamble Company | 0.04 | 188.64 | 6.41 | 182.80 | 1.5251 | 1.0465 | |||
| NTAP / NetApp, Inc. | 0.07 | -19.86 | 6.15 | -41.09 | 1.4612 | -0.7395 | |||
| DKS / DICK'S Sporting Goods, Inc. | 0.03 | -17.56 | 5.97 | -35.53 | 1.4199 | -0.5337 | |||
| TXT / Textron Inc. | 0.08 | 0.00 | 5.55 | -8.03 | 1.3207 | 0.0468 | |||
| DD / DuPont de Nemours, Inc. | 0.08 | -18.70 | 5.52 | -30.15 | 1.3131 | -0.3544 | |||
| MDT / Medtronic plc | 0.06 | 444.36 | 5.15 | 428.34 | 1.2236 | 0.3388 | |||
| UNH / UnitedHealth Group Incorporated | 0.01 | 26.06 | 4.68 | -4.39 | 1.1131 | 0.0802 | |||
| INTC / Intel Corporation | 0.23 | 4.67 | 1.1113 | 1.1113 | |||||
| STX / Seagate Technology Holdings plc | 0.05 | -26.13 | 4.63 | -30.21 | 1.0998 | -0.2983 | |||
| UPS / United Parcel Service, Inc. | 0.04 | -12.20 | 4.00 | -26.74 | 0.9511 | -0.2008 | |||
| BBY / Best Buy Co., Inc. | 0.06 | -14.42 | 3.96 | -33.52 | 0.9407 | -0.3147 | |||
| EQH / Equitable Holdings, Inc. | 0.08 | 3.82 | 0.9073 | 0.9073 | |||||
| MRK / Merck & Co., Inc. | 0.04 | 0.13 | 3.26 | -13.68 | 0.7743 | -0.0214 | |||
| TCW Central Cash Fund / EC (US8723656711) | 2.40 | -51.02 | 2.40 | -51.02 | 0.5706 | -0.4629 | |||
| FCX / Freeport-McMoRan Inc. | 0.05 | -54.69 | 1.91 | -54.47 | 0.4538 | -0.4303 | |||
| GVMXX / State Street Institutional Investment Trust - State Street Institutional US Govt Money Market Fnd Premier Cls | 1.18 | 33.59 | 1.18 | 33.60 | 0.2800 | 0.0940 | |||
| NVS / Novartis AG - Depositary Receipt (Common Stock) | 0.00 | -100.00 | 0.00 | -100.00 | -1.6266 |