Mga Batayang Estadistika
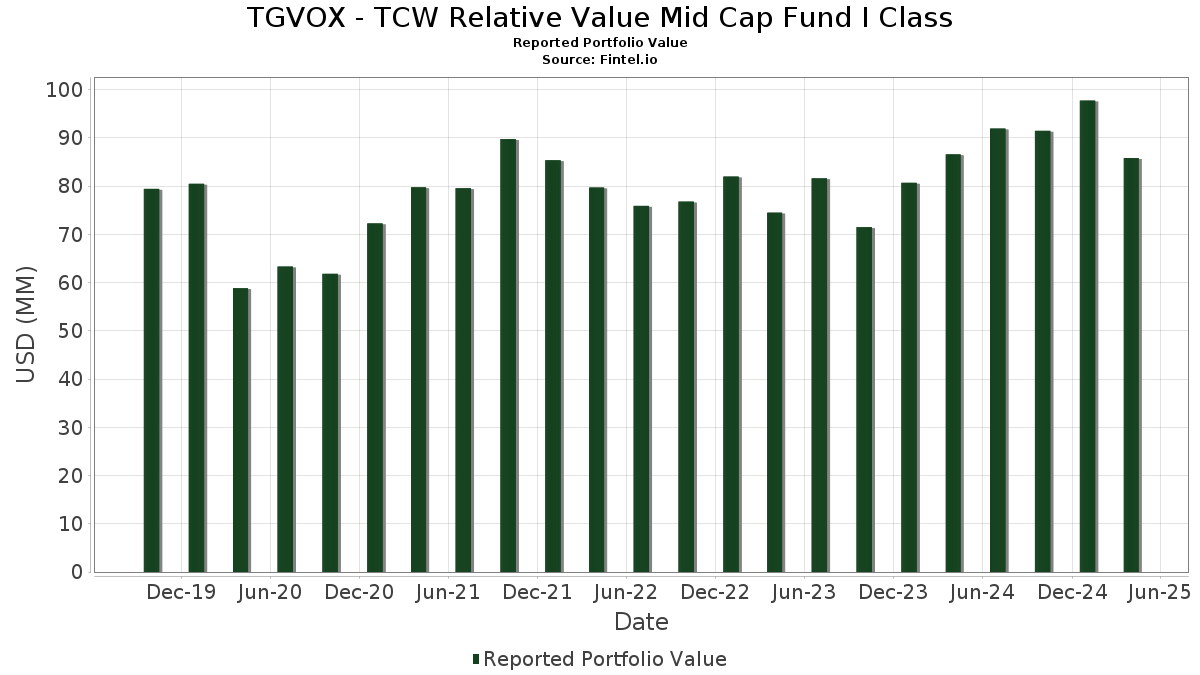
| Nilai Portofolio | $ 85,831,134 |
| Posisi Saat Ini | 60 |
Kepemilikan Terbaru, Kinerja, AUM (dari 13F, 13D)
TGVOX - TCW Relative Value Mid Cap Fund I Class telah mengungkapkan total kepemilikan 60 dalam pengajuan SEC terbaru mereka. Nilai portofolio terbaru dihitung sebesar $ 85,831,134 USD. Aset yang Dikelola (AUM) sebenarnya adalah nilai ini ditambah kas (yang tidak diungkapkan). Aset-aset utama TGVOX - TCW Relative Value Mid Cap Fund I Class adalah Equitable Holdings, Inc. (US:EQH) , Popular, Inc. (US:BPOP) , Arch Capital Group Ltd. (US:ACGL) , Jones Lang LaSalle Incorporated (US:JLL) , and Corpay, Inc. (US:FLT) . Posisi baru TGVOX - TCW Relative Value Mid Cap Fund I Class meliputi: RenaissanceRe Holdings Ltd. (US:RNR) , Advance Auto Parts, Inc. (GB:0H9G) , .
Peningkatan Tertinggi Kuartal Ini
Kami menggunakan perubahan dalam alokasi portofolio karena ini adalah metrik yang paling bermakna. Perubahan dapat disebabkan oleh perdagangan atau perubahan harga saham.
| Keamanan | Saham (MM) |
Nilai (Juta Dolar AS) |
Portfolio % | ΔPorsyento ng Portfolio |
|---|---|---|---|---|
| 2.21 | 2.21 | 2.5774 | 1.6353 | |
| 0.02 | 2.71 | 3.1650 | 1.5207 | |
| 0.01 | 1.56 | 1.8231 | 1.1032 | |
| 0.03 | 2.29 | 2.6764 | 0.9192 | |
| 0.00 | 0.75 | 0.8795 | 0.8795 | |
| 0.07 | 2.66 | 3.0992 | 0.5641 | |
| 0.01 | 0.41 | 0.4791 | 0.4791 | |
| 0.02 | 1.79 | 2.0821 | 0.4051 | |
| 0.02 | 1.48 | 1.7306 | 0.3875 | |
| 0.01 | 0.57 | 0.6677 | 0.3152 |
Penurunan Tertinggi Kuartal Ini
Kami menggunakan perubahan dalam alokasi portofolio karena ini adalah metrik yang paling bermakna. Perubahan dapat disebabkan oleh perdagangan atau perubahan harga saham.
| Keamanan | Saham (MM) |
Nilai (Juta Dolar AS) |
Portfolio % | ΔPorsyento ng Portfolio |
|---|---|---|---|---|
| 0.06 | 2.10 | 2.4523 | -1.3249 | |
| 0.02 | 2.33 | 2.7176 | -0.6575 | |
| 0.01 | 0.49 | 0.5732 | -0.6108 | |
| 0.01 | 1.25 | 1.4554 | -0.5280 | |
| 0.05 | 1.70 | 1.9844 | -0.4738 | |
| 0.01 | 0.38 | 0.4455 | -0.4350 | |
| 0.02 | 1.10 | 1.2814 | -0.4082 | |
| 0.00 | 0.00 | -0.3669 | ||
| 0.01 | 2.22 | 2.5906 | -0.3655 | |
| 0.01 | 1.13 | 1.3190 | -0.3190 |
Pengajuan 13F dan Dana
Formulir ini diajukan pada 2025-06-26 untuk periode pelaporan 2025-04-30. Klik ikon tautan untuk melihat riwayat transaksi selengkapnya.
Tingkatkan ke versi premium untuk membuka data premium dan ekspor ke Excel. ![]() .
.
| Keamanan | Ketik | Harga Saham Rata-rata | Saham (MM) |
ΔSaham (%) |
ΔSaham (%) |
Nilai ($MM) |
Portpolyo (%) |
ΔPortofolio (%) |
|
|---|---|---|---|---|---|---|---|---|---|
| EQH / Equitable Holdings, Inc. | 0.07 | -5.26 | 3.60 | -13.92 | 4.1990 | -0.0839 | |||
| BPOP / Popular, Inc. | 0.04 | -8.79 | 3.58 | -15.46 | 4.1789 | -0.1614 | |||
| ACGL / Arch Capital Group Ltd. | 0.03 | -6.31 | 3.12 | -8.71 | 3.6436 | 0.1388 | |||
| JLL / Jones Lang LaSalle Incorporated | 0.01 | 3.26 | 3.04 | -16.99 | 3.5407 | -0.2033 | |||
| FLT / Corpay, Inc. | 0.01 | -4.07 | 2.99 | -17.97 | 3.4869 | -0.2455 | |||
| SFM / Sprouts Farmers Market, Inc. | 0.02 | 56.51 | 2.71 | 69.03 | 3.1650 | 1.5207 | |||
| NI / NiSource Inc. | 0.07 | 2.38 | 2.66 | 7.35 | 3.0992 | 0.5641 | |||
| WAB / Westinghouse Air Brake Technologies Corporation | 0.01 | -8.12 | 2.63 | -18.38 | 3.0726 | -0.2322 | |||
| TOL / Toll Brothers, Inc. | 0.02 | -4.81 | 2.33 | -29.29 | 2.7176 | -0.6575 | |||
| EBAY / eBay Inc. | 0.03 | 32.41 | 2.29 | 33.76 | 2.6764 | 0.9192 | |||
| ARES / Ares Management Corporation | 0.01 | 0.00 | 2.22 | -23.04 | 2.5906 | -0.3655 | |||
| TCW Central Cash Fund / EC (US8723656711) | 2.21 | 140.22 | 2.21 | 140.22 | 2.5774 | 1.6353 | |||
| ACA / Arcosa, Inc. | 0.03 | 4.02 | 2.16 | -17.77 | 2.5149 | -0.1710 | |||
| WELL / Welltower Inc. | 0.01 | -16.57 | 2.14 | -6.73 | 2.4907 | 0.1462 | |||
| FLEX / Flex Ltd. | 0.06 | -30.86 | 2.10 | -43.00 | 2.4523 | -1.3249 | |||
| TPR / Tapestry, Inc. | 0.03 | -4.50 | 2.01 | -7.53 | 2.3496 | 0.1191 | |||
| SRE / Sempra | 0.02 | 21.73 | 1.79 | 9.04 | 2.0821 | 0.4051 | |||
| WAL / Western Alliance Bancorporation | 0.02 | 0.00 | 1.73 | -20.68 | 2.0228 | -0.2161 | |||
| BKR / Baker Hughes Company | 0.05 | -7.53 | 1.70 | -29.12 | 1.9844 | -0.4738 | |||
| IBKR / Interactive Brokers Group, Inc. | 0.01 | -2.43 | 1.61 | -22.90 | 1.8735 | -0.2599 | |||
| TXT / Textron Inc. | 0.02 | -9.06 | 1.59 | -16.38 | 1.8589 | -0.0926 | |||
| DGX / Quest Diagnostics Incorporated | 0.01 | 103.50 | 1.56 | 122.65 | 1.8231 | 1.1032 | |||
| CTVA / Corteva, Inc. | 0.02 | 19.13 | 1.48 | 13.12 | 1.7306 | 0.3875 | |||
| CURB / Curbline Properties Corp. | 0.06 | 0.00 | 1.46 | -6.46 | 1.7058 | 0.1046 | |||
| CHRW / C.H. Robinson Worldwide, Inc. | 0.02 | 9.03 | 1.46 | -2.27 | 1.7048 | 0.1738 | |||
| AVT / Avnet, Inc. | 0.03 | 0.00 | 1.45 | -9.06 | 1.6862 | 0.0584 | |||
| OMF / OneMain Holdings, Inc. | 0.03 | 0.00 | 1.43 | -15.25 | 1.6655 | -0.0601 | |||
| KEX / Kirby Corporation | 0.01 | 0.00 | 1.36 | -11.72 | 1.5909 | 0.0087 | |||
| FDX / FedEx Corporation | 0.01 | -18.86 | 1.25 | -35.59 | 1.4554 | -0.5280 | |||
| HSIC / Henry Schein, Inc. | 0.02 | 31.98 | 1.21 | 7.19 | 1.4091 | 0.2547 | |||
| CNC / Centene Corporation | 0.02 | 13.87 | 1.17 | 6.39 | 1.3594 | 0.2380 | |||
| TNL / Travel + Leisure Co. | 0.03 | 8.16 | 1.13 | -12.58 | 1.3215 | -0.0060 | |||
| DKS / DICK'S Sporting Goods, Inc. | 0.01 | -9.59 | 1.13 | -29.33 | 1.3190 | -0.3190 | |||
| DD / DuPont de Nemours, Inc. | 0.02 | -22.50 | 1.10 | -33.41 | 1.2814 | -0.4082 | |||
| J / Jacobs Solutions Inc. | 0.01 | -14.35 | 1.10 | -24.33 | 1.2775 | -0.2050 | |||
| TEVA / Teva Pharmaceutical Industries Limited - Depositary Receipt (Common Stock) | 0.07 | 0.00 | 1.06 | -12.55 | 1.2360 | -0.0046 | |||
| RRC / Range Resources Corporation | 0.03 | 26.88 | 1.05 | 16.32 | 1.2223 | 0.2988 | |||
| STX / Seagate Technology Holdings plc | 0.01 | -20.48 | 1.05 | -24.89 | 1.2215 | -0.2064 | |||
| FTI / TechnipFMC plc | 0.04 | 11.91 | 0.99 | 4.88 | 1.1533 | 0.1880 | |||
| ADI / Analog Devices, Inc. | 0.01 | 28.88 | 0.98 | 18.55 | 1.1485 | 0.2979 | |||
| LEN / Lennar Corporation | 0.01 | 0.00 | 0.93 | -17.31 | 1.0822 | -0.0661 | |||
| FCNCA / First Citizens BancShares, Inc. | 0.00 | 0.00 | 0.87 | -19.35 | 1.0167 | -0.0896 | |||
| OMC / Omnicom Group Inc. | 0.01 | 0.00 | 0.87 | -12.30 | 1.0152 | -0.0006 | |||
| GAP / The Gap, Inc. | 0.04 | 0.00 | 0.86 | -9.01 | 1.0009 | 0.0349 | |||
| COP / ConocoPhillips | 0.01 | 0.00 | 0.85 | -9.75 | 0.9937 | 0.0261 | |||
| AGO / Assured Guaranty Ltd. | 0.01 | 0.00 | 0.85 | -7.20 | 0.9927 | 0.0528 | |||
| MPC / Marathon Petroleum Corporation | 0.01 | 0.00 | 0.77 | -5.66 | 0.8952 | 0.0617 | |||
| RNR / RenaissanceRe Holdings Ltd. | 0.00 | 0.75 | 0.8795 | 0.8795 | |||||
| IPG / The Interpublic Group of Companies, Inc. | 0.03 | 0.00 | 0.75 | -12.35 | 0.8773 | -0.0019 | |||
| EXE / Expand Energy Corporation | 0.01 | 17.96 | 0.74 | 20.55 | 0.8626 | 0.2347 | |||
| DRI / Darden Restaurants, Inc. | 0.00 | 6.75 | 0.63 | 9.65 | 0.7294 | 0.1456 | |||
| WSM / Williams-Sonoma, Inc. | 0.00 | 0.00 | 0.60 | -26.95 | 0.6992 | -0.1409 | |||
| CRH / CRH plc | 0.01 | 72.61 | 0.57 | 66.28 | 0.6677 | 0.3152 | |||
| DLTR / Dollar Tree, Inc. | 0.01 | -42.33 | 0.49 | -54.83 | 0.5732 | -0.6108 | |||
| 0H9G / Advance Auto Parts, Inc. | 0.01 | 0.41 | 0.4791 | 0.4791 | |||||
| FCX / Freeport-McMoRan Inc. | 0.01 | -55.79 | 0.38 | -55.53 | 0.4455 | -0.4350 | |||
| MTW / The Manitowoc Company, Inc. | 0.04 | 48.60 | 0.35 | 17.35 | 0.4028 | 0.1011 | |||
| GVMXX / State Street Institutional Investment Trust - State Street Institutional US Govt Money Market Fnd Premier Cls | 0.30 | 62.74 | 0.30 | 62.98 | 0.3445 | 0.1586 | |||
| AGCO / AGCO Corporation | 0.00 | 0.00 | 0.17 | -18.75 | 0.1973 | -0.0160 | |||
| GVMXX / State Street Institutional Investment Trust - State Street Institutional US Govt Money Market Fnd Premier Cls | 0.05 | -83.32 | 0.05 | -83.39 | 0.0575 | -0.2871 | |||
| ASO / Academy Sports and Outdoors, Inc. | 0.00 | -100.00 | 0.00 | -100.00 | -0.3669 |