Mga Batayang Estadistika
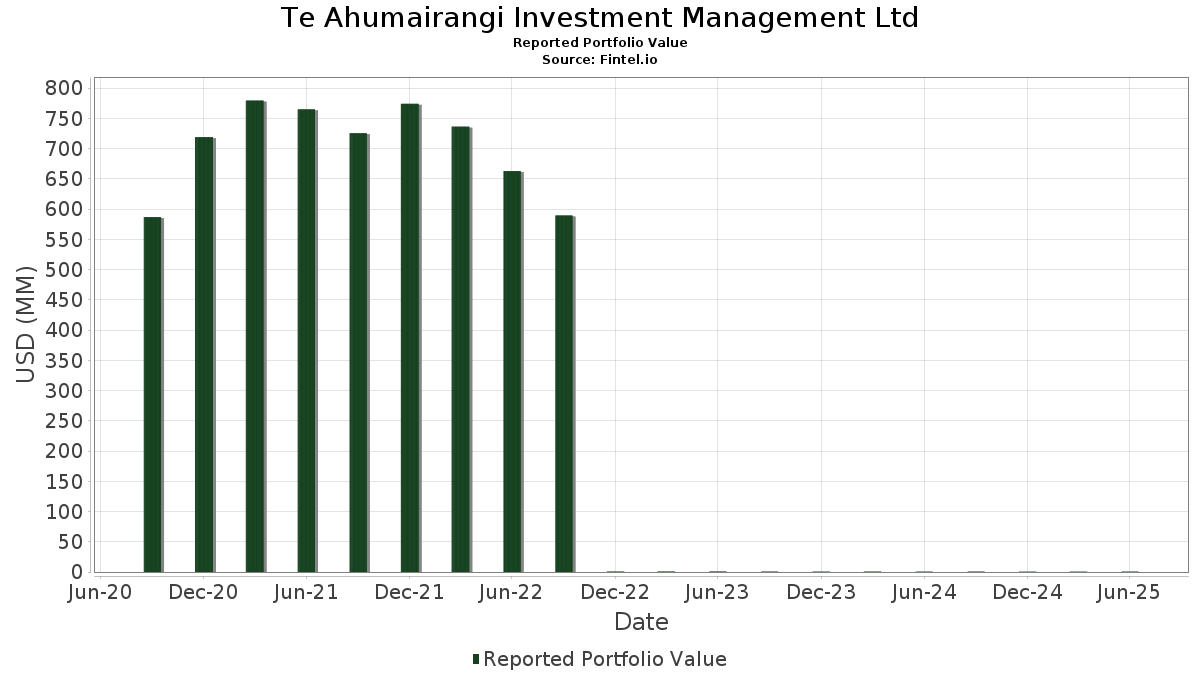
| Nilai Portofolio | $ 558,627 |
| Posisi Saat Ini | 87 |
Kepemilikan Terbaru, Kinerja, AUM (dari 13F, 13D)
Te Ahumairangi Investment Management Ltd telah mengungkapkan total kepemilikan 87 dalam pengajuan SEC terbaru mereka. Nilai portofolio terbaru dihitung sebesar $ 558,627 USD. Aset yang Dikelola (AUM) sebenarnya adalah nilai ini ditambah kas (yang tidak diungkapkan). Aset-aset utama Te Ahumairangi Investment Management Ltd adalah Microsoft Corporation (US:MSFT) , Verizon Communications Inc. (US:VZ) , Apple Inc. (US:AAPL) , Alphabet Inc. (US:GOOGL) , and Everest Group, Ltd. (US:EG) . Posisi baru Te Ahumairangi Investment Management Ltd meliputi: Crown Castle Inc. (US:CCI) , .
Peningkatan Tertinggi Kuartal Ini
Kami menggunakan perubahan dalam alokasi portofolio karena ini adalah metrik yang paling bermakna. Perubahan dapat disebabkan oleh perdagangan atau perubahan harga saham.
| Keamanan | Saham (MM) |
Nilai (Juta Dolar AS) |
Portfolio % | ΔPorsyento ng Portfolio |
|---|---|---|---|---|
| 0.09 | 0.05 | 8.2739 | 0.8221 | |
| 0.15 | 0.03 | 4.5907 | 0.6346 | |
| 0.01 | 0.00 | 0.5755 | 0.5755 | |
| 0.04 | 0.01 | 1.0456 | 0.4461 | |
| 0.02 | 0.01 | 2.3946 | 0.4447 | |
| 0.02 | 0.00 | 0.4248 | 0.4248 | |
| 0.01 | 0.00 | 0.5347 | 0.3451 | |
| 0.02 | 0.00 | 0.8945 | 0.2844 | |
| 0.00 | 0.00 | 0.5864 | 0.2301 | |
| 0.02 | 0.00 | 0.3870 | 0.2179 |
Penurunan Tertinggi Kuartal Ini
Kami menggunakan perubahan dalam alokasi portofolio karena ini adalah metrik yang paling bermakna. Perubahan dapat disebabkan oleh perdagangan atau perubahan harga saham.
| Keamanan | Saham (MM) |
Nilai (Juta Dolar AS) |
Portfolio % | ΔPorsyento ng Portfolio |
|---|---|---|---|---|
| 0.04 | 0.00 | 0.7332 | -0.4623 | |
| 0.01 | 0.00 | 0.4771 | -0.4585 | |
| 0.11 | 0.01 | 1.5547 | -0.3150 | |
| 0.01 | 0.00 | 0.4191 | -0.3098 | |
| 0.19 | 0.00 | 0.8646 | -0.2507 | |
| 0.04 | 0.00 | 0.6797 | -0.2358 | |
| 0.04 | 0.01 | 2.5305 | -0.2321 | |
| 0.05 | 0.01 | 1.3304 | -0.2312 | |
| 0.40 | 0.01 | 2.0715 | -0.2204 | |
| 0.05 | 0.01 | 2.0892 | -0.2137 |
Pengajuan 13F dan Dana
Formulir ini diajukan pada 2025-08-13 untuk periode pelaporan 2025-06-30. Klik ikon tautan untuk melihat riwayat transaksi selengkapnya.
Tingkatkan ke versi premium untuk membuka data premium dan ekspor ke Excel. ![]() .
.
| Keamanan | Ketik | Harga Saham Rata-rata | Saham (MM) |
ΔSaham (%) |
ΔSaham (%) |
Nilai ($MM) |
Portpolyo (%) |
ΔPortofolio (%) |
|
|---|---|---|---|---|---|---|---|---|---|
| MSFT / Microsoft Corporation | 0.09 | -0.94 | 0.05 | 31.43 | 8.2739 | 0.8221 | |||
| VZ / Verizon Communications Inc. | 0.80 | 21.05 | 0.03 | 13.33 | 6.2020 | -0.1474 | |||
| AAPL / Apple Inc. | 0.13 | 29.14 | 0.03 | 22.73 | 4.8943 | 0.0434 | |||
| GOOGL / Alphabet Inc. | 0.15 | 20.37 | 0.03 | 38.89 | 4.5907 | 0.6346 | |||
| EG / Everest Group, Ltd. | 0.04 | 15.77 | 0.01 | 7.69 | 2.5305 | -0.2321 | |||
| VRSN / VeriSign, Inc. | 0.05 | -2.63 | 0.01 | 8.33 | 2.4428 | -0.1642 | |||
| META / Meta Platforms, Inc. | 0.02 | 13.37 | 0.01 | 44.44 | 2.3946 | 0.4447 | |||
| CHKP / Check Point Software Technologies Ltd. | 0.05 | 10.48 | 0.01 | 10.00 | 2.0892 | -0.2137 | |||
| T / AT&T Inc. | 0.40 | 4.41 | 0.01 | 10.00 | 2.0715 | -0.2204 | |||
| CSCO / Cisco Systems, Inc. | 0.17 | 17.00 | 0.01 | 37.50 | 2.0710 | 0.2097 | |||
| C / Citigroup Inc. | 0.13 | 1.20 | 0.01 | 22.22 | 2.0502 | 0.0527 | |||
| V / Visa Inc. | 0.03 | 14.08 | 0.01 | 22.22 | 1.9781 | -0.0453 | |||
| GWW / W.W. Grainger, Inc. | 0.01 | 18.58 | 0.01 | 25.00 | 1.8656 | 0.0994 | |||
| KR / The Kroger Co. | 0.13 | 7.47 | 0.01 | 12.50 | 1.6349 | -0.0623 | |||
| MRK / Merck & Co., Inc. | 0.11 | 11.47 | 0.01 | 0.00 | 1.5547 | -0.3150 | |||
| DVA / DaVita Inc. | 0.06 | 39.09 | 0.01 | 33.33 | 1.5010 | 0.1311 | |||
| JNJ / Johnson & Johnson | 0.05 | 18.69 | 0.01 | 14.29 | 1.4994 | -0.1221 | |||
| AVGO / Broadcom Inc. | 0.03 | -16.07 | 0.01 | 40.00 | 1.3803 | 0.1993 | |||
| STLA / Stellantis N.V. | 0.74 | 40.84 | 0.01 | 40.00 | 1.3460 | 0.1122 | |||
| PG / The Procter & Gamble Company | 0.05 | 7.74 | 0.01 | 0.00 | 1.3304 | -0.2312 | |||
| HCA / HCA Healthcare, Inc. | 0.02 | -1.38 | 0.01 | 16.67 | 1.3130 | -0.1068 | |||
| DGX / Quest Diagnostics Incorporated | 0.04 | 2.42 | 0.01 | 16.67 | 1.2862 | -0.1122 | |||
| AMZN / Amazon.com, Inc. | 0.03 | 12.36 | 0.01 | 40.00 | 1.2710 | 0.1113 | |||
| TRV / The Travelers Companies, Inc. | 0.03 | 4.86 | 0.01 | 0.00 | 1.2422 | -0.1423 | |||
| ED / Consolidated Edison, Inc. | 0.07 | 16.16 | 0.01 | 0.00 | 1.1992 | -0.1459 | |||
| GILD / Gilead Sciences, Inc. | 0.06 | 19.34 | 0.01 | 20.00 | 1.1784 | -0.0014 | |||
| ELV / Elevance Health, Inc. | 0.02 | 42.48 | 0.01 | 50.00 | 1.1279 | 0.0815 | |||
| LH / Labcorp Holdings Inc. | 0.02 | 6.10 | 0.01 | 20.00 | 1.0837 | 0.0131 | |||
| PFE / Pfizer Inc. | 0.25 | 16.16 | 0.01 | 20.00 | 1.0807 | -0.0691 | |||
| CI / The Cigna Group | 0.02 | 0.53 | 0.01 | 0.00 | 1.0725 | -0.1827 | |||
| NVDA / NVIDIA Corporation | 0.04 | 41.41 | 0.01 | 150.00 | 1.0456 | 0.4461 | |||
| IBM / International Business Machines Corporation | 0.02 | 1.51 | 0.01 | 25.00 | 0.9921 | 0.0173 | |||
| NEM / Newmont Corporation | 0.09 | -10.67 | 0.01 | 0.00 | 0.9872 | -0.0954 | |||
| GM / General Motors Company | 0.11 | 19.59 | 0.01 | 25.00 | 0.9636 | 0.0534 | |||
| MDT / Medtronic plc | 0.06 | 34.38 | 0.01 | 25.00 | 0.9471 | 0.0882 | |||
| CAH / Cardinal Health, Inc. | 0.03 | 1.45 | 0.01 | 25.00 | 0.9072 | 0.0402 | |||
| JBL / Jabil Inc. | 0.02 | 8.14 | 0.00 | 100.00 | 0.8945 | 0.2844 | |||
| AEM / Agnico Eagle Mines Limited | 0.04 | -5.92 | 0.00 | 0.00 | 0.8931 | -0.1293 | |||
| DIS / The Walt Disney Company | 0.04 | 3.18 | 0.00 | 33.33 | 0.8852 | 0.0781 | |||
| SKX / Skechers U.S.A., Inc. | 0.08 | -5.83 | 0.00 | 0.00 | 0.8788 | -0.1140 | |||
| WPC / W. P. Carey Inc. | 0.08 | 5.25 | 0.00 | 0.00 | 0.8772 | -0.1196 | |||
| CL / Colgate-Palmolive Company | 0.05 | 8.17 | 0.00 | 0.00 | 0.8752 | -0.1108 | |||
| PSA / Public Storage | 0.02 | 12.12 | 0.00 | 0.00 | 0.8652 | -0.0654 | |||
| KHC / The Kraft Heinz Company | 0.19 | 8.03 | 0.00 | -20.00 | 0.8646 | -0.2507 | |||
| CVS / CVS Health Corporation | 0.07 | 7.82 | 0.00 | 0.00 | 0.8261 | -0.0638 | |||
| HPQ / HP Inc. | 0.19 | 19.77 | 0.00 | 0.00 | 0.8218 | -0.0966 | |||
| MCK / McKesson Corporation | 0.01 | -6.03 | 0.00 | 0.00 | 0.8152 | -0.1267 | |||
| TD / The Toronto-Dominion Bank | 0.06 | 3.32 | 0.00 | 33.33 | 0.8061 | 0.0531 | |||
| ABBV / AbbVie Inc. | 0.02 | 15.46 | 0.00 | 0.00 | 0.7918 | -0.1233 | |||
| SII / Wheaton Precious Metals Corp. | 0.05 | -1.40 | 0.00 | 33.33 | 0.7450 | -0.0274 | |||
| ARW / Arrow Electronics, Inc. | 0.03 | 5.07 | 0.00 | 33.33 | 0.7425 | 0.0619 | |||
| RY / Royal Bank of Canada | 0.03 | 2.87 | 0.00 | 33.33 | 0.7348 | 0.0117 | |||
| WMT / Walmart Inc. | 0.04 | -34.89 | 0.00 | -20.00 | 0.7332 | -0.4623 | |||
| QCOM / QUALCOMM Incorporated | 0.02 | -3.12 | 0.00 | 0.00 | 0.7092 | -0.1254 | |||
| EXC / Exelon Corporation | 0.09 | 31.33 | 0.00 | 0.00 | 0.6996 | 0.0313 | |||
| BMY / Bristol-Myers Squibb Company | 0.08 | 42.28 | 0.00 | 0.00 | 0.6897 | -0.0654 | |||
| SJM / The J. M. Smucker Company | 0.04 | 5.86 | 0.00 | -25.00 | 0.6797 | -0.2358 | |||
| GDDY / GoDaddy Inc. | 0.02 | 48.98 | 0.00 | 50.00 | 0.6568 | 0.1353 | |||
| ORCL / Oracle Corporation | 0.02 | -25.37 | 0.00 | 0.00 | 0.6389 | -0.0083 | |||
| MMC / Marsh & McLennan Companies, Inc. | 0.02 | 29.26 | 0.00 | 0.00 | 0.6305 | -0.0131 | |||
| GIS / General Mills, Inc. | 0.06 | 6.07 | 0.00 | 0.00 | 0.5943 | -0.1701 | |||
| NFLX / Netflix, Inc. | 0.00 | 35.44 | 0.00 | 200.00 | 0.5864 | 0.2301 | |||
| ADBE / Adobe Inc. | 0.01 | 0.00 | 0.5755 | 0.5755 | |||||
| KGC / Kinross Gold Corporation | 0.20 | -16.62 | 0.00 | 0.00 | 0.5548 | -0.0805 | |||
| REGN / Regeneron Pharmaceuticals, Inc. | 0.01 | 302.97 | 0.00 | 0.5347 | 0.3451 | ||||
| DECK / Deckers Outdoor Corporation | 0.03 | 50.38 | 0.00 | 0.00 | 0.5161 | 0.0759 | |||
| VRTX / Vertex Pharmaceuticals Incorporated | 0.01 | -34.36 | 0.00 | -50.00 | 0.4771 | -0.4585 | |||
| CVX / Chevron Corporation | 0.02 | 14.94 | 0.00 | 0.00 | 0.4595 | -0.0928 | |||
| UBER / Uber Technologies, Inc. | 0.03 | 14.72 | 0.00 | 100.00 | 0.4504 | 0.0879 | |||
| ACI / Albertsons Companies, Inc. | 0.12 | -15.33 | 0.00 | -33.33 | 0.4497 | -0.1922 | |||
| XOM / Exxon Mobil Corporation | 0.02 | 34.77 | 0.00 | 0.00 | 0.4450 | 0.0144 | |||
| CCI / Crown Castle Inc. | 0.02 | 0.00 | 0.4248 | 0.4248 | |||||
| DUK / Duke Energy Corporation | 0.02 | 5.07 | 0.00 | 0.00 | 0.4205 | -0.0686 | |||
| UNH / UnitedHealth Group Incorporated | 0.01 | 14.13 | 0.00 | -33.33 | 0.4191 | -0.3098 | |||
| ACN / Accenture plc | 0.01 | 39.72 | 0.00 | 100.00 | 0.4160 | 0.0486 | |||
| PEP / PepsiCo, Inc. | 0.02 | 17.20 | 0.00 | 0.00 | 0.4157 | -0.0605 | |||
| SBRA / Sabra Health Care REIT, Inc. | 0.12 | -6.61 | 0.00 | 0.00 | 0.3919 | -0.0782 | |||
| ABNB / Airbnb, Inc. | 0.02 | 144.31 | 0.00 | 0.3870 | 0.2179 | ||||
| ROIV / Roivant Sciences Ltd. | 0.18 | 11.90 | 0.00 | 0.00 | 0.3568 | 0.0194 | |||
| UPS / United Parcel Service, Inc. | 0.02 | 24.36 | 0.00 | 0.00 | 0.3412 | -0.0122 | |||
| RIO / Rio Tinto Group - Depositary Receipt (Common Stock) | 0.02 | 0.00 | 0.00 | 0.00 | 0.1824 | -0.0398 | |||
| WST / West Pharmaceutical Services, Inc. | 0.00 | 0.00 | 0.00 | 0.1117 | -0.0233 | ||||
| GOOG / Alphabet Inc. | 0.00 | 2.35 | 0.00 | 0.1022 | -0.0017 | ||||
| MUFG / Mitsubishi UFJ Financial Group, Inc. - Depositary Receipt (Common Stock) | 0.03 | 46.90 | 0.00 | 0.0847 | 0.0170 | ||||
| XMFA / Sumitomo Mitsui Financial Group, Inc. - Depositary Receipt (Common Stock) | 0.02 | -34.63 | 0.00 | 0.0612 | -0.0522 | ||||
| MFG / Mizuho Financial Group, Inc. - Depositary Receipt (Common Stock) | 0.05 | 0.00 | 0.0498 | 0.0498 | |||||
| VTRS / Viatris Inc. | 0.02 | 247.67 | 0.00 | 0.0381 | 0.0254 |