Mga Batayang Estadistika
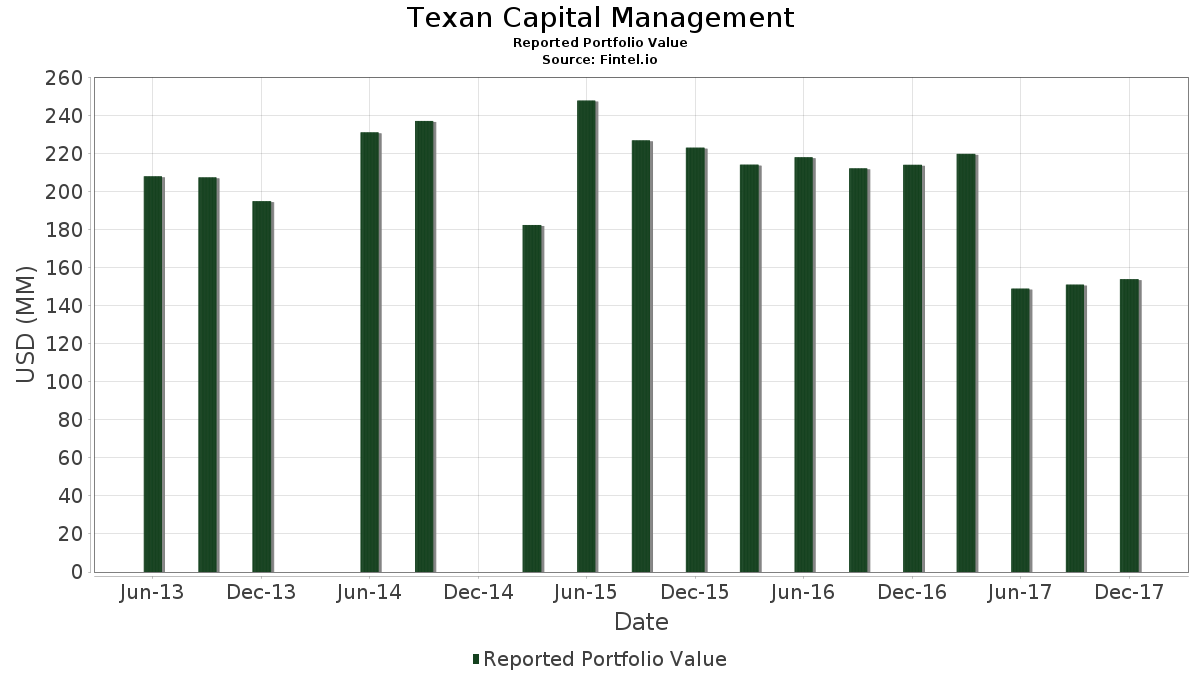
| Nilai Portofolio | $ 153,889,000 |
| Posisi Saat Ini | 104 |
Kepemilikan Terbaru, Kinerja, AUM (dari 13F, 13D)
Texan Capital Management telah mengungkapkan total kepemilikan 104 dalam pengajuan SEC terbaru mereka. Nilai portofolio terbaru dihitung sebesar $ 153,889,000 USD. Aset yang Dikelola (AUM) sebenarnya adalah nilai ini ditambah kas (yang tidak diungkapkan). Aset-aset utama Texan Capital Management adalah Dril-Quip, Inc. (US:DRQ) , Main Street Capital Corporation (US:MAIN) , Amazon.com, Inc. (US:AMZN) , Alphabet Inc. (US:GOOGL) , and Exxon Mobil Corporation (US:XOM) . Posisi baru Texan Capital Management meliputi: Southwest Airlines Co. (US:LUV) , Adobe Inc. (US:ADBE) , WPX Energy, Inc. (US:US98212B1035) , iShares Trust - iShares MSCI EAFE ETF (US:EFA) , and .
Peningkatan Tertinggi Kuartal Ini
Kami menggunakan perubahan dalam alokasi portofolio karena ini adalah metrik yang paling bermakna. Perubahan dapat disebabkan oleh perdagangan atau perubahan harga saham.
| Keamanan | Saham (MM) |
Nilai (Juta Dolar AS) |
Portfolio % | ΔPorsyento ng Portfolio |
|---|---|---|---|---|
| 0.03 | 3.44 | 2.2334 | 2.2334 | |
| 0.03 | 2.25 | 1.4634 | 1.4634 | |
| 0.01 | 2.04 | 1.3243 | 1.3243 | |
| 0.02 | 2.02 | 1.3094 | 1.3094 | |
| 0.06 | 1.92 | 1.2464 | 1.2464 | |
| 0.01 | 1.44 | 0.9351 | 0.9351 | |
| 0.02 | 1.19 | 0.7746 | 0.7746 | |
| 0.01 | 1.06 | 0.6869 | 0.6869 | |
| 0.07 | 1.03 | 0.6706 | 0.6706 | |
| 0.02 | 2.13 | 1.3854 | 0.6252 |
Penurunan Tertinggi Kuartal Ini
Kami menggunakan perubahan dalam alokasi portofolio karena ini adalah metrik yang paling bermakna. Perubahan dapat disebabkan oleh perdagangan atau perubahan harga saham.
| Keamanan | Saham (MM) |
Nilai (Juta Dolar AS) |
Portfolio % | ΔPorsyento ng Portfolio |
|---|---|---|---|---|
| 0.02 | 1.83 | 1.1918 | -1,213,147.4322 | |
| 0.06 | 1.05 | 0.6843 | -1.3189 | |
| 0.00 | 0.00 | -0.6231 | ||
| 0.04 | 2.17 | 1.4088 | -0.5480 | |
| 0.04 | 2.23 | 1.4497 | -0.2687 | |
| 0.05 | 3.82 | 2.4817 | -0.2512 | |
| 0.13 | 5.36 | 3.4830 | -0.2273 | |
| 0.03 | 2.94 | 1.9085 | -0.1741 | |
| 0.02 | 1.22 | 0.7941 | -0.1714 | |
| 0.01 | 0.35 | 0.2281 | -0.1050 |
Pengajuan 13F dan Dana
Formulir ini diajukan pada 2018-02-02 untuk periode pelaporan 2017-12-31. Klik ikon tautan untuk melihat riwayat transaksi selengkapnya.
Tingkatkan ke versi premium untuk membuka data premium dan ekspor ke Excel. ![]() .
.
| Keamanan | Ketik | Harga Saham Rata-rata | Saham (MM) |
ΔSaham (%) |
ΔSaham (%) |
Nilai ($MM) |
Portpolyo (%) |
ΔPortofolio (%) |
|
|---|---|---|---|---|---|---|---|---|---|
| DRQ / Dril-Quip, Inc. | 0.15 | 0.00 | 7.16 | 8.03 | 4.6501 | 0.2637 | |||
| MAIN / Main Street Capital Corporation | 0.13 | -4.29 | 5.36 | -4.34 | 3.4830 | -0.2273 | |||
| AMZN / Amazon.com, Inc. | 0.00 | -2.81 | 4.68 | 18.22 | 3.0438 | 0.4201 | |||
| GOOGL / Alphabet Inc. | 0.00 | -2.11 | 4.24 | 5.89 | 2.7578 | 0.1037 | |||
| XOM / Exxon Mobil Corporation | 0.05 | -2.13 | 4.04 | -0.15 | 2.6233 | -0.0540 | |||
| AAPL / Apple Inc. | 0.02 | -4.32 | 4.01 | 5.06 | 2.6051 | 0.0782 | |||
| MSFT / Microsoft Corporation | 0.05 | -5.13 | 3.86 | 8.92 | 2.5077 | 0.1615 | |||
| WBA / Walgreens Boots Alliance, Inc. | 0.05 | -1.62 | 3.82 | -7.46 | 2.4817 | -0.2512 | |||
| COST / Costco Wholesale Corporation | 0.02 | -10.52 | 3.78 | 1.37 | 2.4589 | -0.0131 | |||
| INTC / Intel Corporation | 0.08 | -2.53 | 3.73 | 18.16 | 2.4225 | 0.3333 | |||
| EOG / EOG Resources, Inc. | 0.03 | -3.24 | 3.69 | 7.93 | 2.3959 | 0.1338 | |||
| JPM / JPMorgan Chase & Co. | 0.03 | -1.94 | 3.44 | 9.77 | 2.2334 | 2.2334 | |||
| V / Visa Inc. | 0.03 | -2.19 | 3.29 | 5.96 | 2.1386 | 0.0818 | |||
| PXD / Pioneer Natural Resources Company | 0.02 | -2.93 | 3.18 | 13.75 | 2.0645 | 0.2150 | |||
| NVS / Novartis AG - Depositary Receipt (Common Stock) | 0.03 | -4.50 | 2.94 | -6.61 | 1.9085 | -0.1741 | |||
| EPD / Enterprise Products Partners L.P. - Limited Partnership | 0.11 | -1.08 | 2.93 | 0.58 | 1.9014 | -0.0250 | |||
| COG / Cabot Oil & Gas Corp. | 0.10 | -3.33 | 2.88 | 3.37 | 1.8721 | 0.0266 | |||
| SBUX / Starbucks Corporation | 0.05 | -0.61 | 2.80 | 6.26 | 1.8195 | 0.0746 | |||
| DIS / The Walt Disney Company | 0.03 | -2.61 | 2.75 | 6.22 | 1.7857 | 0.0726 | |||
| LOW / Lowe's Companies, Inc. | 0.03 | -2.20 | 2.67 | 13.73 | 1.7383 | 0.1808 | |||
| PEP / PepsiCo, Inc. | 0.02 | -0.68 | 2.64 | 6.88 | 1.7162 | 0.0799 | |||
| META / Meta Platforms, Inc. | 0.01 | -1.36 | 2.55 | 1.88 | 1.6551 | -0.0004 | |||
| US3024451011 / FLIR Systems, Inc. | 0.05 | -2.13 | 2.53 | 17.23 | 1.6447 | 0.2150 | |||
| US0325111070 / Anadarko Petroleum Corp. | 0.05 | -3.04 | 2.46 | 6.48 | 1.6018 | 0.0688 | |||
| PG / The Procter & Gamble Company | 0.03 | -2.74 | 2.30 | -1.79 | 1.4933 | -0.0563 | |||
| NKE / NIKE, Inc. | 0.04 | 1.75 | 2.29 | 22.72 | 1.4881 | 0.2524 | |||
| LUV / Southwest Airlines Co. | 0.03 | 2.25 | 1.4634 | 1.4634 | |||||
| MRK / Merck & Co., Inc. | 0.04 | -2.17 | 2.23 | -14.03 | 1.4497 | -0.2687 | |||
| HF / Tidal Trust II - DGA Core Plus Absolute Return ETF | 0.04 | -40.34 | 2.17 | -26.63 | 1.4088 | -0.5480 | |||
| HCA / HCA Healthcare, Inc. | 0.02 | 68.29 | 2.13 | 85.71 | 1.3854 | 0.6252 | |||
| ABMD / Abiomed Inc. | 0.01 | -4.51 | 2.04 | 6.15 | 1.3243 | 1.3243 | |||
| EMN / Eastman Chemical Company | 0.02 | -1.55 | 2.02 | 5.50 | 1.3094 | 1.3094 | |||
| US0549371070 / BB&T Corp. | 0.04 | -4.60 | 1.96 | 1.08 | 1.2743 | -0.0104 | |||
| HACK / Amplify ETF Trust - Amplify Cybersecurity ETF | 0.06 | 79.63 | 1.92 | 88.78 | 1.2464 | 1.2464 | |||
| JNJ / Johnson & Johnson | 0.01 | -3.66 | 1.90 | 3.54 | 1.2366 | 0.0195 | |||
| SAP / SAP SE - Depositary Receipt (Common Stock) | 0.02 | -2.34 | 1.83 | 0.11 | 1.1918 | -1,213,147.4322 | |||
| LMT / Lockheed Martin Corporation | 0.01 | -3.47 | 1.81 | -0.11 | 1.1736 | -0.0237 | |||
| HAL / Halliburton Company | 0.03 | -4.25 | 1.71 | 1.67 | 1.1086 | -0.0026 | |||
| MMP / Magellan Midstream Partners L.P. | 0.02 | -4.44 | 1.59 | -4.56 | 1.0326 | -0.0700 | |||
| AB / AllianceBernstein Holding L.P. - Limited Partnership | 0.06 | -2.03 | 1.57 | 0.96 | 1.0222 | -0.0095 | |||
| CFR / Cullen/Frost Bankers, Inc. | 0.02 | -4.62 | 1.56 | -4.92 | 1.0170 | -0.0730 | |||
| F / Ford Motor Company | 0.12 | -7.32 | 1.50 | -3.28 | 0.9767 | -0.0524 | |||
| Medtronic PLC / (65960L103) | 0.02 | 1.45 | 0.0000 | ||||||
| CRM / Salesforce, Inc. | 0.01 | 1.44 | 0.9351 | 0.9351 | |||||
| US1182301010 / Buckeye Partners, L.P. | 0.02 | -3.63 | 1.22 | -16.19 | 0.7941 | -0.1714 | |||
| EQT / EQT Corporation | 0.02 | 1.19 | 0.7746 | 0.7746 | |||||
| US20605P1012 / Concho Resources, Inc. | 0.01 | -6.95 | 1.07 | 6.17 | 0.6934 | 0.0278 | |||
| ADBE / Adobe Inc. | 0.01 | 1.06 | 0.6869 | 0.6869 | |||||
| GE / General Electric Company | 0.06 | -51.78 | 1.05 | -65.19 | 0.6843 | -1.3189 | |||
| US98212B1035 / WPX Energy, Inc. | 0.07 | 1.03 | 0.6706 | 0.6706 | |||||
| MRO / Marathon Oil Corporation | 0.06 | -5.31 | 0.96 | 18.17 | 0.6212 | 0.0855 | |||
| WES / Western Midstream Partners, LP - Limited Partnership | 0.02 | -1.26 | 0.94 | -7.36 | 0.6134 | -0.0614 | |||
| DOW / Dow Inc. | 0.01 | 11.76 | 0.88 | 35.87 | 0.5686 | 0.2580 | |||
| US6550441058 / Noble Energy, Inc. | 0.03 | -3.55 | 0.87 | -0.91 | 0.5660 | -0.0161 | |||
| SLB / Schlumberger Limited | 0.01 | -10.26 | 0.85 | -13.24 | 0.5536 | -0.0966 | |||
| IBM / International Business Machines Corporation | 0.01 | 0.00 | 0.80 | 5.71 | 0.5173 | 0.0186 | |||
| PAA / Plains All American Pipeline, L.P. - Limited Partnership | 0.04 | 0.00 | 0.79 | -2.58 | 0.5153 | -0.0237 | |||
| BRK.B / Berkshire Hathaway Inc. | 0.00 | -73.18 | 0.79 | -70.99 | 0.5147 | 0.5147 | |||
| ABBV / AbbVie Inc. | 0.01 | 0.00 | 0.77 | 8.87 | 0.5023 | 0.0321 | |||
| T / AT&T Inc. | 0.02 | -1.97 | 0.74 | -2.75 | 0.4822 | -0.0231 | |||
| GSY / Invesco Actively Managed Exchange-Traded Fund Trust - Invesco Ultra Short Duration ETF | 0.01 | 0.16 | 0.67 | -0.30 | 0.4341 | 0.4341 | |||
| TRGP / Targa Resources Corp. | 0.01 | 0.00 | 0.62 | 2.32 | 0.4009 | 0.4009 | |||
| CLR / Continental Resources Inc (OKLA) | 0.01 | 0.00 | 0.60 | 37.39 | 0.3892 | 0.1005 | |||
| IWF / iShares Trust - iShares Russell 1000 Growth ETF | 0.00 | -16.64 | 0.56 | -10.13 | 0.3632 | -0.0486 | |||
| DVN / Devon Energy Corporation | 0.01 | -3.63 | 0.55 | 8.70 | 0.3574 | 0.0223 | |||
| SPY / SPDR S&P 500 ETF | 0.00 | -15.90 | 0.54 | -10.58 | 0.3516 | 0.3516 | |||
| XEC / Cimarex Energy Co. | 0.00 | -6.40 | 0.54 | 0.38 | 0.3477 | -0.0053 | |||
| OXY / Occidental Petroleum Corporation | 0.01 | -11.63 | 0.52 | 1.36 | 0.3392 | -0.0018 | |||
| KO / The Coca-Cola Company | 0.01 | -9.92 | 0.49 | -8.16 | 0.3217 | -0.0353 | |||
| AR / Antero Resources Corporation | 0.03 | -4.58 | 0.49 | -8.80 | 0.3165 | 0.3165 | |||
| IWM / iShares Trust - iShares Russell 2000 ETF | 0.00 | -7.51 | 0.48 | -4.72 | 0.3152 | 0.3152 | |||
| WMT / Walmart Inc. | 0.00 | 0.00 | 0.48 | 26.44 | 0.3139 | 0.0609 | |||
| CVX / Chevron Corporation | 0.00 | 0.00 | 0.46 | 6.45 | 0.3002 | 0.0128 | |||
| KMI / Kinder Morgan, Inc. | 0.02 | -4.15 | 0.45 | -9.68 | 0.2911 | -0.0373 | |||
| PFE / Pfizer Inc. | 0.01 | 0.00 | 0.44 | 1.38 | 0.2872 | -0.0015 | |||
| / Gulfport Energy Corp. | 0.03 | -4.22 | 0.43 | -14.71 | 0.2827 | 0.2827 | |||
| SWN / Southwestern Energy Company | 0.08 | -4.87 | 0.42 | -13.09 | 0.2762 | -0.0476 | |||
| SM / SM Energy Company | 0.02 | -3.57 | 0.42 | 20.11 | 0.2716 | 0.0412 | |||
| US26885B1008 / EQT Midstream Partners LP | 0.01 | 0.00 | 0.40 | -2.43 | 0.2612 | -0.0116 | |||
| XOP / SPDR Series Trust - SPDR S&P Oil & Gas Exploration & Production ETF | 0.01 | -15.25 | 0.37 | -7.46 | 0.2417 | -0.0245 | |||
| SLCA / U.S. Silica Holdings, Inc. | 0.01 | -5.52 | 0.36 | -0.82 | 0.2359 | 0.2359 | |||
| EFA / iShares Trust - iShares MSCI EAFE ETF | 0.01 | 0.36 | 0.2313 | 0.2313 | |||||
| SO / The Southern Company | 0.01 | -28.55 | 0.35 | -30.22 | 0.2281 | -0.1050 | |||
| CL / Colgate-Palmolive Company | 0.00 | 0.00 | 0.33 | 3.43 | 0.2157 | 0.0032 | |||
| ABT / Abbott Laboratories | 0.01 | 0.00 | 0.32 | 6.98 | 0.2092 | 0.0099 | |||
| RSPP / RSP Permian, Inc. | 0.01 | -16.13 | 0.32 | -1.55 | 0.2060 | -0.0072 | |||
| BK / The Bank of New York Mellon Corporation | 0.01 | 0.00 | 0.32 | 1.61 | 0.2053 | -0.0006 | |||
| GL / Globe Life Inc. | 0.00 | 0.00 | 0.31 | 13.24 | 0.2001 | 0.0200 | |||
| BMY / Bristol-Myers Squibb Company | 0.00 | 0.00 | 0.30 | -3.85 | 0.1949 | -0.0117 | |||
| PM / Philip Morris International Inc. | 0.00 | 0.00 | 0.29 | -4.56 | 0.1904 | -0.0129 | |||
| APA / APA Corporation | 0.01 | 0.00 | 0.29 | -7.89 | 0.1897 | -0.0202 | |||
| FMSA / Fairmount Santrol Holdings Inc. | 0.05 | 0.92 | 0.28 | 10.04 | 0.1852 | 0.1852 | |||
| CNP / CenterPoint Energy, Inc. | 0.01 | 0.00 | 0.25 | -3.08 | 0.1638 | -0.0084 | |||
| RDS.A / Shell Plc - ADR (Representing Ordinary Shares - Class A) | 0.00 | 0.00 | 0.25 | 10.04 | 0.1638 | 0.0121 | |||
| FET / Forum Energy Technologies, Inc. | 0.02 | -5.33 | 0.25 | -7.43 | 0.1618 | 0.1618 | |||
| OII / Oceaneering International, Inc. | 0.01 | 0.00 | 0.23 | -19.57 | 0.1469 | -0.0392 | |||
| MO / Altria Group, Inc. | 0.00 | 0.21 | 0.1345 | 0.1345 | |||||
| WLL / Whiting Petroleum Corp (New) | 0.01 | -75.53 | 0.20 | 18.71 | 0.1319 | 0.0187 | |||
| CAT / Caterpillar Inc. | 0.00 | 0.20 | 0.1306 | 0.1306 | |||||
| OAS / Oasis Petroleum Inc. - New | 0.02 | -10.60 | 0.14 | -17.18 | 0.0877 | -0.0202 | |||
| BBG / Bill Barrett Corp. | 0.02 | 0.00 | 0.11 | 20.00 | 0.0702 | 0.0702 | |||
| ESV / Ensco plc | 0.01 | -5.99 | 0.07 | -7.50 | 0.0481 | -0.0049 | |||
| / Denbury Resources, Inc. | 0.02 | -8.98 | 0.05 | 50.00 | 0.0331 | 0.0106 | |||
| TGA / Transglobe Energy Corp. | 0.03 | 0.00 | 0.04 | 0.00 | 0.0279 | -0.0005 | |||
| US7625941098 / Rice Energy Inc. | 0.00 | -100.00 | 0.00 | -100.00 | 0.0000 | ||||
| LPI / Laredo Petroleum Inc. | 0.00 | -100.00 | 0.00 | -100.00 | -0.0934 | ||||
| US7018771029 / Parsley Energy, Inc. | 0.00 | -100.00 | 0.00 | -100.00 | 0.0000 | ||||
| CELG / Celgene Corp. | 0.00 | -100.00 | 0.00 | -100.00 | 0.0000 | ||||
| DOW / Dow Inc. | 0.00 | -100.00 | 0.00 | -100.00 | 0.0000 | ||||
| SJM / The J. M. Smucker Company | 0.00 | -100.00 | 0.00 | -100.00 | 0.0000 | ||||
| US0268741560 / American International Group, Inc. Warrants | 0.10 | 0.00 | 0.00 | 0.0000 | 0.0000 | ||||
| 74005P104 / Praxair, Inc. | 0.00 | -100.00 | 0.00 | -100.00 | -0.6231 |