Mga Batayang Estadistika
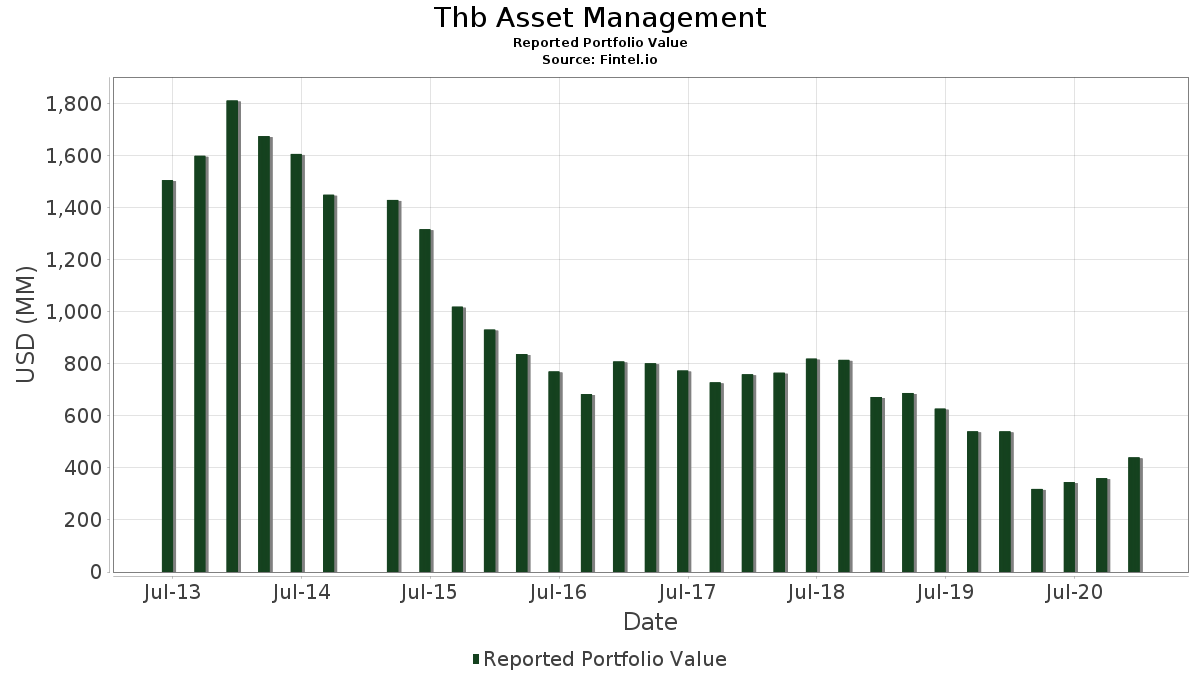
| Nilai Portofolio | $ 440,314,000 |
| Posisi Saat Ini | 154 |
Kepemilikan Terbaru, Kinerja, AUM (dari 13F, 13D)
Thb Asset Management telah mengungkapkan total kepemilikan 154 dalam pengajuan SEC terbaru mereka. Nilai portofolio terbaru dihitung sebesar $ 440,314,000 USD. Aset yang Dikelola (AUM) sebenarnya adalah nilai ini ditambah kas (yang tidak diungkapkan). Aset-aset utama Thb Asset Management adalah Guess?, Inc. (US:GES) , TPI Composites, Inc. (US:TPIC) , First Busey Corporation (US:BUSE) , PAR Technology Corporation (US:PAR) , and Perficient, Inc. (US:PRFT) . Posisi baru Thb Asset Management meliputi: Clean Energy Fuels Corp. (US:CLNE) , Vericel Corporation (US:VCEL) , Retractable Technologies, Inc. (US:RVP) , Kaiser Aluminum Corporation (US:KALU) , and Movado Group, Inc. (US:MOV) .
Peningkatan Tertinggi Kuartal Ini
Kami menggunakan perubahan dalam alokasi portofolio karena ini adalah metrik yang paling bermakna. Perubahan dapat disebabkan oleh perdagangan atau perubahan harga saham.
| Keamanan | Saham (MM) |
Nilai (Juta Dolar AS) |
Portfolio % | ΔPorsyento ng Portfolio |
|---|---|---|---|---|
| 0.82 | 6.44 | 1.4624 | 1.4624 | |
| 0.15 | 4.63 | 1.0511 | 1.0511 | |
| 0.51 | 11.08 | 2.5162 | 0.9718 | |
| 0.39 | 4.14 | 0.9400 | 0.9400 | |
| 0.57 | 13.00 | 2.9518 | 0.9313 | |
| 0.15 | 8.84 | 2.0081 | 0.8560 | |
| 0.33 | 3.26 | 0.7397 | 0.7397 | |
| 0.13 | 5.22 | 1.1853 | 0.6613 | |
| 0.03 | 2.71 | 0.6157 | 0.6157 | |
| 0.45 | 4.48 | 1.0179 | 0.5230 |
Penurunan Tertinggi Kuartal Ini
Kami menggunakan perubahan dalam alokasi portofolio karena ini adalah metrik yang paling bermakna. Perubahan dapat disebabkan oleh perdagangan atau perubahan harga saham.
| Keamanan | Saham (MM) |
Nilai (Juta Dolar AS) |
Portfolio % | ΔPorsyento ng Portfolio |
|---|---|---|---|---|
| 0.00 | 0.00 | -1.2717 | ||
| 0.04 | 2.12 | 0.4808 | -0.9299 | |
| 0.13 | 5.84 | 1.3270 | -0.8327 | |
| 0.00 | 0.00 | -0.7929 | ||
| 0.12 | 8.43 | 1.9134 | -0.7218 | |
| 0.15 | 9.46 | 2.1487 | -0.5359 | |
| 0.04 | 3.41 | 0.7751 | -0.5321 | |
| 0.11 | 4.79 | 1.0885 | -0.4642 | |
| 0.00 | 0.00 | -0.4594 | ||
| 0.29 | 2.67 | 0.6064 | -0.4287 |
Pengajuan 13F dan Dana
Formulir ini diajukan pada 2021-02-05 untuk periode pelaporan 2020-12-31. Klik ikon tautan untuk melihat riwayat transaksi selengkapnya.
Tingkatkan ke versi premium untuk membuka data premium dan ekspor ke Excel. ![]() .
.
| Keamanan | Ketik | Harga Saham Rata-rata | Saham (MM) |
ΔSaham (%) |
ΔSaham (%) |
Nilai ($MM) |
Portpolyo (%) |
ΔPortofolio (%) |
|
|---|---|---|---|---|---|---|---|---|---|
| GES / Guess?, Inc. | 0.57 | -8.33 | 13.00 | 78.46 | 2.9518 | 0.9313 | |||
| TPIC / TPI Composites, Inc. | 0.22 | -18.84 | 11.37 | 47.92 | 2.5818 | 0.4498 | |||
| BUSE / First Busey Corporation | 0.51 | 46.74 | 11.08 | 99.01 | 2.5162 | 0.9718 | |||
| PAR / PAR Technology Corporation | 0.15 | -36.92 | 9.46 | -2.23 | 2.1487 | -0.5359 | |||
| PRFT / Perficient, Inc. | 0.19 | -6.03 | 9.13 | 4.76 | 2.0735 | -0.3442 | |||
| BJRI / BJ's Restaurants, Inc. | 0.23 | -6.81 | 8.99 | 21.84 | 2.0415 | -0.0053 | |||
| HY / Hyster-Yale, Inc. | 0.15 | 32.81 | 8.84 | 112.91 | 2.0081 | 0.8560 | |||
| REGI / Renewable Energy Group Inc | 0.12 | -33.10 | 8.43 | -11.31 | 1.9134 | -0.7218 | |||
| PLUS / ePlus inc. | 0.09 | -0.83 | 7.75 | 19.15 | 1.7590 | -0.0442 | |||
| JYNT / The Joint Corp. | 0.28 | -4.12 | 7.37 | 44.78 | 1.6740 | 0.2617 | |||
| BLFS / BioLife Solutions, Inc. | 0.18 | -18.77 | 7.18 | 11.97 | 1.6311 | -0.1482 | |||
| UPLD / Upland Software, Inc. | 0.15 | -10.92 | 6.79 | 8.44 | 1.5414 | -0.1949 | |||
| UCTT / Ultra Clean Holdings, Inc. | 0.21 | -13.94 | 6.62 | 24.93 | 1.5032 | 0.0335 | |||
| CLNE / Clean Energy Fuels Corp. | 0.82 | 6.44 | 1.4624 | 1.4624 | |||||
| SKYW / SkyWest, Inc. | 0.16 | 17.83 | 6.36 | 59.08 | 1.4437 | 0.3352 | |||
| SNBR / Sleep Number Corporation | 0.08 | -20.91 | 6.28 | 32.39 | 1.4269 | 0.1103 | |||
| CAKE / The Cheesecake Factory Incorporated | 0.17 | -12.01 | 6.28 | 17.55 | 1.4267 | -0.0558 | |||
| BOOT / Boot Barn Holdings, Inc. | 0.14 | -17.12 | 6.25 | 27.73 | 1.4197 | 0.0620 | |||
| CCS / Century Communities, Inc. | 0.13 | -27.44 | 5.84 | -24.95 | 1.3270 | -0.8327 | |||
| LMAT / LeMaitre Vascular, Inc. | 0.14 | -11.56 | 5.83 | 10.11 | 1.3234 | -0.1447 | |||
| 83568G104 / Sonosite Inc | 0.24 | -18.60 | 5.66 | 25.44 | 1.2857 | 0.0337 | |||
| KOP / Koppers Holdings Inc. | 0.18 | -12.12 | 5.65 | 30.99 | 1.2825 | 0.0866 | |||
| OSBC / Old Second Bancorp, Inc. | 0.52 | -7.55 | 5.24 | 24.61 | 1.1901 | 0.0235 | |||
| / U.S. Concrete, Inc. | 0.13 | 100.67 | 5.22 | 176.28 | 1.1853 | 0.6613 | |||
| CIR / Circor International Inc | 0.13 | 24.01 | 5.13 | 74.29 | 1.1642 | 0.3483 | |||
| GBX / The Greenbrier Companies, Inc. | 0.14 | -2.53 | 5.01 | 20.64 | 1.1376 | -0.0142 | |||
| MHO / M/I Homes, Inc. | 0.11 | -10.95 | 4.79 | -14.36 | 1.0885 | -0.4642 | |||
| AMRX / Amneal Pharmaceuticals, Inc. | 1.01 | 21.77 | 4.64 | 43.44 | 1.0529 | 0.1563 | |||
| VCEL / Vericel Corporation | 0.15 | 4.63 | 1.0511 | 1.0511 | |||||
| ICHR / Ichor Holdings, Ltd. | 0.15 | -10.65 | 4.55 | 24.87 | 1.0343 | 0.0225 | |||
| AMOT / Allied Motion Technologies Inc | 0.09 | -11.86 | 4.52 | 9.11 | 1.0259 | -0.1226 | |||
| HSC / Enviri Corp | 0.25 | -9.93 | 4.51 | 16.45 | 1.0243 | -0.0502 | |||
| LUNA / Luna Innovations Incorporated | 0.45 | 52.05 | 4.48 | 151.23 | 1.0179 | 0.5230 | |||
| ONTO / Onto Innovation Inc. | 0.09 | -12.78 | 4.46 | 39.27 | 1.0140 | 0.1247 | |||
| TRNS / Transcat, Inc. | 0.13 | -11.32 | 4.39 | 4.97 | 0.9977 | -0.1633 | |||
| US7438151026 / Providence Service Corp. (The) | 0.03 | -7.33 | 4.37 | 38.28 | 0.9927 | 0.1158 | |||
| CRMT / America's Car-Mart, Inc. | 0.04 | -21.99 | 4.36 | 0.95 | 0.9911 | -0.2082 | |||
| RVP / Retractable Technologies, Inc. | 0.39 | 4.14 | 0.9400 | 0.9400 | |||||
| OFIX / Orthofix Medical Inc. | 0.09 | -11.02 | 4.07 | 22.83 | 0.9250 | 0.0051 | |||
| ADUS / Addus HomeCare Corporation | 0.03 | -12.79 | 4.01 | 8.05 | 0.9112 | -0.1189 | |||
| GHM / Graham Corporation | 0.26 | -13.15 | 3.90 | 3.22 | 0.8869 | -0.1626 | |||
| NNBR / NN, Inc. | 0.59 | 41.11 | 3.86 | 79.74 | 0.8764 | 0.2808 | |||
| RES / RPC, Inc. | 1.20 | 55.24 | 3.77 | 85.22 | 0.8564 | 0.2916 | |||
| PING / Ping Identity Holding Corp | 0.13 | -11.47 | 3.74 | -18.75 | 0.8501 | -0.4280 | |||
| ORN / Orion Group Holdings, Inc. | 0.75 | -11.66 | 3.72 | 59.38 | 0.8449 | 0.1974 | |||
| RNDB / Randolph Bancorp Inc | 0.16 | -12.69 | 3.61 | 54.94 | 0.8199 | 0.1735 | |||
| HFWA / Heritage Financial Corporation | 0.15 | 46.41 | 3.54 | 86.23 | 0.8049 | 0.2770 | |||
| AMRC / Ameresco, Inc. | 0.07 | -24.62 | 3.54 | 17.91 | 0.8031 | -0.0289 | |||
| NSSC / Napco Security Technologies, Inc. | 0.13 | -10.31 | 3.49 | 0.06 | 0.7935 | -0.1752 | |||
| AMBA / Ambarella, Inc. | 0.04 | -58.83 | 3.41 | -27.57 | 0.7751 | -0.5321 | |||
| JOUT / Johnson Outdoors Inc. | 0.03 | -11.97 | 3.36 | 21.07 | 0.7633 | -0.0068 | |||
| OESX / Orion Energy Systems, Inc. | 0.33 | -10.26 | 3.26 | 16.99 | 0.7397 | 0.7397 | |||
| UTI / Universal Technical Institute, Inc. | 0.48 | -9.98 | 3.10 | 14.48 | 0.7038 | -0.0472 | |||
| PLPC / Preformed Line Products Company | 0.04 | -10.52 | 3.07 | 25.70 | 0.6965 | 0.0197 | |||
| BSET / Bassett Furniture Industries, Incorporated | 0.15 | -4.25 | 2.99 | 40.50 | 0.6800 | 0.0888 | |||
| CSII / Cardiovascular Systems Inc. | 0.07 | -13.50 | 2.91 | -3.81 | 0.6600 | -0.1781 | |||
| KAI / Kadant Inc. | 0.02 | -11.34 | 2.82 | 14.03 | 0.6407 | -0.0456 | |||
| KALU / Kaiser Aluminum Corporation | 0.03 | 2.71 | 0.6157 | 0.6157 | |||||
| VPG / Vishay Precision Group, Inc. | 0.09 | -19.55 | 2.69 | 0.00 | 0.6118 | -0.1355 | |||
| TACO / Berto Acquisition Corp. | 0.29 | -35.23 | 2.67 | -28.44 | 0.6064 | -0.4287 | |||
| ATRI / Atrion Corporation | 0.00 | -13.61 | 2.65 | -11.39 | 0.6009 | -0.2274 | |||
| NWPX / NWPX Infrastructure, Inc. | 0.09 | -10.52 | 2.60 | -4.27 | 0.5905 | -0.1630 | |||
| USX / U.S. Xpress Enterprises Inc - Class A | 0.37 | -13.20 | 2.54 | -28.13 | 0.5766 | -0.4035 | |||
| MLAB / Mesa Laboratories, Inc. | 0.01 | -15.44 | 2.52 | -4.84 | 0.5714 | -0.1621 | |||
| WLDN / Willdan Group, Inc. | 0.06 | -14.52 | 2.50 | 39.71 | 0.5689 | 0.0715 | |||
| CRY / Artivion Inc | 0.10 | -11.65 | 2.47 | 12.89 | 0.5607 | -0.0460 | |||
| BCML / BayCom Corp | 0.16 | -10.61 | 2.46 | 31.62 | 0.5587 | 0.0402 | |||
| RRGB / Red Robin Gourmet Burgers, Inc. | 0.12 | 2.30 | 0.5221 | 0.5221 | |||||
| ELY / Topgolf Callaway Brands Corp | 0.09 | 41.69 | 2.27 | 77.78 | 0.5160 | 0.1615 | |||
| SF / Stifel Financial Corp. | 0.04 | 66.91 | 2.22 | 66.67 | 0.5042 | 0.1347 | |||
| IESC / IES Holdings, Inc. | 0.05 | -9.12 | 2.17 | 31.67 | 0.4919 | 0.0356 | |||
| ZIXI / Zix Corp. | 0.25 | -10.48 | 2.15 | 32.25 | 0.4881 | 0.0373 | |||
| CHUY / Chuy's Holdings, Inc. | 0.08 | -13.88 | 2.14 | 16.52 | 0.4869 | -0.0235 | |||
| IIIN / Insteel Industries, Inc. | 0.10 | -14.88 | 2.12 | 1.39 | 0.4817 | -0.0987 | |||
| AIMC / Altra Industrial Motion Corp | 0.04 | -72.22 | 2.12 | -58.37 | 0.4808 | -0.9299 | |||
| ULBI / Ultralife Corporation | 0.32 | -10.06 | 2.07 | -1.38 | 0.4703 | -0.1122 | |||
| NDLS / Noodles & Company | 0.26 | -11.15 | 2.07 | 2.17 | 0.4694 | -0.0918 | |||
| ASPU / Aspen Group, Inc. | 0.18 | -10.00 | 2.01 | -10.33 | 0.4556 | 0.4556 | |||
| LGND / Ligand Pharmaceuticals Incorporated | 0.02 | -7.57 | 2.00 | -3.57 | 0.4538 | -0.1210 | |||
| MOV / Movado Group, Inc. | 0.12 | 1.94 | 0.4404 | 0.4404 | |||||
| SHYF / The Shyft Group, Inc. | 0.07 | 1.93 | 0.4372 | 0.4372 | |||||
| EXP / Eagle Materials Inc. | 0.02 | 36.37 | 1.89 | 60.17 | 0.4292 | 0.1019 | |||
| FI / Fiserv, Inc. | 0.67 | -10.21 | 1.83 | 59.81 | 0.4163 | 0.0981 | |||
| CHRS / Coherus Oncology, Inc. | 0.10 | -10.04 | 1.77 | -14.75 | 0.4018 | -0.1739 | |||
| VIVO / Meridian Bioscience Inc. | 0.09 | -10.42 | 1.76 | -1.40 | 0.3990 | -0.0953 | |||
| MYRG / MYR Group Inc. | 0.03 | -19.96 | 1.75 | 29.31 | 0.3968 | 0.0220 | |||
| HOMB / Home Bancshares, Inc. (Conway, AR) | 0.09 | 58.46 | 1.74 | 103.74 | 0.3956 | 0.1584 | |||
| BWEN / Broadwind, Inc. | 0.21 | 1.70 | 0.3850 | 0.3850 | |||||
| AEIS / Advanced Energy Industries, Inc. | 0.02 | 0.54 | 1.69 | 54.95 | 0.3836 | 0.0812 | |||
| LNTH / Lantheus Holdings, Inc. | 0.12 | -10.71 | 1.69 | -4.96 | 0.3827 | -0.1092 | |||
| GEOS / Geospace Technologies Corporation | 0.20 | 1.67 | 0.3793 | 0.3793 | |||||
| PDEX / Pro-Dex, Inc. | 0.05 | -9.53 | 1.61 | -2.07 | 0.3647 | -0.0902 | |||
| LPX / Louisiana-Pacific Corporation | 0.04 | 0.71 | 1.53 | 26.88 | 0.3484 | 0.0130 | |||
| FORM / FormFactor, Inc. | 0.04 | 0.66 | 1.51 | 73.71 | 0.3436 | 0.1020 | |||
| REX / REX American Resources Corporation | 0.02 | -10.46 | 1.51 | 0.27 | 0.3429 | -0.0749 | |||
| AMEH / Apollo Medical Holdings, Inc. | 0.08 | -10.19 | 1.46 | -8.55 | 0.3304 | -0.1109 | |||
| FBMS / The First Bancshares, Inc. | 0.05 | -10.99 | 1.45 | 31.01 | 0.3282 | 0.0222 | |||
| ITI / Iteris, Inc. | 0.25 | 1.44 | 0.3264 | 0.3264 | |||||
| ECHO / Echo Global Logistics Inc | 0.05 | 1.36 | 0.3098 | 0.3098 | |||||
| IBP / Installed Building Products, Inc. | 0.01 | 0.67 | 1.35 | 0.82 | 0.3073 | -0.0650 | |||
| DIOD / Diodes Incorporated | 0.02 | 0.44 | 1.32 | 25.45 | 0.2989 | 0.0079 | |||
| MEDP / Medpace Holdings, Inc. | 0.01 | 0.62 | 1.27 | 25.35 | 0.2887 | 0.0074 | |||
| ACLS / Axcelis Technologies, Inc. | 0.04 | -17.08 | 1.26 | 9.77 | 0.2857 | -0.0322 | |||
| ROG / Rogers Corporation | 0.01 | 26.90 | 1.24 | 101.14 | 0.2814 | 0.1105 | |||
| ROLL / RBC Bearings Inc. | 0.01 | 22.14 | 1.22 | 80.42 | 0.2762 | 0.0892 | |||
| HALO / Halozyme Therapeutics, Inc. | 0.03 | 0.67 | 1.21 | 63.70 | 0.2755 | 0.0699 | |||
| RUTH / Ruths Hospitality Group Inc | 0.07 | 1.20 | 0.2716 | 0.2716 | |||||
| NGS / Natural Gas Services Group, Inc. | 0.12 | -11.30 | 1.10 | -0.54 | 0.2503 | -0.0571 | |||
| STAA / STAAR Surgical Company | 0.01 | 0.68 | 1.09 | 40.93 | 0.2487 | 0.0331 | |||
| EME / EMCOR Group, Inc. | 0.01 | 0.63 | 1.07 | 35.92 | 0.2423 | 0.0246 | |||
| MTH / Meritage Homes Corporation | 0.01 | -11.84 | 1.04 | -33.90 | 0.2369 | -0.2009 | |||
| KEX / Kirby Corporation | 0.02 | 0.65 | 1.04 | 44.43 | 0.2355 | 0.0363 | |||
| EXLS / ExlService Holdings, Inc. | 0.01 | 0.73 | 1.01 | 29.97 | 0.2285 | 0.0138 | |||
| ROCK / Gibraltar Industries, Inc. | 0.01 | 17.20 | 1.00 | 29.44 | 0.2267 | 0.0128 | |||
| CVCO / Cavco Industries, Inc. | 0.01 | 0.87 | 0.99 | -1.88 | 0.2255 | -0.0552 | |||
| ANIP / ANI Pharmaceuticals, Inc. | 0.03 | -30.26 | 0.98 | -28.23 | 0.2223 | -0.1561 | |||
| ENSG / The Ensign Group, Inc. | 0.01 | 0.78 | 0.95 | 28.71 | 0.2169 | 0.0110 | |||
| SHOO / Steven Madden, Ltd. | 0.03 | 0.75 | 0.94 | 82.43 | 0.2146 | 0.0709 | |||
| LSTR / Landstar System, Inc. | 0.01 | 0.61 | 0.89 | 7.98 | 0.2028 | -0.0266 | |||
| ENV / Envestnet, Inc. | 0.01 | 0.71 | 0.88 | 7.44 | 0.2001 | -0.0274 | |||
| PCRX / Pacira BioSciences, Inc. | 0.01 | -11.04 | 0.88 | -11.44 | 0.1987 | -0.0754 | |||
| FWRD / Forward Air Corporation | 0.01 | -62.62 | 0.87 | -49.94 | 0.1985 | -0.2859 | |||
| EXPO / Exponent, Inc. | 0.01 | 0.69 | 0.86 | 25.84 | 0.1958 | 0.0057 | |||
| TPH / Tri Pointe Homes, Inc. | 0.05 | 0.73 | 0.83 | -4.25 | 0.1892 | -0.0522 | |||
| HXL / Hexcel Corporation | 0.02 | 0.83 | 0.1878 | 0.1878 | |||||
| SCL / Stepan Company | 0.01 | 0.83 | 0.1878 | 0.1878 | |||||
| CCMP / CMC Materials Inc | 0.01 | 0.67 | 0.81 | 6.68 | 0.1849 | -0.0268 | |||
| AAON / AAON, Inc. | 0.01 | 0.71 | 0.81 | 11.40 | 0.1842 | -0.0178 | |||
| FOXF / Fox Factory Holding Corp. | 0.01 | 0.70 | 0.80 | 43.29 | 0.1819 | 0.0268 | |||
| CBRL / Cracker Barrel Old Country Store, Inc. | 0.01 | 0.76 | 0.75 | 16.00 | 0.1712 | -0.0091 | |||
| MEI / Methode Electronics, Inc. | 0.02 | -40.76 | 0.75 | -20.45 | 0.1697 | -0.0908 | |||
| UNF / UniFirst Corporation | 0.00 | 0.69 | 0.74 | 12.63 | 0.1681 | -0.0142 | |||
| ITGR / Integer Holdings Corporation | 0.01 | 0.77 | 0.71 | 38.64 | 0.1622 | 0.0193 | |||
| LAND / Gladstone Land Corporation | 0.05 | 0.70 | 0.1590 | 0.1590 | |||||
| CACI / CACI International Inc | 0.00 | 2.51 | 0.65 | 20.11 | 0.1478 | -0.0025 | |||
| OSUR / OraSure Technologies, Inc. | 0.06 | 0.76 | 0.60 | -12.32 | 0.1358 | -0.0534 | |||
| EBS / Emergent BioSolutions Inc. | 0.01 | 0.70 | 0.59 | -12.65 | 0.1349 | -0.0537 | |||
| MKSI / MKS Inc. | 0.00 | -29.36 | 0.57 | -2.73 | 0.1297 | -0.0332 | |||
| EIG / Employers Holdings, Inc. | 0.02 | 99.95 | 0.57 | 113.11 | 0.1292 | 0.0552 | |||
| NEOG / Neogen Corporation | 0.01 | 21.99 | 0.56 | 23.62 | 0.1272 | 0.0015 | |||
| MANT / Mantech International Corp - Class A | 0.01 | 0.66 | 0.56 | 29.91 | 0.1263 | 0.0075 | |||
| EVTC / EVERTEC, Inc. | 0.01 | 0.70 | 0.55 | 14.08 | 0.1251 | -0.0089 | |||
| ASGN / ASGN Incorporated | 0.01 | -16.24 | 0.53 | 10.12 | 0.1210 | -0.0132 | |||
| GMED / Globus Medical, Inc. | 0.01 | 0.63 | 0.53 | 32.67 | 0.1208 | 0.0096 | |||
| FMBH / First Mid Bancshares, Inc. | 0.02 | 0.52 | 0.1172 | 0.1172 | |||||
| MMSI / Merit Medical Systems, Inc. | 0.01 | 0.79 | 0.51 | 28.72 | 0.1161 | 0.0059 | |||
| ICUI / ICU Medical, Inc. | 0.00 | 0.57 | 0.49 | 17.87 | 0.1108 | -0.0040 | |||
| MMS / Maximus, Inc. | 0.01 | 0.60 | 0.49 | 7.51 | 0.1106 | -0.0151 | |||
| PSTL / Postal Realty Trust, Inc. | 0.03 | -26.45 | 0.48 | -17.97 | 0.1099 | 0.1099 | |||
| VICR / Vicor Corporation | 0.00 | -74.89 | 0.44 | -70.24 | 0.1002 | -0.3110 | |||
| LCI / Lannett Co., Inc. | 0.07 | -34.40 | 0.43 | -29.97 | 0.0977 | -0.0727 | |||
| / BMC Stock Holdings, Inc. | 0.01 | -63.53 | 0.39 | -54.27 | 0.0877 | -0.1465 | |||
| NVEC / NVE Corporation | 0.01 | -54.56 | 0.39 | -47.97 | 0.0874 | -0.1179 | |||
| DORM / Dorman Products, Inc. | 0.00 | 0.70 | 0.38 | -3.35 | 0.0852 | -0.0225 | |||
| VRRM / Verra Mobility Corporation | 0.00 | -100.00 | 0.00 | -100.00 | -0.2219 | ||||
| JACK / Jack in the Box Inc. | 0.00 | -100.00 | 0.00 | -100.00 | -0.4594 | ||||
| TOL / Toll Brothers, Inc. | 0.00 | -100.00 | 0.00 | -100.00 | -0.2203 | ||||
| UFPT / UFP Technologies, Inc. | 0.00 | -100.00 | 0.00 | -100.00 | -0.1484 | ||||
| IIIV / i3 Verticals, Inc. | 0.00 | -100.00 | 0.00 | -100.00 | -0.0760 | ||||
| CDNA / CareDx, Inc | 0.00 | -100.00 | 0.00 | -100.00 | -0.4250 | ||||
| SNX / TD SYNNEX Corporation | 0.00 | -100.00 | 0.00 | -100.00 | -0.2125 | ||||
| CDLX / Cardlytics, Inc. | 0.00 | -100.00 | 0.00 | -100.00 | -1.2717 | ||||
| HSTM / HealthStream, Inc. | 0.00 | -100.00 | 0.00 | -100.00 | -0.1340 | ||||
| AU0000031767 / Churchill Capital Corp II Class A | 0.00 | -100.00 | 0.00 | 0.0000 | 0.0000 | ||||
| APPS / Digital Turbine, Inc. | 0.00 | -100.00 | 0.00 | -100.00 | -0.7929 | ||||
| HCCI / Heritage-Crystal Clean Inc | 0.00 | -100.00 | 0.00 | -100.00 | -0.3562 | ||||
| ICFI / ICF International, Inc. | 0.00 | -100.00 | 0.00 | -100.00 | -0.2017 |