Mga Batayang Estadistika
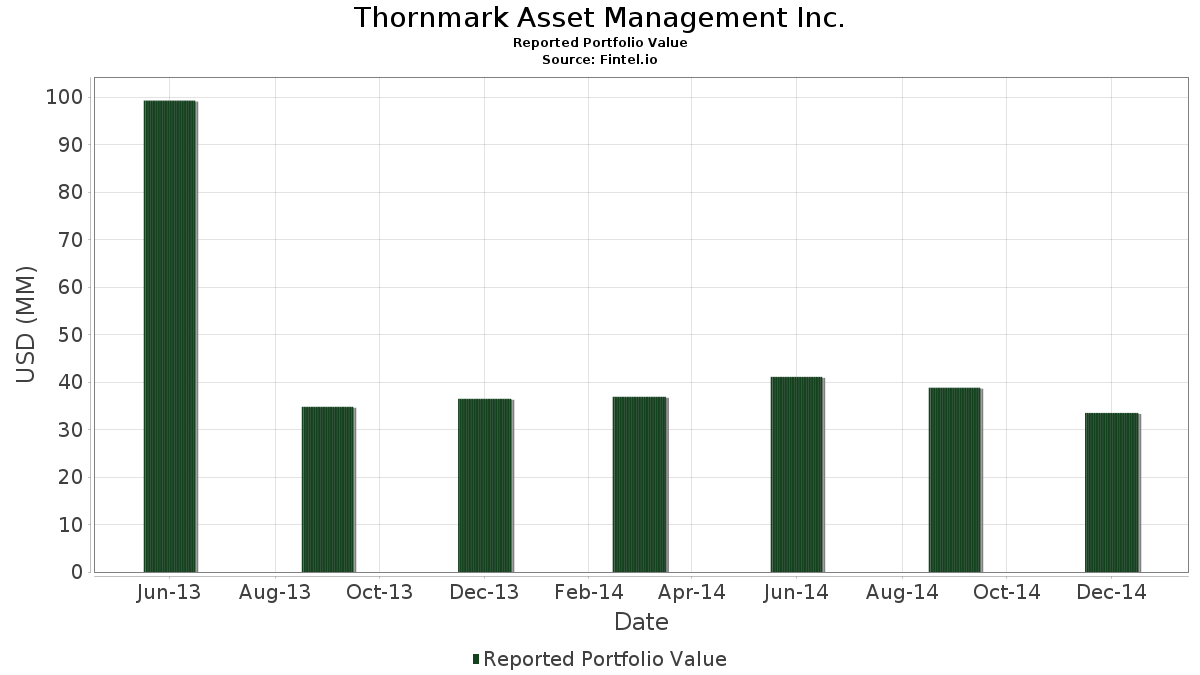
| Nilai Portofolio | $ 33,494,000 |
| Posisi Saat Ini | 47 |
Kepemilikan Terbaru, Kinerja, AUM (dari 13F, 13D)
Thornmark Asset Management Inc. telah mengungkapkan total kepemilikan 47 dalam pengajuan SEC terbaru mereka. Nilai portofolio terbaru dihitung sebesar $ 33,494,000 USD. Aset yang Dikelola (AUM) sebenarnya adalah nilai ini ditambah kas (yang tidak diungkapkan). Aset-aset utama Thornmark Asset Management Inc. adalah The Select Sector SPDR Trust - The Technology Select Sector SPDR Fund (US:XLK) , The Select Sector SPDR Trust - The Financial Select Sector SPDR Fund (US:XLF) , Bank of Montreal (US:BMO) , The Select Sector SPDR Trust - The Consumer Staples Select Sector SPDR Fund (US:XLP) , and Capital One Financial Corporation (US:COF) . Posisi baru Thornmark Asset Management Inc. meliputi: The Select Sector SPDR Trust - The Financial Select Sector SPDR Fund (US:XLF) , Tailored Brands, Inc. (US:US87403A1079) , CAE Inc. (US:CAE) , Thermo Fisher Scientific Inc. (US:TMO) , and The Select Sector SPDR Trust - The Energy Select Sector SPDR Fund (US:XLE) .
Peningkatan Tertinggi Kuartal Ini
Kami menggunakan perubahan dalam alokasi portofolio karena ini adalah metrik yang paling bermakna. Perubahan dapat disebabkan oleh perdagangan atau perubahan harga saham.
| Keamanan | Saham (MM) |
Nilai (Juta Dolar AS) |
Portfolio % | ΔPorsyento ng Portfolio |
|---|---|---|---|---|
| 0.07 | 1.61 | 4.7979 | 4.7979 | |
| 0.02 | 0.81 | 2.4183 | 2.4183 | |
| 0.02 | 0.69 | 2.0631 | 2.0631 | |
| 0.05 | 0.59 | 1.7645 | 1.7645 | |
| 0.05 | 1.98 | 5.9145 | 1.7601 | |
| 0.03 | 0.97 | 2.8871 | 1.6036 | |
| 0.01 | 1.09 | 3.2663 | 1.5679 | |
| 0.00 | 0.38 | 1.1405 | 1.1405 | |
| 0.00 | 0.30 | 0.8867 | 0.8867 | |
| 0.00 | 0.29 | 0.8658 | 0.8658 |
Penurunan Tertinggi Kuartal Ini
Kami menggunakan perubahan dalam alokasi portofolio karena ini adalah metrik yang paling bermakna. Perubahan dapat disebabkan oleh perdagangan atau perubahan harga saham.
| Keamanan | Saham (MM) |
Nilai (Juta Dolar AS) |
Portfolio % | ΔPorsyento ng Portfolio |
|---|---|---|---|---|
| 0.02 | 0.77 | 2.2900 | -2.4675 | |
| 0.01 | 0.55 | 1.6510 | -2.0678 | |
| 0.00 | 0.00 | -1.4561 | ||
| 0.00 | 0.00 | -1.4046 | ||
| 0.04 | 0.37 | 1.1017 | -1.3956 | |
| 0.02 | 0.64 | 1.9018 | -1.3892 | |
| 0.01 | 0.70 | 2.0780 | -1.2260 | |
| 0.00 | 0.00 | -1.1340 | ||
| 0.02 | 0.44 | 1.3196 | -1.0488 | |
| 0.03 | 0.87 | 2.6005 | -0.9380 |
Pengajuan 13F dan Dana
Formulir ini diajukan pada 2015-01-06 untuk periode pelaporan 2014-12-31. Klik ikon tautan untuk melihat riwayat transaksi selengkapnya.
Tingkatkan ke versi premium untuk membuka data premium dan ekspor ke Excel. ![]() .
.
| Keamanan | Ketik | Harga Saham Rata-rata | Saham (MM) |
ΔSaham (%) |
ΔSaham (%) |
Nilai ($MM) |
Portpolyo (%) |
ΔPortofolio (%) |
|
|---|---|---|---|---|---|---|---|---|---|
| XLK / The Select Sector SPDR Trust - The Technology Select Sector SPDR Fund | 0.05 | 18.56 | 1.98 | 22.89 | 5.9145 | 1.7601 | |||
| XLF / The Select Sector SPDR Trust - The Financial Select Sector SPDR Fund | 0.07 | 1.61 | 4.7979 | 4.7979 | |||||
| BMO / Bank of Montreal | 0.02 | -2.43 | 1.50 | -6.23 | 4.4904 | 0.3565 | |||
| XLP / The Select Sector SPDR Trust - The Consumer Staples Select Sector SPDR Fund | 0.03 | -18.93 | 1.47 | -12.84 | 4.3978 | 0.0424 | |||
| COF / Capital One Financial Corporation | 0.02 | -2.79 | 1.44 | -1.71 | 4.2933 | 0.5229 | |||
| CVS / CVS Health Corporation | 0.01 | -23.85 | 1.20 | -7.91 | 3.5797 | 0.2242 | |||
| DGX / Quest Diagnostics Incorporated | 0.02 | -20.50 | 1.13 | -12.17 | 3.3618 | 0.0578 | |||
| AAPL / Apple Inc. | 0.01 | 51.52 | 1.09 | 66.01 | 3.2663 | 1.5679 | |||
| CMCSA / Comcast Corporation | 0.02 | -31.95 | 0.98 | -26.65 | 2.9169 | -0.5159 | |||
| GIB / CGI Inc. | 0.03 | 71.61 | 0.97 | 94.18 | 2.8871 | 1.6036 | |||
| CVX / Chevron Corporation | 0.01 | -0.12 | 0.91 | -6.08 | 2.7199 | 0.2200 | |||
| GE / General Electric Company | 0.03 | -35.67 | 0.87 | -36.56 | 2.6005 | -0.9380 | |||
| DE / Deere & Company | 0.01 | -31.66 | 0.86 | -26.23 | 2.5617 | -0.4356 | |||
| TD / The Toronto-Dominion Bank | 0.02 | 3.59 | 0.83 | 0.24 | 2.4721 | 0.3433 | |||
| BNS / The Bank of Nova Scotia | 0.01 | 4.26 | 0.82 | -3.73 | 2.4631 | 0.2545 | |||
| VLO / Valero Energy Corporation | 0.02 | -11.51 | 0.81 | -5.37 | 2.4183 | 2.4183 | |||
| SLFYF / Sun Life Financial, Inc. - 4.75% PRF PERPETUAL CAD 25 - Cls A Ser 1 | 0.02 | -58.23 | 0.77 | -58.45 | 2.2900 | -2.4675 | |||
| GOOGL / Alphabet Inc. | 0.00 | 25.34 | 0.73 | 13.08 | 2.1944 | 0.5193 | |||
| WCN / Waste Connections, Inc. | 0.02 | -6.54 | 0.70 | 9.13 | 2.1049 | 0.4400 | |||
| AIG / American International Group, Inc. | 0.01 | -47.66 | 0.70 | -45.71 | 2.0780 | -1.2260 | |||
| US87403A1079 / Tailored Brands, Inc. | 0.02 | 0.69 | 2.0631 | 2.0631 | |||||
| WFC / Wells Fargo & Company | 0.01 | -12.49 | 0.68 | -7.44 | 2.0422 | 0.1376 | |||
| NKE / NIKE, Inc. | 0.01 | -17.72 | 0.67 | -11.32 | 2.0123 | 0.0536 | |||
| BAX / Baxter International Inc. | 0.01 | -39.20 | 0.66 | -37.97 | 1.9705 | -0.7716 | |||
| SU / Suncor Energy Inc. | 0.02 | -43.23 | 0.64 | -50.12 | 1.9018 | -1.3892 | |||
| CNQ / Canadian Natural Resources Limited | 0.02 | 5.83 | 0.62 | -15.83 | 1.8570 | -0.0475 | |||
| CSX / CSX Corporation | 0.02 | -33.89 | 0.60 | -25.34 | 1.8033 | -0.2816 | |||
| CAE / CAE Inc. | 0.05 | 0.59 | 1.7645 | 1.7645 | |||||
| GOOG / Alphabet Inc. | 0.00 | 0.00 | 0.58 | -8.78 | 1.7376 | 0.0934 | |||
| MRK / Merck & Co., Inc. | 0.01 | -5.15 | 0.55 | -9.18 | 1.6540 | 0.0819 | |||
| MET / MetLife, Inc. | 0.01 | -61.91 | 0.55 | -61.68 | 1.6510 | -2.0678 | |||
| CPG / Veren Inc. | 0.02 | 35.07 | 0.49 | -13.38 | 1.4689 | 0.0051 | |||
| RCI / Rogers Communications Inc. | 0.01 | -20.08 | 0.45 | -17.04 | 1.3376 | -0.0541 | |||
| ORCL / Oracle Corporation | 0.01 | -40.90 | 0.45 | -30.65 | 1.3376 | -0.3273 | |||
| MFC / HEXAOM | 0.02 | -51.51 | 0.44 | -51.90 | 1.3196 | -1.0488 | |||
| GIL / Gildan Activewear Inc. | 0.01 | -26.39 | 0.41 | -24.02 | 1.2181 | -0.1658 | |||
| META / Meta Platforms, Inc. | 0.00 | 0.00 | 0.38 | -1.29 | 1.1405 | 1.1405 | |||
| ERF / Enerplus Corporation | 0.04 | -24.87 | 0.37 | -61.92 | 1.1017 | -1.3956 | |||
| VZ / Verizon Communications Inc. | 0.01 | -29.13 | 0.32 | -33.68 | 0.9405 | -0.2837 | |||
| MGA / Magna International Inc. | 0.00 | -26.95 | 0.32 | -16.45 | 0.9405 | -0.0311 | |||
| TWX / Warner Media LLC | 0.00 | -50.81 | 0.31 | -44.09 | 0.9315 | -0.5066 | |||
| TMO / Thermo Fisher Scientific Inc. | 0.00 | 0.30 | 0.8867 | 0.8867 | |||||
| XLE / The Select Sector SPDR Trust - The Energy Select Sector SPDR Fund | 0.00 | 0.29 | 0.8658 | 0.8658 | |||||
| CM / Canadian Imperial Bank of Commerce | 0.00 | 0.00 | 0.27 | -4.24 | 0.8091 | 0.0798 | |||
| EOG / EOG Resources, Inc. | 0.00 | -42.67 | 0.24 | -46.64 | 0.7106 | -0.4389 | |||
| XLI / The Select Sector SPDR Trust - The Industrial Select Sector SPDR Fund | 0.00 | -26.48 | 0.20 | -21.84 | 0.6091 | -0.0636 | |||
| WPRT / Westport Fuel Systems Inc. | 0.01 | 0.01 | 0.04 | -80.98 | 0.1164 | -0.4457 | |||
| SPY / SPDR S&P 500 ETF | 0.00 | -100.00 | 0.00 | -100.00 | -0.7628 | ||||
| DIS / The Walt Disney Company | 0.00 | -100.00 | 0.00 | -100.00 | -1.4046 | ||||
| TECK.B / Teck Resources Limited | 0.00 | -100.00 | 0.00 | -100.00 | -1.1340 | ||||
| CNI / Canadian National Railway Company | 0.00 | -100.00 | 0.00 | -100.00 | -1.4561 |