Mga Batayang Estadistika
| Nilai Portofolio | $ 26,436,625 |
| Posisi Saat Ini | 144 |
Kepemilikan Terbaru, Kinerja, AUM (dari 13F, 13D)
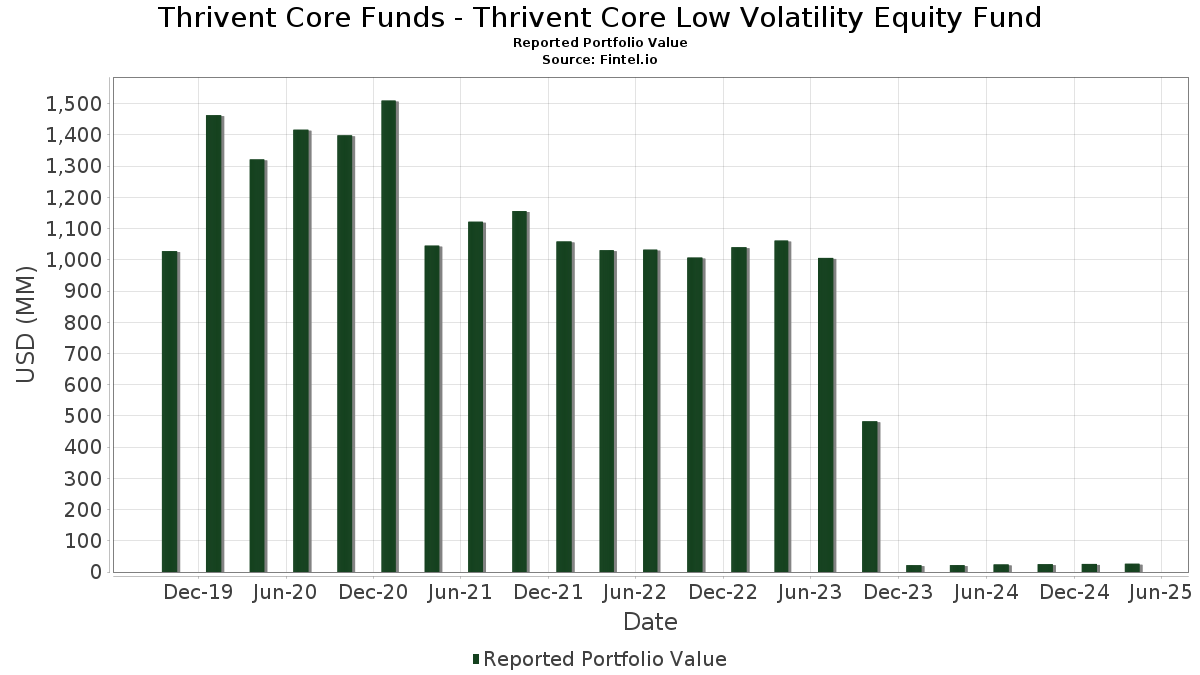
Thrivent Core Funds - Thrivent Core Low Volatility Equity Fund telah mengungkapkan total kepemilikan 144 dalam pengajuan SEC terbaru mereka. Nilai portofolio terbaru dihitung sebesar $ 26,436,625 USD. Aset yang Dikelola (AUM) sebenarnya adalah nilai ini ditambah kas (yang tidak diungkapkan). Aset-aset utama Thrivent Core Funds - Thrivent Core Low Volatility Equity Fund adalah Microsoft Corporation (US:MSFT) , Motorola Solutions, Inc. (US:MSI) , Cisco Systems, Inc. (US:CSCO) , T-Mobile US, Inc. (US:TMUS) , and The Progressive Corporation (US:PGR) . Posisi baru Thrivent Core Funds - Thrivent Core Low Volatility Equity Fund meliputi: PG&E Corporation (US:PCG) , Meta Platforms, Inc. (US:META) , State Street Institutional Investment Trust - State Street Institutional US Govt Money Market Fnd Premier Cls (US:GVMXX) , F5, Inc. (US:FFIV) , and Tradeweb Markets Inc. (US:TW) .
Peningkatan Tertinggi Kuartal Ini
Kami menggunakan perubahan dalam alokasi portofolio karena ini adalah metrik yang paling bermakna. Perubahan dapat disebabkan oleh perdagangan atau perubahan harga saham.
| Keamanan | Saham (MM) |
Nilai (Juta Dolar AS) |
Portfolio % | ΔPorsyento ng Portfolio |
|---|---|---|---|---|
| 0.00 | 0.35 | 1.3193 | 0.5795 | |
| 0.01 | 0.15 | 0.5655 | 0.5655 | |
| 0.01 | 0.39 | 1.4708 | 0.4472 | |
| 0.00 | 0.11 | 0.4258 | 0.4258 | |
| 0.11 | 0.11 | 0.3993 | 0.3993 | |
| 0.00 | 0.44 | 1.6544 | 0.3759 | |
| 0.00 | 0.33 | 1.2297 | 0.3495 | |
| 0.00 | 0.09 | 0.3305 | 0.3305 | |
| 0.00 | 0.13 | 0.4975 | 0.2937 | |
| 0.00 | 0.14 | 0.5135 | 0.2821 |
Penurunan Tertinggi Kuartal Ini
Kami menggunakan perubahan dalam alokasi portofolio karena ini adalah metrik yang paling bermakna. Perubahan dapat disebabkan oleh perdagangan atau perubahan harga saham.
| Keamanan | Saham (MM) |
Nilai (Juta Dolar AS) |
Portfolio % | ΔPorsyento ng Portfolio |
|---|---|---|---|---|
| 0.00 | 0.05 | 0.2046 | -0.6629 | |
| 0.00 | 0.06 | 0.2238 | -0.6074 | |
| 0.00 | 0.20 | 0.7739 | -0.6057 | |
| 0.00 | 0.44 | 1.6521 | -0.4742 | |
| 0.00 | 0.07 | 0.2627 | -0.4087 | |
| 0.00 | 0.40 | 1.5081 | -0.2879 | |
| 0.00 | 0.08 | 0.3149 | -0.2737 | |
| 0.00 | 0.33 | 1.2309 | -0.2594 | |
| 0.01 | 0.30 | 1.1353 | -0.2182 | |
| 0.00 | 0.12 | 0.4364 | -0.2173 |
Pengajuan 13F dan Dana
Formulir ini diajukan pada 2025-06-26 untuk periode pelaporan 2025-04-30. Klik ikon tautan untuk melihat riwayat transaksi selengkapnya.
Tingkatkan ke versi premium untuk membuka data premium dan ekspor ke Excel. ![]() .
.
| Keamanan | Ketik | Harga Saham Rata-rata | Saham (MM) |
ΔSaham (%) |
ΔSaham (%) |
Nilai ($MM) |
Portpolyo (%) |
ΔPortofolio (%) |
|
|---|---|---|---|---|---|---|---|---|---|
| MSFT / Microsoft Corporation | 0.00 | 0.96 | 0.62 | -3.85 | 2.3642 | -0.1538 | |||
| MSI / Motorola Solutions, Inc. | 0.00 | 0.97 | 0.55 | -5.17 | 2.0827 | -0.1679 | |||
| CSCO / Cisco Systems, Inc. | 0.01 | 0.97 | 0.52 | -3.85 | 1.9854 | -0.1282 | |||
| TMUS / T-Mobile US, Inc. | 0.00 | 0.96 | 0.52 | 7.01 | 1.9648 | 0.0848 | |||
| PGR / The Progressive Corporation | 0.00 | 0.94 | 0.51 | 15.28 | 1.9442 | 0.2191 | |||
| CB / Chubb Limited | 0.00 | 0.98 | 0.50 | 6.34 | 1.9038 | 0.0690 | |||
| MCD / McDonald's Corporation | 0.00 | 0.98 | 0.49 | 12.02 | 1.8696 | 0.1573 | |||
| ORLY / O'Reilly Automotive, Inc. | 0.00 | -1.41 | 0.49 | 7.64 | 1.8686 | 0.0934 | |||
| VZ / Verizon Communications Inc. | 0.01 | 0.96 | 0.49 | 12.93 | 1.8516 | 0.1727 | |||
| BRK.A / Berkshire Hathaway Inc. | 0.00 | 0.92 | 0.47 | 14.91 | 1.7794 | 0.1925 | |||
| ROP / Roper Technologies, Inc. | 0.00 | 1.00 | 0.45 | -1.73 | 1.7185 | -0.0723 | |||
| VRSN / VeriSign, Inc. | 0.00 | 0.98 | 0.44 | 32.42 | 1.6544 | 0.3759 | |||
| BSX / Boston Scientific Corporation | 0.00 | -20.83 | 0.44 | -20.44 | 1.6521 | -0.4742 | |||
| WMT / Walmart Inc. | 0.00 | 0.97 | 0.42 | 0.24 | 1.5777 | -0.0373 | |||
| WM / Waste Management, Inc. | 0.00 | 0.96 | 0.42 | 7.22 | 1.5742 | 0.0673 | |||
| MMC / Marsh & McLennan Companies, Inc. | 0.00 | 0.94 | 0.41 | 5.10 | 1.5602 | 0.0377 | |||
| AJG / Arthur J. Gallagher & Co. | 0.00 | -19.08 | 0.40 | -14.04 | 1.5081 | -0.2879 | |||
| APH / Amphenol Corporation | 0.01 | 35.33 | 0.39 | 46.97 | 1.4708 | 0.4472 | |||
| CBOE / Cboe Global Markets, Inc. | 0.00 | 0.99 | 0.39 | 9.69 | 1.4584 | 0.0961 | |||
| AWK / American Water Works Company, Inc. | 0.00 | 54.83 | 0.35 | 83.16 | 1.3193 | 0.5795 | |||
| GILD / Gilead Sciences, Inc. | 0.00 | 0.96 | 0.35 | 10.86 | 1.3144 | 0.0982 | |||
| RSG / Republic Services, Inc. | 0.00 | 0.95 | 0.35 | 16.95 | 1.3054 | 0.1602 | |||
| LLY / Eli Lilly and Company | 0.00 | -18.90 | 0.34 | -10.21 | 1.2992 | -0.1808 | |||
| JNJ / Johnson & Johnson | 0.00 | 0.97 | 0.34 | 3.95 | 1.2939 | 0.0166 | |||
| IBM / International Business Machines Corporation | 0.00 | 0.94 | 0.34 | -4.53 | 1.2763 | -0.0927 | |||
| MA / Mastercard Incorporated | 0.00 | 1.01 | 0.33 | -0.30 | 1.2503 | -0.0343 | |||
| CME / CME Group Inc. | 0.00 | 0.94 | 0.33 | 18.48 | 1.2391 | 0.1661 | |||
| AAPL / Apple Inc. | 0.00 | -6.07 | 0.33 | -15.36 | 1.2309 | -0.2594 | |||
| MCK / McKesson Corporation | 0.00 | 19.37 | 0.33 | 43.17 | 1.2297 | 0.3495 | |||
| VRTX / Vertex Pharmaceuticals Incorporated | 0.00 | 0.96 | 0.32 | 11.76 | 1.2221 | 0.0989 | |||
| PG / The Procter & Gamble Company | 0.00 | 0.98 | 0.32 | -1.25 | 1.2018 | -0.0425 | |||
| MRK / Merck & Co., Inc. | 0.00 | 0.96 | 0.30 | -12.93 | 1.1475 | -0.2023 | |||
| BRO / Brown & Brown, Inc. | 0.00 | -11.60 | 0.30 | -6.83 | 1.1382 | -0.1094 | |||
| MO / Altria Group, Inc. | 0.01 | -24.16 | 0.30 | -14.04 | 1.1353 | -0.2182 | |||
| WCN / Waste Connections, Inc. | 0.00 | 0.95 | 0.29 | 8.49 | 1.1156 | 0.0633 | |||
| ABBV / AbbVie Inc. | 0.00 | 0.97 | 0.29 | 7.14 | 1.0784 | 0.0475 | |||
| EA / Electronic Arts Inc. | 0.00 | -12.30 | 0.28 | 3.72 | 1.0567 | 0.0115 | |||
| LMT / Lockheed Martin Corporation | 0.00 | 0.00 | 0.27 | 3.10 | 1.0086 | 0.0078 | |||
| UNH / UnitedHealth Group Incorporated | 0.00 | 30.44 | 0.27 | -1.12 | 1.0071 | -0.0353 | |||
| AMGN / Amgen Inc. | 0.00 | 0.00 | 0.24 | 1.68 | 0.9179 | -0.0042 | |||
| XEL / Xcel Energy Inc. | 0.00 | 0.00 | 0.24 | 5.26 | 0.9102 | 0.0243 | |||
| ADP / Automatic Data Processing, Inc. | 0.00 | 40.19 | 0.23 | 39.26 | 0.8609 | 0.2270 | |||
| ACN / Accenture plc | 0.00 | 36.17 | 0.23 | 6.13 | 0.8522 | 0.0275 | |||
| CL / Colgate-Palmolive Company | 0.00 | 2.48 | 0.22 | 8.91 | 0.8346 | 0.0504 | |||
| AEP / American Electric Power Company, Inc. | 0.00 | 0.00 | 0.21 | 10.53 | 0.7952 | 0.0559 | |||
| TXN / Texas Instruments Incorporated | 0.00 | -33.75 | 0.20 | -42.70 | 0.7739 | -0.6057 | |||
| FI / Fiserv, Inc. | 0.00 | 0.00 | 0.20 | -14.66 | 0.7507 | -0.1491 | |||
| PEP / PepsiCo, Inc. | 0.00 | 0.00 | 0.18 | -10.24 | 0.6981 | -0.0964 | |||
| UGI / UGI Corporation | 0.01 | -15.94 | 0.18 | -10.34 | 0.6920 | -0.0980 | |||
| ORCL / Oracle Corporation | 0.00 | 0.00 | 0.18 | -17.43 | 0.6836 | -0.1623 | |||
| WMB / The Williams Companies, Inc. | 0.00 | 0.00 | 0.18 | 5.88 | 0.6818 | 0.0211 | |||
| GDDY / GoDaddy Inc. | 0.00 | 52.15 | 0.17 | 35.16 | 0.6548 | 0.1572 | |||
| HIG / The Hartford Insurance Group, Inc. | 0.00 | 0.00 | 0.17 | 9.55 | 0.6544 | 0.0451 | |||
| NOC / Northrop Grumman Corporation | 0.00 | 9.94 | 0.17 | 10.26 | 0.6516 | 0.0437 | |||
| MDLZ / Mondelez International, Inc. | 0.00 | -30.83 | 0.16 | -18.91 | 0.6189 | -0.1609 | |||
| TRV / The Travelers Companies, Inc. | 0.00 | 0.00 | 0.16 | 7.95 | 0.6186 | 0.0306 | |||
| KMB / Kimberly-Clark Corporation | 0.00 | 0.00 | 0.16 | 1.25 | 0.6162 | -0.0061 | |||
| AZO / AutoZone, Inc. | 0.00 | 0.00 | 0.16 | 11.81 | 0.6121 | 0.0540 | |||
| NOW / ServiceNow, Inc. | 0.00 | 55.66 | 0.16 | 46.73 | 0.5962 | 0.1780 | |||
| MDT / Medtronic plc | 0.00 | 0.00 | 0.15 | -6.79 | 0.5730 | -0.0557 | |||
| T / AT&T Inc. | 0.01 | 71.85 | 0.15 | 101.35 | 0.5675 | 0.2778 | |||
| PCG / PG&E Corporation | 0.01 | 0.15 | 0.5655 | 0.5655 | |||||
| NFG / National Fuel Gas Company | 0.00 | 0.00 | 0.14 | 10.00 | 0.5415 | 0.0358 | |||
| KO / The Coca-Cola Company | 0.00 | -10.81 | 0.14 | 2.16 | 0.5391 | -0.0024 | |||
| ICE / Intercontinental Exchange, Inc. | 0.00 | 0.00 | 0.14 | 5.30 | 0.5268 | 0.0135 | |||
| CRM / Salesforce, Inc. | 0.00 | 0.00 | 0.14 | -21.26 | 0.5195 | -0.1569 | |||
| FTNT / Fortinet, Inc. | 0.00 | -95.62 | 0.14 | -94.18 | 0.5135 | 0.2821 | |||
| TDY / Teledyne Technologies Incorporated | 0.00 | 65.71 | 0.14 | 51.69 | 0.5113 | 0.1647 | |||
| DUK / Duke Energy Corporation | 0.00 | 0.00 | 0.13 | 8.94 | 0.5101 | 0.0307 | |||
| YUM / Yum! Brands, Inc. | 0.00 | 116.87 | 0.13 | 151.92 | 0.4975 | 0.2937 | |||
| PNR / Pentair plc | 0.00 | 0.00 | 0.13 | -12.84 | 0.4902 | -0.0834 | |||
| CPRT / Copart, Inc. | 0.00 | 0.00 | 0.13 | 4.92 | 0.4879 | 0.0137 | |||
| SBRA / Sabra Health Care REIT, Inc. | 0.01 | 31.43 | 0.13 | 40.66 | 0.4877 | 0.1320 | |||
| TEL / TE Connectivity plc | 0.00 | 0.00 | 0.13 | -1.55 | 0.4835 | -0.0170 | |||
| ABT / Abbott Laboratories | 0.00 | -24.42 | 0.13 | -23.03 | 0.4823 | -0.1570 | |||
| LNG / Cheniere Energy, Inc. | 0.00 | -25.94 | 0.12 | -23.60 | 0.4669 | -0.1578 | |||
| CMCSA / Comcast Corporation | 0.00 | -10.15 | 0.12 | -29.45 | 0.4364 | -0.2173 | |||
| HSY / The Hershey Company | 0.00 | -21.61 | 0.11 | -11.63 | 0.4314 | -0.0716 | |||
| META / Meta Platforms, Inc. | 0.00 | 0.11 | 0.4258 | 0.4258 | |||||
| TSN / Tyson Foods, Inc. | 0.00 | 50.00 | 0.11 | 63.64 | 0.4108 | 0.1521 | |||
| MELI / MercadoLibre, Inc. | 0.00 | -98.33 | 0.11 | -97.53 | 0.4056 | -0.0091 | |||
| COR / Cencora, Inc. | 0.00 | 28.42 | 0.11 | 48.61 | 0.4053 | 0.1246 | |||
| ELV / Elevance Health, Inc. | 0.00 | 83.94 | 0.11 | 90.91 | 0.4010 | 0.1793 | |||
| GVMXX / State Street Institutional Investment Trust - State Street Institutional US Govt Money Market Fnd Premier Cls | 0.11 | 0.11 | 0.3993 | 0.3993 | |||||
| CDNS / Cadence Design Systems, Inc. | 0.00 | 0.00 | 0.10 | 0.00 | 0.3943 | -0.0093 | |||
| BMY / Bristol-Myers Squibb Company | 0.00 | 0.00 | 0.10 | -15.13 | 0.3852 | -0.0780 | |||
| FICO / Fair Isaac Corporation | 0.00 | 0.00 | 0.10 | 6.45 | 0.3764 | 0.0135 | |||
| TYL / Tyler Technologies, Inc. | 0.00 | 6.43 | 0.10 | -3.92 | 0.3741 | -0.0245 | |||
| KDP / Keurig Dr Pepper Inc. | 0.00 | 0.00 | 0.10 | 7.78 | 0.3688 | 0.0183 | |||
| POR / Portland General Electric Company | 0.00 | 0.00 | 0.10 | 2.13 | 0.3654 | -0.0001 | |||
| NVDA / NVIDIA Corporation | 0.00 | 98.82 | 0.09 | 82.00 | 0.3474 | 0.1502 | |||
| PM / Philip Morris International Inc. | 0.00 | 0.00 | 0.09 | 30.43 | 0.3443 | 0.0764 | |||
| KEYS / Keysight Technologies, Inc. | 0.00 | 0.00 | 0.09 | -18.18 | 0.3405 | -0.0872 | |||
| KR / The Kroger Co. | 0.00 | 0.00 | 0.09 | 17.11 | 0.3382 | 0.0426 | |||
| EVRG / Evergy, Inc. | 0.00 | -27.55 | 0.09 | -21.93 | 0.3375 | -0.1055 | |||
| PAYX / Paychex, Inc. | 0.00 | -35.05 | 0.09 | -35.77 | 0.3362 | -0.1958 | |||
| CSX / CSX Corporation | 0.00 | 0.00 | 0.09 | -14.56 | 0.3335 | -0.0664 | |||
| SO / The Southern Company | 0.00 | 0.00 | 0.09 | 8.75 | 0.3320 | 0.0214 | |||
| ADBE / Adobe Inc. | 0.00 | 0.00 | 0.09 | -13.86 | 0.3306 | -0.0643 | |||
| FFIV / F5, Inc. | 0.00 | 0.09 | 0.3305 | 0.3305 | |||||
| CVLT / Commvault Systems, Inc. | 0.00 | -47.80 | 0.08 | -45.03 | 0.3149 | -0.2737 | |||
| FCNCA / First Citizens BancShares, Inc. | 0.00 | 0.00 | 0.08 | -19.80 | 0.3096 | -0.0833 | |||
| V / Visa Inc. | 0.00 | -31.64 | 0.08 | -30.70 | 0.2993 | -0.1443 | |||
| ACGL / Arch Capital Group Ltd. | 0.00 | 0.00 | 0.08 | -2.56 | 0.2902 | -0.0148 | |||
| L / Loews Corporation | 0.00 | 0.00 | 0.07 | 1.39 | 0.2782 | -0.0021 | |||
| CTVA / Corteva, Inc. | 0.00 | 0.00 | 0.07 | -5.19 | 0.2779 | -0.0217 | |||
| VRSK / Verisk Analytics, Inc. | 0.00 | 0.00 | 0.07 | 2.90 | 0.2714 | 0.0019 | |||
| GOOG / Alphabet Inc. | 0.00 | 46.51 | 0.07 | 14.75 | 0.2684 | 0.0287 | |||
| HWM / Howmet Aerospace Inc. | 0.00 | -63.40 | 0.07 | -60.12 | 0.2627 | -0.4087 | |||
| FANG / Diamondback Energy, Inc. | 0.00 | 43.29 | 0.07 | 7.81 | 0.2612 | 0.0039 | |||
| XOM / Exxon Mobil Corporation | 0.00 | 0.00 | 0.07 | -1.45 | 0.2602 | -0.0093 | |||
| TW / Tradeweb Markets Inc. | 0.00 | 0.07 | 0.2580 | 0.2580 | |||||
| GEN / Gen Digital Inc. | 0.00 | 0.00 | 0.07 | -4.29 | 0.2561 | -0.0167 | |||
| INCY / Incyte Corporation | 0.00 | 0.00 | 0.07 | -15.38 | 0.2513 | -0.0532 | |||
| NEM / Newmont Corporation | 0.00 | 0.00 | 0.07 | 22.64 | 0.2491 | 0.0423 | |||
| WDAY / Workday, Inc. | 0.00 | 0.00 | 0.06 | -7.25 | 0.2447 | -0.0233 | |||
| EXEL / Exelixis, Inc. | 0.00 | -53.45 | 0.06 | -44.83 | 0.2422 | -0.2089 | |||
| CHD / Church & Dwight Co., Inc. | 0.00 | 0.00 | 0.06 | -5.97 | 0.2394 | -0.0210 | |||
| WEC / WEC Energy Group, Inc. | 0.00 | 0.00 | 0.06 | 10.53 | 0.2387 | 0.0172 | |||
| GIS / General Mills, Inc. | 0.00 | 0.00 | 0.06 | -6.15 | 0.2329 | -0.0199 | |||
| ED / Consolidated Edison, Inc. | 0.00 | 0.00 | 0.06 | 19.61 | 0.2329 | 0.0346 | |||
| UBER / Uber Technologies, Inc. | 0.00 | 0.00 | 0.06 | 22.45 | 0.2274 | 0.0353 | |||
| ANET / Arista Networks Inc | 0.00 | 0.00 | 0.06 | -28.05 | 0.2241 | -0.0973 | |||
| CI / The Cigna Group | 0.00 | -99.44 | 0.06 | -99.31 | 0.2238 | -0.6074 | |||
| KMI / Kinder Morgan, Inc. | 0.00 | 0.00 | 0.06 | -4.92 | 0.2229 | -0.0156 | |||
| REGN / Regeneron Pharmaceuticals, Inc. | 0.00 | 0.00 | 0.06 | -10.94 | 0.2175 | -0.0328 | |||
| IEX / IDEX Corporation | 0.00 | 0.00 | 0.06 | -21.92 | 0.2165 | -0.0694 | |||
| HD / The Home Depot, Inc. | 0.00 | 0.00 | 0.06 | -13.85 | 0.2155 | -0.0367 | |||
| TJX / The TJX Companies, Inc. | 0.00 | 6.00 | 0.06 | 7.69 | 0.2152 | 0.0136 | |||
| LIN / Linde plc | 0.00 | 6.19 | 0.05 | 8.00 | 0.2058 | 0.0105 | |||
| VLTO / Veralto Corporation | 0.00 | 6.00 | 0.05 | -1.82 | 0.2050 | -0.0085 | |||
| AVGO / Broadcom Inc. | 0.00 | -72.23 | 0.05 | -75.78 | 0.2046 | -0.6629 | |||
| GGG / Graco Inc. | 0.00 | 0.00 | 0.05 | -3.64 | 0.2035 | -0.0114 | |||
| AKAM / Akamai Technologies, Inc. | 0.00 | -13.05 | 0.05 | -30.26 | 0.2030 | -0.0934 | |||
| PTC / PTC Inc. | 0.00 | 0.00 | 0.05 | -20.00 | 0.1999 | -0.0557 | |||
| AES / The AES Corporation | 0.01 | 21.97 | 0.05 | 11.11 | 0.1920 | 0.0147 | |||
| CDW / CDW Corporation | 0.00 | 6.04 | 0.05 | -15.25 | 0.1920 | -0.0379 | |||
| BKR / Baker Hughes Company | 0.00 | 7.36 | 0.05 | -18.03 | 0.1915 | -0.0468 | |||
| EXPD / Expeditors International of Washington, Inc. | 0.00 | 8.81 | 0.05 | 6.38 | 0.1900 | 0.0052 | |||
| WAT / Waters Corporation | 0.00 | 5.88 | 0.05 | -10.71 | 0.1894 | -0.0295 | |||
| BDX / Becton, Dickinson and Company | 0.00 | 0.00 | 0.05 | -17.24 | 0.1849 | -0.0415 | |||
| TRGP / Targa Resources Corp. | 0.00 | 6.25 | 0.05 | -8.00 | 0.1759 | -0.0193 | |||
| TMO / Thermo Fisher Scientific Inc. | 0.00 | 6.06 | 0.05 | -23.73 | 0.1704 | -0.0588 | |||
| SLB / Schlumberger Limited | 0.00 | 6.70 | 0.04 | -12.50 | 0.1623 | -0.0264 |