Mga Batayang Estadistika
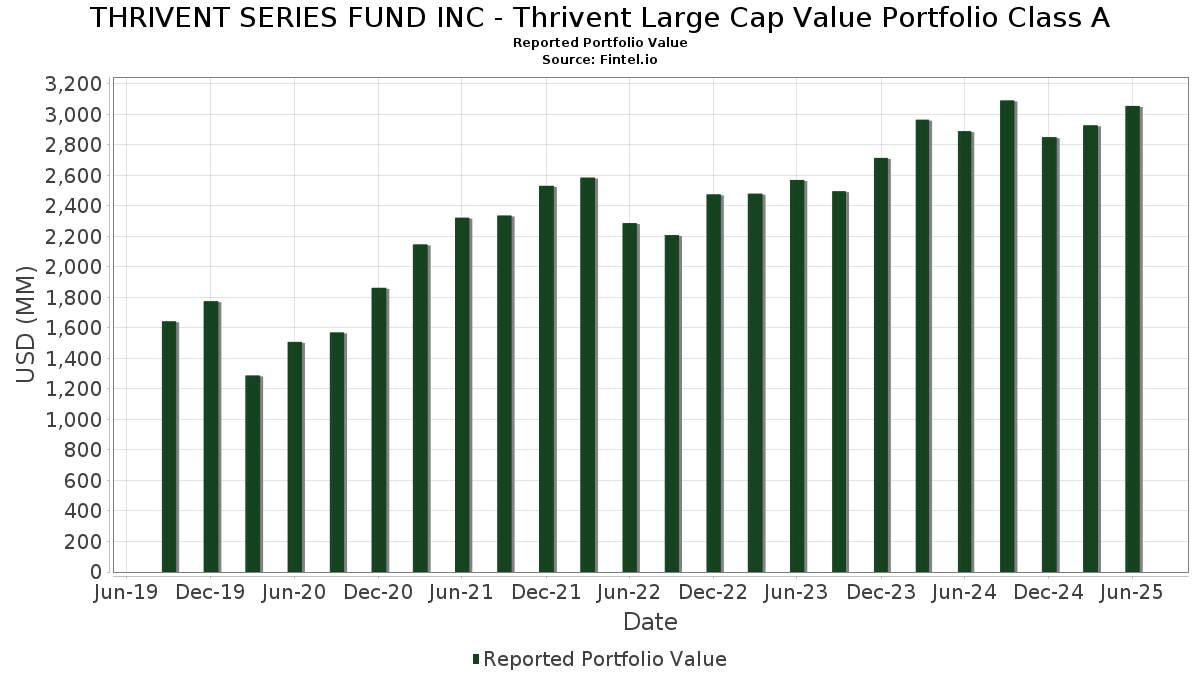
| Nilai Portofolio | $ 3,055,618,487 |
| Posisi Saat Ini | 85 |
Kepemilikan Terbaru, Kinerja, AUM (dari 13F, 13D)
THRIVENT SERIES FUND INC - Thrivent Large Cap Value Portfolio Class A telah mengungkapkan total kepemilikan 85 dalam pengajuan SEC terbaru mereka. Nilai portofolio terbaru dihitung sebesar $ 3,055,618,487 USD. Aset yang Dikelola (AUM) sebenarnya adalah nilai ini ditambah kas (yang tidak diungkapkan). Aset-aset utama THRIVENT SERIES FUND INC - Thrivent Large Cap Value Portfolio Class A adalah Wells Fargo & Company (US:WFC) , Microsoft Corporation (US:MSFT) , Bank of America Corporation (US:BAC) , Exxon Mobil Corporation (US:XOM) , and Capital One Financial Corporation (US:COF) . Posisi baru THRIVENT SERIES FUND INC - Thrivent Large Cap Value Portfolio Class A meliputi: Unilever PLC - Depositary Receipt (Common Stock) (US:UL) , Micron Technology, Inc. (US:MU) , Cencora, Inc. (US:COR) , Crown Holdings, Inc. (US:CCK) , and Keurig Dr Pepper Inc. (US:KDP) .
Peningkatan Tertinggi Kuartal Ini
Kami menggunakan perubahan dalam alokasi portofolio karena ini adalah metrik yang paling bermakna. Perubahan dapat disebabkan oleh perdagangan atau perubahan harga saham.
| Keamanan | Saham (MM) |
Nilai (Juta Dolar AS) |
Portfolio % | ΔPorsyento ng Portfolio |
|---|---|---|---|---|
| 0.56 | 34.42 | 1.1317 | 1.1317 | |
| 0.34 | 71.81 | 2.3612 | 1.1262 | |
| 0.20 | 98.52 | 3.2394 | 1.0885 | |
| 0.21 | 26.39 | 0.8679 | 0.8679 | |
| 0.07 | 21.69 | 0.7133 | 0.7133 | |
| 0.15 | 47.16 | 1.5508 | 0.7087 | |
| 0.19 | 37.58 | 1.2358 | 0.5963 | |
| 16.66 | 16.66 | 0.5480 | 0.5480 | |
| 0.33 | 44.95 | 1.4781 | 0.5324 | |
| 0.75 | 59.06 | 1.9419 | 0.5273 |
Penurunan Tertinggi Kuartal Ini
Kami menggunakan perubahan dalam alokasi portofolio karena ini adalah metrik yang paling bermakna. Perubahan dapat disebabkan oleh perdagangan atau perubahan harga saham.
| Keamanan | Saham (MM) |
Nilai (Juta Dolar AS) |
Portfolio % | ΔPorsyento ng Portfolio |
|---|---|---|---|---|
| 0.13 | 39.85 | 1.3103 | -0.9054 | |
| 0.67 | 46.15 | 1.5174 | -0.7932 | |
| 0.11 | 33.21 | 1.0920 | -0.5485 | |
| 0.26 | 28.95 | 0.9520 | -0.4361 | |
| 0.72 | 77.11 | 2.5355 | -0.3956 | |
| 0.18 | 13.20 | 0.4340 | -0.3866 | |
| 0.42 | 64.39 | 2.1171 | -0.2914 | |
| 0.66 | 21.02 | 0.6911 | -0.2739 | |
| 0.41 | 36.50 | 1.2003 | -0.2716 | |
| 1.59 | 33.30 | 1.0951 | -0.2196 |
Pengajuan 13F dan Dana
Formulir ini diajukan pada 2025-08-27 untuk periode pelaporan 2025-06-30. Klik ikon tautan untuk melihat riwayat transaksi selengkapnya.
Tingkatkan ke versi premium untuk membuka data premium dan ekspor ke Excel. ![]() .
.
| Keamanan | Ketik | Harga Saham Rata-rata | Saham (MM) |
ΔSaham (%) |
ΔSaham (%) |
Nilai ($MM) |
Portpolyo (%) |
ΔPortofolio (%) |
|
|---|---|---|---|---|---|---|---|---|---|
| WFC / Wells Fargo & Company | 1.31 | 0.00 | 105.29 | 11.60 | 3.4621 | 0.2116 | |||
| MSFT / Microsoft Corporation | 0.20 | 19.10 | 98.52 | 57.81 | 3.2394 | 1.0885 | |||
| BAC / Bank of America Corporation | 1.73 | 0.00 | 81.82 | 13.40 | 2.6902 | 0.2043 | |||
| XOM / Exxon Mobil Corporation | 0.72 | 0.00 | 77.11 | -9.36 | 2.5355 | -0.3956 | |||
| COF / Capital One Financial Corporation | 0.34 | 68.83 | 71.81 | 100.33 | 2.3612 | 1.1262 | |||
| JPM / JPMorgan Chase & Co. | 0.24 | 0.00 | 68.35 | 18.19 | 2.2476 | 0.2549 | |||
| JNJ / Johnson & Johnson | 0.42 | 0.00 | 64.39 | -7.89 | 2.1171 | -0.2914 | |||
| SCHW / The Charles Schwab Corporation | 0.66 | 12.69 | 60.50 | 31.35 | 1.9892 | 0.4023 | |||
| MRK / Merck & Co., Inc. | 0.75 | 63.10 | 59.06 | 43.84 | 1.9419 | 0.5273 | |||
| ETR / Entergy Corporation | 0.71 | 0.00 | 58.89 | -2.77 | 1.9365 | -0.1505 | |||
| META / Meta Platforms, Inc. | 0.08 | 0.00 | 58.22 | 28.06 | 1.9145 | 0.3480 | |||
| QCOM / QUALCOMM Incorporated | 0.34 | 14.24 | 54.87 | 18.44 | 1.8041 | 0.2080 | |||
| DUK / Duke Energy Corporation | 0.44 | 0.00 | 51.93 | -3.25 | 1.7076 | -0.1419 | |||
| GVMXX / State Street Institutional Investment Trust - State Street Institutional US Govt Money Market Fnd Premier Cls | 48.74 | 56.04 | 48.74 | 56.05 | 1.6025 | 0.5264 | |||
| GOOG / Alphabet Inc. | 0.27 | 13.92 | 48.57 | 29.36 | 1.5970 | 0.3034 | |||
| SYY / Sysco Corporation | 0.63 | 0.00 | 47.59 | 0.93 | 1.5647 | -0.0597 | |||
| CEG / Constellation Energy Corporation | 0.15 | 20.56 | 47.16 | 92.99 | 1.5508 | 0.7087 | |||
| CSCO / Cisco Systems, Inc. | 0.67 | -38.80 | 46.15 | -31.19 | 1.5174 | -0.7932 | |||
| CF / CF Industries Holdings, Inc. | 0.50 | 18.15 | 45.70 | 39.09 | 1.5027 | 0.3707 | |||
| HON / Honeywell International Inc. | 0.20 | 0.00 | 45.70 | 9.98 | 1.5027 | 0.0710 | |||
| SNX / TD SYNNEX Corporation | 0.33 | 25.47 | 44.95 | 63.78 | 1.4781 | 0.5324 | |||
| NUE / Nucor Corporation | 0.34 | 22.62 | 43.52 | 32.00 | 1.4310 | 0.2950 | |||
| 05935 / Samsung Electronics Co Ltd | 0.98 | 0.00 | 43.43 | 11.54 | 1.4280 | 0.0865 | |||
| EPD / Enterprise Products Partners L.P. - Limited Partnership | 1.39 | 0.00 | 43.04 | -9.17 | 1.4151 | -0.2173 | |||
| LH / Labcorp Holdings Inc. | 0.16 | 37.21 | 42.83 | 54.76 | 1.4083 | 0.4548 | |||
| DAL / Delta Air Lines, Inc. | 0.86 | 33.47 | 42.28 | 50.55 | 1.3902 | 0.4226 | |||
| TSM / Taiwan Semiconductor Manufacturing Company Limited - Depositary Receipt (Common Stock) | 0.18 | 0.00 | 40.60 | 36.44 | 1.3351 | 0.3098 | |||
| UNH / UnitedHealth Group Incorporated | 0.13 | 4.03 | 39.85 | -38.03 | 1.3103 | -0.9054 | |||
| CB / Chubb Limited | 0.14 | 0.00 | 39.65 | -4.06 | 1.3038 | -0.1202 | |||
| CCI / Crown Castle Inc. | 0.37 | 16.36 | 38.10 | 14.69 | 1.2529 | 0.1082 | |||
| VST / Vistra Corp. | 0.19 | 22.70 | 37.58 | 102.48 | 1.2358 | 0.5963 | |||
| COP / ConocoPhillips | 0.41 | 0.00 | 36.50 | -14.55 | 1.2003 | -0.2716 | |||
| CNH / CNH Industrial N.V. | 2.81 | 0.00 | 36.41 | 5.54 | 1.1973 | 0.0086 | |||
| LHX / L3Harris Technologies, Inc. | 0.14 | 0.00 | 36.09 | 19.84 | 1.1865 | 0.1491 | |||
| SNY / Sanofi - Depositary Receipt (Common Stock) | 0.72 | 7.92 | 34.98 | -5.99 | 1.1503 | -0.1318 | |||
| PEG / Public Service Enterprise Group Incorporated | 0.41 | 0.00 | 34.82 | 2.28 | 1.1450 | -0.0280 | |||
| DHI / D.R. Horton, Inc. | 0.27 | 70.85 | 34.70 | 73.25 | 1.1410 | 0.4509 | |||
| UL / Unilever PLC - Depositary Receipt (Common Stock) | 0.56 | 34.42 | 1.1317 | 1.1317 | |||||
| LOW / Lowe's Companies, Inc. | 0.15 | 0.00 | 34.37 | -4.87 | 1.1301 | -0.1147 | |||
| BK / The Bank of New York Mellon Corporation | 0.37 | 0.00 | 34.08 | 8.63 | 1.1205 | 0.0397 | |||
| KVUE / Kenvue Inc. | 1.59 | 0.00 | 33.30 | -12.72 | 1.0951 | -0.2196 | |||
| IBM / International Business Machines Corporation | 0.11 | -41.16 | 33.21 | -30.25 | 1.0920 | -0.5485 | |||
| CMCSA / Comcast Corporation | 0.92 | 0.00 | 32.74 | -3.28 | 1.0767 | -0.0897 | |||
| MET / MetLife, Inc. | 0.41 | 0.00 | 32.57 | 0.16 | 1.0710 | -0.0494 | |||
| ICE / Intercontinental Exchange, Inc. | 0.18 | 0.00 | 32.12 | 6.36 | 1.0561 | 0.0157 | |||
| GD / General Dynamics Corporation | 0.11 | -12.15 | 31.74 | -6.01 | 1.0436 | -0.1198 | |||
| ZBH / Zimmer Biomet Holdings, Inc. | 0.34 | 8.45 | 31.26 | -12.60 | 1.0278 | -0.2044 | |||
| BKNG / Booking Holdings Inc. | 0.01 | 0.00 | 31.07 | 25.66 | 1.0217 | 0.1698 | |||
| CI / The Cigna Group | 0.09 | 0.00 | 31.01 | 0.48 | 1.0198 | -0.0437 | |||
| AIG / American International Group, Inc. | 0.36 | 0.00 | 30.66 | -1.55 | 1.0081 | -0.0649 | |||
| SONY / Sony Group Corporation - Depositary Receipt (Common Stock) | 1.17 | 0.00 | 30.52 | 2.52 | 1.0036 | -0.0221 | |||
| KEY / KeyCorp | 1.75 | 0.00 | 30.42 | 8.94 | 1.0001 | 0.0382 | |||
| FCNCA / First Citizens BancShares, Inc. | 0.02 | 12.12 | 29.77 | 18.31 | 0.9790 | 0.1119 | |||
| GILD / Gilead Sciences, Inc. | 0.26 | -27.37 | 28.95 | -28.14 | 0.9520 | -0.4361 | |||
| WBD / Warner Bros. Discovery, Inc. | 2.49 | 58.23 | 28.57 | 69.00 | 0.9394 | 0.3569 | |||
| CTVA / Corteva, Inc. | 0.36 | 0.00 | 26.75 | 18.44 | 0.8796 | 0.1014 | |||
| MU / Micron Technology, Inc. | 0.21 | 26.39 | 0.8679 | 0.8679 | |||||
| J / Jacobs Solutions Inc. | 0.20 | 0.00 | 26.06 | 8.74 | 0.8569 | 0.0311 | |||
| CSX / CSX Corporation | 0.80 | 0.00 | 26.04 | 10.87 | 0.8563 | 0.0470 | |||
| HR / Healthcare Realty Trust Incorporated | 1.64 | 14.15 | 26.00 | 7.12 | 0.8548 | 0.0187 | |||
| UPS / United Parcel Service, Inc. | 0.24 | 0.00 | 23.92 | -8.23 | 0.7866 | -0.1115 | |||
| FLS / Flowserve Corporation | 0.45 | -21.27 | 23.69 | -15.61 | 0.7790 | -0.1882 | |||
| HXL / Hexcel Corporation | 0.41 | 77.94 | 23.40 | 83.57 | 0.7695 | 0.3302 | |||
| MPC / Marathon Petroleum Corporation | 0.14 | 0.00 | 23.37 | 14.01 | 0.7686 | 0.0622 | |||
| CBRE / CBRE Group, Inc. | 0.17 | 0.00 | 23.31 | 7.14 | 0.7666 | 0.0169 | |||
| ALL / The Allstate Corporation | 0.11 | 0.00 | 22.92 | -2.78 | 0.7537 | -0.0586 | |||
| COR / Cencora, Inc. | 0.07 | 21.69 | 0.7133 | 0.7133 | |||||
| WH / Wyndham Hotels & Resorts, Inc. | 0.26 | 32.23 | 21.39 | 18.65 | 0.7032 | 0.0821 | |||
| DVN / Devon Energy Corporation | 0.66 | -11.77 | 21.02 | -24.95 | 0.6911 | -0.2739 | |||
| JBHT / J.B. Hunt Transport Services, Inc. | 0.15 | 0.00 | 20.90 | -2.94 | 0.6873 | -0.0547 | |||
| CAT / Caterpillar Inc. | 0.05 | 0.00 | 20.10 | 17.71 | 0.6608 | 0.0726 | |||
| APTV / Aptiv PLC | 0.28 | 0.00 | 18.85 | 14.66 | 0.6200 | 0.0534 | |||
| SHEL / Shell plc - Depositary Receipt (Common Stock) | 0.26 | 0.00 | 18.20 | -3.92 | 0.5985 | -0.0542 | |||
| Thrivent Cash Management Trust / STIV (N/A) | 16.66 | 16.66 | 0.5480 | 0.5480 | |||||
| CCK / Crown Holdings, Inc. | 0.14 | 14.82 | 0.4874 | 0.4874 | |||||
| HAL / Halliburton Company | 0.73 | 13.50 | 14.79 | -8.83 | 0.4863 | -0.0726 | |||
| COTY / Coty Inc. | 3.04 | 0.00 | 14.14 | -14.99 | 0.4649 | -0.1081 | |||
| AMTM / Amentum Holdings, Inc. | 0.59 | 2.07 | 14.03 | 32.41 | 0.4614 | 0.0963 | |||
| KDP / Keurig Dr Pepper Inc. | 0.42 | 13.78 | 0.4531 | 0.4531 | |||||
| MMC / Marsh & McLennan Companies, Inc. | 0.06 | 0.00 | 13.68 | -10.40 | 0.4497 | -0.0762 | |||
| BMRN / BioMarin Pharmaceutical Inc. | 0.24 | 18.52 | 13.32 | -7.84 | 0.4379 | -0.0600 | |||
| EMN / Eastman Chemical Company | 0.18 | -34.60 | 13.20 | -44.58 | 0.4340 | -0.3866 | |||
| AVB / AvalonBay Communities, Inc. | 0.06 | 0.00 | 12.99 | -5.18 | 0.4272 | -0.0449 | |||
| AVTR / Avantor, Inc. | 0.82 | 0.00 | 11.06 | -16.97 | 0.3637 | -0.0953 | |||
| COLM / Columbia Sportswear Company | 0.14 | 0.00 | 8.65 | -19.30 | 0.2846 | -0.0849 |