Mga Batayang Estadistika
| Nilai Portofolio | $ 1,391,559,896 |
| Posisi Saat Ini | 356 |
Kepemilikan Terbaru, Kinerja, AUM (dari 13F, 13D)
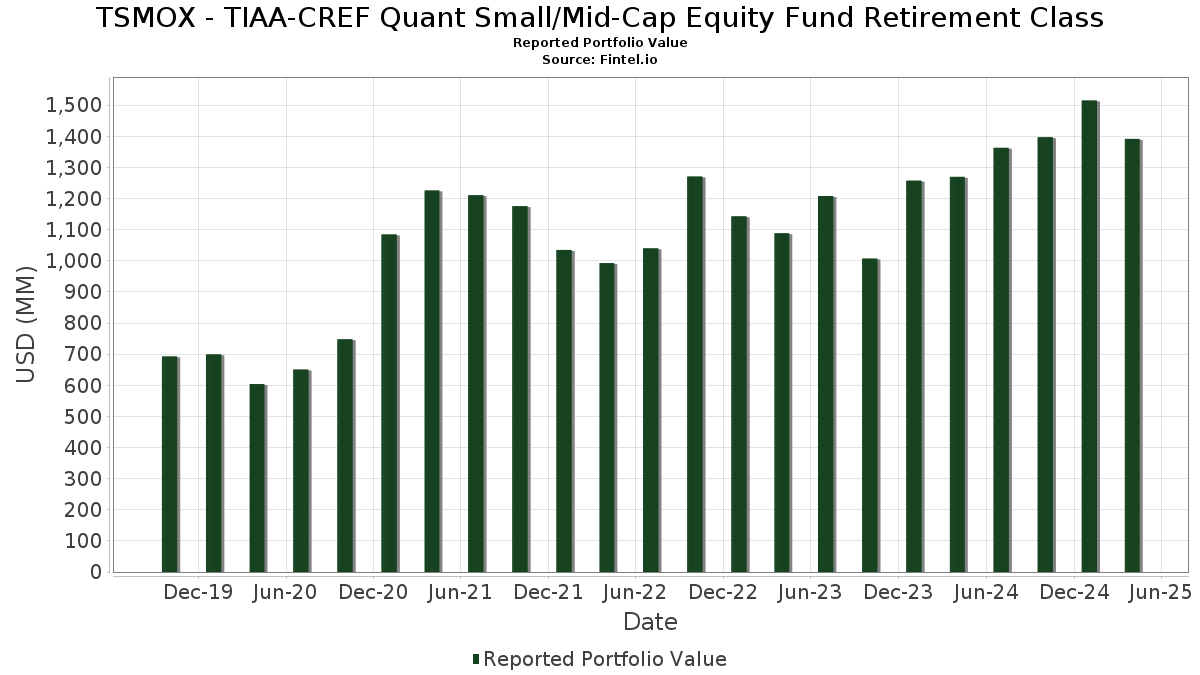
TSMOX - TIAA-CREF Quant Small/Mid-Cap Equity Fund Retirement Class telah mengungkapkan total kepemilikan 356 dalam pengajuan SEC terbaru mereka. Nilai portofolio terbaru dihitung sebesar $ 1,391,559,896 USD. Aset yang Dikelola (AUM) sebenarnya adalah nilai ini ditambah kas (yang tidak diungkapkan). Aset-aset utama TSMOX - TIAA-CREF Quant Small/Mid-Cap Equity Fund Retirement Class adalah Robinhood Markets, Inc. (US:HOOD) , Natera, Inc. (US:NTRA) , EQT Corporation (US:EQT) , NRG Energy, Inc. (US:NRG) , and Comfort Systems USA, Inc. (US:FIX) . Posisi baru TSMOX - TIAA-CREF Quant Small/Mid-Cap Equity Fund Retirement Class meliputi: The Mosaic Company (US:MOS) , Balchem Corporation (DE:BL9B) , Invesco Ltd. (MX:IVZ N) , Lithia Motors, Inc. (US:LAD) , and Penske Automotive Group, Inc. (US:PAG) .
Peningkatan Tertinggi Kuartal Ini
Kami menggunakan perubahan dalam alokasi portofolio karena ini adalah metrik yang paling bermakna. Perubahan dapat disebabkan oleh perdagangan atau perubahan harga saham.
| Keamanan | Saham (MM) |
Nilai (Juta Dolar AS) |
Portfolio % | ΔPorsyento ng Portfolio |
|---|---|---|---|---|
| 0.24 | 7.28 | 0.5226 | 0.5226 | |
| 6.30 | 0.4518 | 0.4518 | ||
| 0.25 | 4.96 | 0.3562 | 0.3562 | |
| 0.03 | 4.61 | 0.3310 | 0.3310 | |
| 0.33 | 4.60 | 0.3298 | 0.3298 | |
| 0.01 | 4.24 | 0.3044 | 0.3044 | |
| 0.03 | 4.18 | 0.2997 | 0.2997 | |
| 0.97 | 4.14 | 0.2969 | 0.2969 | |
| 0.25 | 4.12 | 0.2959 | 0.2959 | |
| 0.07 | 5.56 | 0.3991 | 0.2952 |
Penurunan Tertinggi Kuartal Ini
Kami menggunakan perubahan dalam alokasi portofolio karena ini adalah metrik yang paling bermakna. Perubahan dapat disebabkan oleh perdagangan atau perubahan harga saham.
| Keamanan | Saham (MM) |
Nilai (Juta Dolar AS) |
Portfolio % | ΔPorsyento ng Portfolio |
|---|---|---|---|---|
| 0.05 | 2.19 | 0.1572 | -0.3901 | |
| 0.03 | 3.81 | 0.2732 | -0.3713 | |
| 0.13 | 4.47 | 0.3205 | -0.3453 | |
| 0.06 | 1.94 | 0.1390 | -0.3393 | |
| 0.15 | 6.51 | 0.4674 | -0.3268 | |
| 0.00 | 0.00 | -0.2910 | ||
| 0.01 | 1.26 | 0.0901 | -0.2826 | |
| 0.00 | 1.49 | 0.1068 | -0.2621 | |
| 0.04 | 1.58 | 0.1133 | -0.2573 | |
| 0.02 | 1.53 | 0.1101 | -0.2463 |
Pengajuan 13F dan Dana
Formulir ini diajukan pada 2025-06-26 untuk periode pelaporan 2025-04-30. Klik ikon tautan untuk melihat riwayat transaksi selengkapnya.
Tingkatkan ke versi premium untuk membuka data premium dan ekspor ke Excel. ![]() .
.
| Keamanan | Ketik | Harga Saham Rata-rata | Saham (MM) |
ΔSaham (%) |
ΔSaham (%) |
Nilai ($MM) |
Portpolyo (%) |
ΔPortofolio (%) |
|
|---|---|---|---|---|---|---|---|---|---|
| HOOD / Robinhood Markets, Inc. | 0.38 | 5.03 | 18.43 | -0.71 | 1.3226 | 0.0917 | |||
| NTRA / Natera, Inc. | 0.09 | 5.03 | 13.33 | -10.40 | 0.9563 | -0.0299 | |||
| EQT / EQT Corporation | 0.24 | 14.92 | 11.99 | 11.15 | 0.8604 | 0.1450 | |||
| NRG / NRG Energy, Inc. | 0.11 | 5.03 | 11.86 | 12.34 | 0.8509 | 0.1510 | |||
| FIX / Comfort Systems USA, Inc. | 0.03 | 5.03 | 11.46 | -4.41 | 0.8222 | 0.0275 | |||
| NTNX / Nutanix, Inc. | 0.15 | -1.30 | 10.63 | -1.39 | 0.7626 | 0.0479 | |||
| VTWO / Vanguard Scottsdale Funds - Vanguard Russell 2000 ETF | 0.13 | 27.88 | 10.47 | 9.94 | 0.7515 | 0.1199 | |||
| VB / Vanguard Index Funds - Vanguard Small-Cap ETF | 0.05 | 28.34 | 10.38 | 11.13 | 0.7445 | 0.1254 | |||
| SOFI / SoFi Technologies, Inc. | 0.80 | 5.03 | 9.97 | -16.74 | 0.7157 | -0.0786 | |||
| BRBR / BellRing Brands, Inc. | 0.13 | 5.03 | 9.96 | 4.74 | 0.7144 | 0.0841 | |||
| EME / EMCOR Group, Inc. | 0.02 | 5.01 | 9.32 | -6.09 | 0.6689 | 0.0107 | |||
| PRMB / Primo Brands Corporation | 0.27 | 5.03 | 8.98 | 6.00 | 0.6442 | 0.0826 | |||
| RGLD / Royal Gold, Inc. | 0.05 | 5.03 | 8.78 | 37.25 | 0.6301 | 0.2058 | |||
| CW / Curtiss-Wright Corporation | 0.02 | 15.03 | 8.32 | 14.34 | 0.5967 | 0.1145 | |||
| ALLE / Allegion plc | 0.06 | 13.89 | 8.28 | 19.44 | 0.5938 | 0.1344 | |||
| CRS / Carpenter Technology Corporation | 0.04 | -30.60 | 8.24 | -29.69 | 0.5912 | -0.1857 | |||
| TPR / Tapestry, Inc. | 0.12 | -27.84 | 8.20 | 31.45 | 0.5885 | 0.0781 | |||
| ITT / ITT Inc. | 0.06 | 5.03 | 8.01 | -4.71 | 0.5747 | 0.0174 | |||
| EXEL / Exelixis, Inc. | 0.20 | -5.00 | 8.01 | 12.19 | 0.5744 | 0.1013 | |||
| FTI / TechnipFMC plc | 0.28 | 5.03 | 7.95 | -1.55 | 0.5702 | 0.0350 | |||
| REG / Regency Centers Corporation | 0.11 | 5.02 | 7.94 | 5.53 | 0.5696 | 0.0708 | |||
| CVLT / Commvault Systems, Inc. | 0.05 | 5.02 | 7.90 | 10.21 | 0.5671 | 0.0916 | |||
| FHN / First Horizon Corporation | 0.43 | 5.03 | 7.76 | -13.26 | 0.5572 | -0.0363 | |||
| PKG / Packaging Corporation of America | 0.04 | -8.39 | 7.72 | -20.04 | 0.5539 | -0.0863 | |||
| HALO / Halozyme Therapeutics, Inc. | 0.13 | 5.03 | 7.71 | 13.91 | 0.5531 | 0.1043 | |||
| ELS / Equity LifeStyle Properties, Inc. | 0.12 | 22.85 | 7.65 | 21.60 | 0.5486 | 0.1317 | |||
| KD / Kyndryl Holdings, Inc. | 0.23 | 5.03 | 7.58 | -10.31 | 0.5438 | -0.0164 | |||
| CCK / Crown Holdings, Inc. | 0.08 | 5.04 | 7.57 | 15.16 | 0.5429 | 0.1073 | |||
| MOS / The Mosaic Company | 0.24 | 7.28 | 0.5226 | 0.5226 | |||||
| ORI / Old Republic International Corporation | 0.19 | 5.03 | 7.18 | 7.97 | 0.5155 | 0.0743 | |||
| COMP / Compass, Inc. | 0.93 | 5.03 | 7.14 | 11.84 | 0.5125 | 0.0890 | |||
| CR / Crane Company | 0.04 | 5.03 | 7.13 | -0.74 | 0.5117 | 0.0354 | |||
| AXS / AXIS Capital Holdings Limited | 0.07 | 5.03 | 7.10 | 11.15 | 0.5094 | 0.0859 | |||
| USFD / US Foods Holding Corp. | 0.11 | 19.96 | 7.04 | 11.05 | 0.5049 | 0.0847 | |||
| MWA / Mueller Water Products, Inc. | 0.26 | 5.03 | 6.95 | 19.84 | 0.4988 | 0.1141 | |||
| BLD / TopBuild Corp. | 0.02 | -4.25 | 6.86 | -17.36 | 0.4921 | -0.0582 | |||
| CHRW / C.H. Robinson Worldwide, Inc. | 0.08 | 5.03 | 6.80 | -5.82 | 0.4878 | 0.0092 | |||
| PNW / Pinnacle West Capital Corporation | 0.07 | 5.03 | 6.68 | 14.94 | 0.4791 | 0.0940 | |||
| NYT / The New York Times Company | 0.13 | 5.03 | 6.52 | 0.71 | 0.4680 | 0.0385 | |||
| CRDO / Credo Technology Group Holding Ltd | 0.15 | -11.55 | 6.51 | -45.62 | 0.4674 | -0.3268 | |||
| PRI / Primerica, Inc. | 0.02 | 5.03 | 6.51 | -5.14 | 0.4671 | 0.0121 | |||
| UNFI / United Natural Foods, Inc. | 0.24 | 5.03 | 6.42 | -5.67 | 0.4606 | 0.0094 | |||
| QGEN / Qiagen N.V. | 0.15 | 5.03 | 6.41 | 0.58 | 0.4598 | 0.0374 | |||
| OSCR / Oscar Health, Inc. | 0.49 | 5.03 | 6.35 | -17.68 | 0.4556 | -0.0559 | |||
| ADMA / ADMA Biologics, Inc. | 0.27 | 5.03 | 6.32 | 54.76 | 0.4537 | 0.1828 | |||
| BK / The Bank of New York Mellon Corporation - Depositary Receipt (Common Stock) | 6.30 | 0.4518 | 0.4518 | ||||||
| AIT / Applied Industrial Technologies, Inc. | 0.03 | -7.71 | 6.29 | -13.65 | 0.4516 | -0.0317 | |||
| BRX / Brixmor Property Group Inc. | 0.25 | 19.12 | 6.28 | 13.86 | 0.4508 | 0.0849 | |||
| GL / Globe Life Inc. | 0.05 | -11.86 | 6.26 | -10.97 | 0.4492 | -0.0170 | |||
| DOCS / Doximity, Inc. | 0.11 | 5.03 | 6.25 | 1.08 | 0.4485 | 0.0385 | |||
| THC / Tenet Healthcare Corporation | 0.04 | 5.04 | 6.20 | 6.59 | 0.4448 | 0.0591 | |||
| DOX / Amdocs Limited | 0.07 | 5.03 | 6.20 | 5.50 | 0.4445 | 0.0552 | |||
| GMED / Globus Medical, Inc. | 0.09 | 5.03 | 6.16 | -18.70 | 0.4422 | -0.0604 | |||
| ADC / Agree Realty Corporation | 0.08 | 144.00 | 6.15 | 160.98 | 0.4416 | 0.2852 | |||
| PTCT / PTC Therapeutics, Inc. | 0.12 | 5.03 | 6.11 | 14.10 | 0.4384 | 0.0833 | |||
| MANH / Manhattan Associates, Inc. | 0.03 | 5.04 | 6.10 | -10.67 | 0.4380 | -0.0151 | |||
| MKTX / MarketAxess Holdings Inc. | 0.03 | 205.32 | 6.10 | 200.00 | 0.4379 | 0.2715 | |||
| VIRT / Virtu Financial, Inc. | 0.16 | 5.03 | 6.08 | 2.65 | 0.4364 | 0.0435 | |||
| PRIM / Primoris Services Corporation | 0.10 | 5.02 | 6.02 | -17.97 | 0.4318 | -0.0546 | |||
| NVT / nVent Electric plc | 0.11 | 5.03 | 5.92 | -11.40 | 0.4251 | -0.0182 | |||
| URBN / Urban Outfitters, Inc. | 0.11 | 5.04 | 5.90 | 0.03 | 0.4235 | 0.0323 | |||
| RELY / Remitly Global, Inc. | 0.29 | 5.03 | 5.90 | -9.63 | 0.4234 | -0.0095 | |||
| EXLS / ExlService Holdings, Inc. | 0.12 | 89.33 | 5.86 | 82.61 | 0.4205 | 0.2078 | |||
| FR / First Industrial Realty Trust, Inc. | 0.12 | 5.03 | 5.84 | -6.40 | 0.4188 | 0.0053 | |||
| FN / Fabrinet | 0.03 | 5.03 | 5.66 | -0.39 | 0.4058 | 0.0293 | |||
| WH / Wyndham Hotels & Resorts, Inc. | 0.07 | 336.86 | 5.56 | 254.95 | 0.3991 | 0.2952 | |||
| US21871X1090 / Corebridge Financial, Inc. | 0.19 | -12.47 | 5.55 | -23.19 | 0.3981 | -0.0808 | |||
| G / Genpact Limited | 0.11 | 145.74 | 5.54 | 153.66 | 0.3976 | 0.2527 | |||
| SIGI / Selective Insurance Group, Inc. | 0.06 | 5.02 | 5.51 | 8.89 | 0.3955 | 0.0599 | |||
| CNO / CNO Financial Group, Inc. | 0.14 | 5.03 | 5.47 | -0.22 | 0.3925 | 0.0290 | |||
| FLS / Flowserve Corporation | 0.12 | 5.03 | 5.38 | -24.15 | 0.3864 | -0.0843 | |||
| OGS / ONE Gas, Inc. | 0.07 | 5.03 | 5.36 | 16.71 | 0.3849 | 0.0802 | |||
| TTEK / Tetra Tech, Inc. | 0.17 | 5.03 | 5.36 | -10.97 | 0.3848 | -0.0147 | |||
| SPXC / SPX Technologies, Inc. | 0.04 | 13.73 | 5.34 | 2.71 | 0.3835 | 0.0385 | |||
| LTH / Life Time Group Holdings, Inc. | 0.17 | 5.03 | 5.34 | 11.08 | 0.3833 | 0.0644 | |||
| CHEF / The Chefs' Warehouse, Inc. | 0.09 | 5.03 | 5.34 | 11.12 | 0.3830 | 0.0644 | |||
| ALKS / Alkermes plc | 0.19 | 5.03 | 5.33 | -4.16 | 0.3823 | 0.0137 | |||
| BBWI / Bath & Body Works, Inc. | 0.17 | 5.03 | 5.32 | -14.80 | 0.3814 | -0.0323 | |||
| JAZZ / Jazz Pharmaceuticals plc | 0.05 | 44.07 | 5.30 | 35.50 | 0.3805 | 0.1210 | |||
| AFG / American Financial Group, Inc. | 0.04 | 13.91 | 5.30 | 5.66 | 0.3803 | 0.0477 | |||
| ESAB / ESAB Corporation | 0.04 | -9.80 | 5.30 | -12.50 | 0.3802 | -0.0213 | |||
| VCYT / Veracyte, Inc. | 0.17 | 5.03 | 5.29 | -29.56 | 0.3797 | -0.1185 | |||
| PB / Prosperity Bancshares, Inc. | 0.08 | 5.03 | 5.23 | -10.86 | 0.3753 | -0.0137 | |||
| SANM / Sanmina Corporation | 0.07 | 5.03 | 5.21 | -3.68 | 0.3740 | 0.0152 | |||
| HWC / Hancock Whitney Corporation | 0.10 | 5.03 | 5.15 | -8.41 | 0.3698 | -0.0033 | |||
| BCRX / BioCryst Pharmaceuticals, Inc. | 0.58 | 5.03 | 5.11 | 17.66 | 0.3668 | 0.0787 | |||
| OPCH / Option Care Health, Inc. | 0.16 | 11.37 | 5.09 | 20.39 | 0.3652 | 0.0321 | |||
| ESE / ESCO Technologies Inc. | 0.03 | 22.52 | 5.06 | 44.44 | 0.3634 | 0.1308 | |||
| OSK / Oshkosh Corporation | 0.06 | 5.03 | 5.05 | -24.42 | 0.3626 | -0.0807 | |||
| ITRI / Itron, Inc. | 0.04 | 5.05 | 5.00 | 8.90 | 0.3591 | 0.0544 | |||
| YOU / Clear Secure, Inc. | 0.20 | 5.03 | 5.00 | 9.50 | 0.3590 | 0.0561 | |||
| FBP / First BanCorp. | 0.25 | 4.96 | 0.3562 | 0.3562 | |||||
| WGS / GeneDx Holdings Corp. | 0.07 | -5.01 | 4.92 | -15.17 | 0.3532 | -0.0315 | |||
| US60471A1016 / Mirion Technologies, Inc. | 0.31 | 5.03 | 4.88 | 4.63 | 0.3501 | 0.0409 | |||
| SBRA / Sabra Health Care REIT, Inc. | 0.27 | 5.03 | 4.86 | 12.19 | 0.3487 | 0.0615 | |||
| ABCB / Ameris Bancorp | 0.08 | 5.03 | 4.82 | -6.26 | 0.3461 | 0.0050 | |||
| BOX / Box, Inc. | 0.15 | 117.95 | 4.81 | 103.81 | 0.3451 | 0.1886 | |||
| US4039491000 / HF Sinclair Corp. | 0.16 | 32.73 | 4.78 | 10.62 | 0.3432 | 0.0565 | |||
| FSS / Federal Signal Corporation | 0.06 | 5.03 | 4.78 | -13.00 | 0.3429 | -0.0213 | |||
| UPST / Upstart Holdings, Inc. | 0.10 | -8.48 | 4.77 | -32.44 | 0.3420 | -0.1257 | |||
| FHB / First Hawaiian, Inc. | 0.20 | 5.03 | 4.68 | -13.07 | 0.3355 | -0.0211 | |||
| BL9B / Balchem Corporation | 0.03 | 4.61 | 0.3310 | 0.3310 | |||||
| NTB / The Bank of N.T. Butterfield & Son Limited | 0.11 | 5.04 | 4.60 | 15.03 | 0.3301 | 0.0649 | |||
| IVZ N / Invesco Ltd. | 0.33 | 4.60 | 0.3298 | 0.3298 | |||||
| BTSG / BrightSpring Health Services, Inc. | 0.26 | 5.03 | 4.59 | -22.00 | 0.3296 | -0.0608 | |||
| HL / Hecla Mining Company | 0.80 | 5.03 | 4.57 | 5.77 | 0.3278 | 0.0414 | |||
| EAT / Brinker International, Inc. | 0.03 | 27.30 | 4.56 | 156.00 | 0.3274 | 0.1958 | |||
| NWE / NorthWestern Energy Group, Inc. | 0.08 | 108.69 | 4.56 | 125.42 | 0.3271 | 0.1930 | |||
| CNM / Core & Main, Inc. | 0.09 | 5.02 | 4.55 | -1.96 | 0.3263 | 0.0187 | |||
| ESI / Element Solutions Inc | 0.22 | 5.03 | 4.52 | -16.93 | 0.3246 | -0.0365 | |||
| GXO / GXO Logistics, Inc. | 0.12 | 14.91 | 4.52 | -8.38 | 0.3240 | -0.0028 | |||
| JHG / Janus Henderson Group plc | 0.14 | 5.03 | 4.51 | -22.38 | 0.3236 | -0.0616 | |||
| LAUR / Laureate Education, Inc. | 0.22 | 5.03 | 4.51 | 12.61 | 0.3236 | 0.0580 | |||
| ARMK / Aramark | 0.13 | 5.04 | 4.48 | -9.76 | 0.3217 | -0.0077 | |||
| PAGS / PagSeguro Digital Ltd. | 0.45 | 55.83 | 4.47 | 94.44 | 0.3211 | 0.1549 | |||
| PLXS / Plexus Corp. | 0.04 | 5.03 | 4.47 | -9.27 | 0.3210 | -0.0059 | |||
| HIMS / Hims & Hers Health, Inc. | 0.13 | -49.90 | 4.47 | -55.52 | 0.3205 | -0.3453 | |||
| AXTA / Axalta Coating Systems Ltd. | 0.14 | 5.03 | 4.47 | -5.02 | 0.3204 | 0.0087 | |||
| DORM / Dorman Products, Inc. | 0.04 | 37.97 | 4.42 | 19.09 | 0.3170 | 0.0710 | |||
| KBR / KBR, Inc. | 0.08 | 5.02 | 4.42 | 1.92 | 0.3170 | 0.0296 | |||
| VVV / Valvoline Inc. | 0.13 | 165.32 | 4.40 | 144.91 | 0.3159 | 0.1967 | |||
| RSI / Rush Street Interactive, Inc. | 0.36 | 5.03 | 4.39 | -12.63 | 0.3153 | -0.0181 | |||
| TNET / TriNet Group, Inc. | 0.06 | 27.12 | 4.35 | 6.64 | 0.3124 | 0.0417 | |||
| NMIH / NMI Holdings, Inc. | 0.12 | 5.03 | 4.33 | -1.64 | 0.3108 | 0.0188 | |||
| LYFT / Lyft, Inc. | 0.35 | 5.03 | 4.30 | -3.82 | 0.3088 | 0.0121 | |||
| MTSI / MACOM Technology Solutions Holdings, Inc. | 0.04 | 5.05 | 4.29 | -17.58 | 0.3081 | -0.0374 | |||
| PAYO / Payoneer Global Inc. | 0.61 | 5.03 | 4.28 | -30.35 | 0.3075 | -0.1004 | |||
| LAD / Lithia Motors, Inc. | 0.01 | 4.24 | 0.3044 | 0.3044 | |||||
| BKU / BankUnited, Inc. | 0.13 | 5.03 | 4.23 | -16.43 | 0.3034 | -0.0321 | |||
| TNL / Travel + Leisure Co. | 0.10 | 5.04 | 4.22 | -15.11 | 0.3031 | -0.0269 | |||
| OFG / OFG Bancorp | 0.11 | 5.04 | 4.19 | -3.21 | 0.3008 | 0.0136 | |||
| KTB / Kontoor Brands, Inc. | 0.07 | 5.03 | 4.18 | -31.22 | 0.3003 | -0.1031 | |||
| CHRD / Chord Energy Corporation | 0.05 | 159.79 | 4.18 | 108.53 | 0.2999 | 0.1670 | |||
| PAG / Penske Automotive Group, Inc. | 0.03 | 4.18 | 0.2997 | 0.2997 | |||||
| MCY / Mercury General Corporation | 0.08 | 209.00 | 4.17 | 175.07 | 0.2993 | 0.1724 | |||
| AGL / agilon health, inc. | 0.97 | 698,647.48 | 4.14 | 0.2969 | 0.2969 | ||||
| CWAN / Clearwater Analytics Holdings, Inc. | 0.18 | 34.00 | 4.13 | 8.23 | 0.2964 | 0.0433 | |||
| EPRT / Essential Properties Realty Trust, Inc. | 0.13 | 5.03 | 4.13 | 5.25 | 0.2964 | 0.0362 | |||
| BNL / Broadstone Net Lease, Inc. | 0.25 | 4.12 | 0.2959 | 0.2959 | |||||
| SKT / Tanger Inc. | 0.13 | 5.03 | 4.09 | 0.84 | 0.2937 | 0.0246 | |||
| ENS / EnerSys | 0.05 | 40.04 | 4.09 | 10.33 | 0.2937 | 0.0199 | |||
| EVRI / Everi Holdings Inc. | 0.29 | 5.03 | 4.09 | 8.21 | 0.2932 | 0.0428 | |||
| FFIN / First Financial Bankshares, Inc. | 0.12 | -9.78 | 4.05 | -18.87 | 0.2907 | -0.0404 | |||
| WCC / WESCO International, Inc. | 0.02 | 54.83 | 4.04 | 36.39 | 0.2902 | 0.0936 | |||
| AVA / Avista Corporation | 0.10 | 4.00 | 0.2868 | 0.2868 | |||||
| DNOW / DNOW Inc. | 0.25 | 23.30 | 3.96 | 31.52 | 0.2842 | 0.0845 | |||
| FELE / Franklin Electric Co., Inc. | 0.05 | 33.69 | 3.95 | 13.60 | 0.2835 | 0.0529 | |||
| RYN / Rayonier Inc. | 0.16 | 3.95 | 0.2835 | 0.2835 | |||||
| AIN / Albany International Corp. | 0.06 | 5.03 | 3.94 | -14.47 | 0.2830 | -0.0228 | |||
| EXAS / Exact Sciences Corporation | 0.09 | -28.18 | 3.93 | -41.52 | 0.2819 | -0.1635 | |||
| IGT / International Game Technology PLC | 0.24 | 27.15 | 3.88 | 22.54 | 0.2785 | 0.0684 | |||
| WEN / The Wendy's Company | 0.31 | 25.51 | 3.88 | 5.81 | 0.2783 | 0.0352 | |||
| HG / Hamilton Insurance Group, Ltd. | 0.21 | 5.03 | 3.87 | 1.57 | 0.2777 | 0.0251 | |||
| MYRG / MYR Group Inc. | 0.03 | 5.01 | 3.87 | -9.26 | 0.2777 | -0.0051 | |||
| CALX / Calix, Inc. | 0.09 | 5.03 | 3.87 | 8.29 | 0.2774 | 0.0407 | |||
| CUBI / Customers Bancorp, Inc. | 0.08 | 5.03 | 3.84 | -7.84 | 0.2758 | -0.0007 | |||
| GFF / Griffon Corporation | 0.06 | 5.03 | 3.84 | -5.58 | 0.2755 | 0.0058 | |||
| PR / Permian Resources Corporation | 0.32 | -15.16 | 3.83 | -31.66 | 0.2751 | -0.0969 | |||
| SLGN / Silgan Holdings Inc. | 0.07 | 5.02 | 3.83 | -1.42 | 0.2746 | 0.0172 | |||
| PGNY / Progyny, Inc. | 0.17 | 65.81 | 3.82 | -0.57 | 0.2742 | -0.0402 | |||
| JBL / Jabil Inc. | 0.03 | -56.59 | 3.81 | -60.83 | 0.2732 | -0.3713 | |||
| LIVN / LivaNova PLC | 0.10 | 21.44 | 3.80 | -10.02 | 0.2725 | -0.0074 | |||
| EXE / Expand Energy Corporation | 0.04 | 117.01 | 3.79 | 122.03 | 0.2720 | 0.1587 | |||
| JNPR / Juniper Networks, Inc. | 0.10 | 5.03 | 3.78 | 9.43 | 0.2715 | 0.0422 | |||
| AAMI / Acadian Asset Management Inc. | 0.14 | 5.03 | 3.78 | 13.55 | 0.2712 | 0.0505 | |||
| TTMI / TTM Technologies, Inc. | 0.19 | 5.03 | 3.78 | -14.49 | 0.2711 | -0.0219 | |||
| SNEX / StoneX Group Inc. | 0.04 | 57.53 | 3.77 | 27.40 | 0.2706 | 0.0743 | |||
| PRVA / Privia Health Group, Inc. | 0.16 | 89.64 | 3.77 | 94.93 | 0.2705 | 0.1422 | |||
| ELME / Elme Communities | 0.24 | 33.51 | 3.73 | 36.24 | 0.2679 | 0.0862 | |||
| AVNT / Avient Corporation | 0.11 | 55.05 | 3.69 | 20.41 | 0.2646 | 0.0615 | |||
| TVTX / Travere Therapeutics, Inc. | 0.18 | 5.03 | 3.69 | 6.81 | 0.2646 | 0.0357 | |||
| KRG / Kite Realty Group Trust | 0.17 | 5.03 | 3.67 | -1.79 | 0.2637 | 0.0156 | |||
| AEO / American Eagle Outfitters, Inc. | 0.35 | 153.37 | 3.66 | 65.28 | 0.2628 | 0.1159 | |||
| CDE / Coeur Mining, Inc. | 0.66 | 5.03 | 3.66 | -11.67 | 0.2623 | -0.0121 | |||
| ACVA / ACV Auctions Inc. | 0.25 | 5.03 | 3.66 | -27.08 | 0.2623 | -0.0701 | |||
| NWSA / News Corporation | 0.13 | -14.80 | 3.65 | -17.83 | 0.2616 | -0.0326 | |||
| TENB / Tenable Holdings, Inc. | 0.12 | 5.03 | 3.64 | -25.49 | 0.2612 | -0.0627 | |||
| MMS / Maximus, Inc. | 0.05 | 5.04 | 3.63 | -6.60 | 0.2602 | 0.0028 | |||
| GRND / Grindr Inc. | 0.16 | 78.10 | 3.61 | 119.32 | 0.2591 | 0.1499 | |||
| CSTM / Constellium SE | 0.35 | 41.72 | 3.59 | 44.32 | 0.2573 | 0.0925 | |||
| ATRC / AtriCure, Inc. | 0.12 | 5.03 | 3.53 | -21.22 | 0.2536 | -0.0438 | |||
| STRA / Strategic Education, Inc. | 0.04 | 5.03 | 3.53 | -12.77 | 0.2529 | -0.0150 | |||
| TGNA / TEGNA Inc. | 0.22 | 5.03 | 3.51 | -6.43 | 0.2516 | 0.0031 | |||
| ESTC / Elastic N.V. | 0.04 | 5.04 | 3.50 | -19.56 | 0.2514 | -0.0375 | |||
| CLI / Mack-Cali Realty Corp. | 0.23 | 5.03 | 3.50 | 2.25 | 0.2509 | 0.0242 | |||
| HAYW / Hayward Holdings, Inc. | 0.26 | 5.03 | 3.50 | -7.02 | 0.2509 | 0.0015 | |||
| RARE / Ultragenyx Pharmaceutical Inc. | 0.09 | 5.04 | 3.47 | -4.85 | 0.2490 | 0.0072 | |||
| ACT / Enact Holdings, Inc. | 0.10 | 5.03 | 3.46 | 11.26 | 0.2481 | 0.0421 | |||
| TWST / Twist Bioscience Corporation | 0.09 | 27.80 | 3.46 | -6.47 | 0.2480 | 0.0029 | |||
| DOLE / Dole plc | 0.23 | 14.65 | 3.45 | 27.89 | 0.2474 | 0.0686 | |||
| PPBI / Pacific Premier Bancorp, Inc. | 0.17 | 5.03 | 3.40 | -17.51 | 0.2438 | -0.0293 | |||
| OFC / Corporate Office Properties Trust | 0.13 | -13.41 | 3.37 | -23.20 | 0.2421 | -0.0492 | |||
| COLD / Americold Realty Trust, Inc. | 0.17 | 5.03 | 3.34 | -7.04 | 0.2399 | 0.0014 | |||
| BHLB / Berkshire Hills Bancorp, Inc. | 0.13 | 16.28 | 3.34 | -1.85 | 0.2399 | 0.0141 | |||
| OSW / OneSpaWorld Holdings Limited | 0.20 | 18.02 | 3.32 | -7.71 | 0.2379 | -0.0004 | |||
| ALHC / Alignment Healthcare, Inc. | 0.19 | 5.03 | 3.31 | 20.94 | 0.2374 | 0.0560 | |||
| IBOC / International Bancshares Corporation | 0.05 | 5.03 | 3.29 | -2.72 | 0.2359 | 0.0119 | |||
| NBHC / National Bank Holdings Corporation | 0.09 | 5.03 | 3.25 | -11.94 | 0.2334 | -0.0115 | |||
| FTDR / Frontdoor, Inc. | 0.08 | -18.65 | 3.25 | -44.16 | 0.2333 | -0.1527 | |||
| SPB / Spectrum Brands Holdings, Inc. | 0.05 | 5.02 | 3.23 | -21.63 | 0.2319 | -0.0415 | |||
| AYI / Acuity Inc. | 0.01 | -25.51 | 3.22 | -45.42 | 0.2313 | -0.1602 | |||
| LBTYA / Liberty Global Ltd. | 0.29 | 5.03 | 3.22 | -0.09 | 0.2313 | 0.0174 | |||
| SPSC / SPS Commerce, Inc. | 0.02 | 5.04 | 3.20 | -18.38 | 0.2298 | -0.0304 | |||
| ROCK / Gibraltar Industries, Inc. | 0.06 | 5.03 | 3.18 | -9.36 | 0.2278 | -0.0045 | |||
| PRO / PROS Holdings, Inc. | 0.19 | 5.03 | 3.16 | -24.06 | 0.2268 | -0.0491 | |||
| EFSC / Enterprise Financial Services Corp | 0.06 | 23.45 | 3.15 | 7.32 | 0.2262 | 0.0314 | |||
| 1LZ / LegalZoom.com, Inc. | 0.43 | 3.15 | 0.2260 | 0.2260 | |||||
| VCTR / Victory Capital Holdings, Inc. | 0.05 | -13.68 | 3.11 | -25.27 | 0.2230 | -0.0528 | |||
| ABG / Asbury Automotive Group, Inc. | 0.01 | -1.32 | 3.09 | -20.03 | 0.2218 | -0.0635 | |||
| FNB / F.N.B. Corporation | 0.24 | 238.64 | 3.09 | 182.51 | 0.2214 | 0.1490 | |||
| BIRK / Birkenstock Holding plc | 0.06 | -23.36 | 3.08 | -33.35 | 0.2212 | -0.0855 | |||
| KAR / OPENLANE, Inc. | 0.16 | 5.03 | 3.05 | -4.27 | 0.2187 | 0.0076 | |||
| IVT / InvenTrust Properties Corp. | 0.11 | 43.65 | 3.04 | 34.57 | 0.2179 | 0.0683 | |||
| AZEK / The AZEK Company Inc. | 0.06 | 5.04 | 3.03 | 1.61 | 0.2171 | 0.0197 | |||
| STEP / StepStone Group Inc. | 0.06 | -29.63 | 2.97 | -45.09 | 0.2134 | -0.1457 | |||
| MRC / MRC Global Inc. | 0.25 | 5.03 | 2.95 | -16.65 | 0.2119 | -0.0230 | |||
| FOLD / Amicus Therapeutics, Inc. | 0.38 | 5.03 | 2.91 | -15.82 | 0.2089 | -0.0204 | |||
| FRSH / Freshworks Inc. | 0.20 | 5.03 | 2.90 | -16.60 | 0.2083 | -0.0225 | |||
| INVA / Innoviva, Inc. | 0.15 | 4.68 | 2.86 | 20.78 | 0.2053 | 0.0115 | |||
| CNNE / Cannae Holdings, Inc. | 0.16 | 5.03 | 2.85 | -5.87 | 0.2048 | 0.0037 | |||
| PBF / PBF Energy Inc. | 0.17 | 5.03 | 2.85 | -38.35 | 0.2046 | -0.1020 | |||
| MGNI / Magnite, Inc. | 0.24 | -7.74 | 2.84 | -36.21 | 0.2039 | -0.0915 | |||
| MTZ / MasTec, Inc. | 0.02 | 5.05 | 2.84 | -7.80 | 0.2035 | -0.0005 | |||
| WRBY / Warby Parker Inc. | 0.17 | 5.03 | 2.82 | -37.42 | 0.2026 | -0.0966 | |||
| MTX / Minerals Technologies Inc. | 0.05 | 5.02 | 2.80 | -29.35 | 0.2013 | -0.0620 | |||
| WETF / Wisdomtree Investments Inc | 0.32 | 5.03 | 2.80 | -6.66 | 0.2012 | 0.0020 | |||
| UPBD / Upbound Group, Inc. | 0.14 | 5.03 | 2.80 | -28.77 | 0.2011 | -0.0598 | |||
| UTZ / Utz Brands, Inc. | 0.21 | 2.79 | 0.2004 | 0.2004 | |||||
| MIRM / Mirum Pharmaceuticals, Inc. | 0.06 | 5.03 | 2.78 | -6.66 | 0.1993 | 0.0020 | |||
| TDOC / Teladoc Health, Inc. | 0.39 | -12.22 | 2.77 | -37.88 | 0.1990 | -0.0970 | |||
| GLPI / Gaming and Leisure Properties, Inc. | 0.06 | 5.03 | 2.76 | 3.88 | 0.1979 | 0.0219 | |||
| LC / LendingClub Corporation | 0.28 | 5.03 | 2.74 | -23.95 | 0.1970 | -0.0423 | |||
| US8575093013 / State Street Navigator Securities Lending Government Money Market Portfolio | 2.74 | -55.36 | 2.74 | -55.37 | 0.1967 | -0.2105 | |||
| CWENA / Clearway Energy Inc - Class A | 0.10 | 5.03 | 2.73 | 17.13 | 0.1958 | 0.0413 | |||
| BPMC / Blueprint Medicines Corporation | 0.03 | 125.63 | 2.73 | 79.46 | 0.1956 | 0.0949 | |||
| US82983N1081 / Sitio Royalties Corp | 0.16 | 34.09 | 2.72 | 12.90 | 0.1953 | 0.0355 | |||
| SAH / Sonic Automotive, Inc. | 0.04 | 5.04 | 2.71 | -14.11 | 0.1944 | -0.0147 | |||
| CRGY / Crescent Energy Company | 0.33 | 5.03 | 2.70 | -42.25 | 0.1936 | -0.1162 | |||
| US71880K1016 / Phinia Inc | 0.07 | 5.03 | 2.68 | -17.15 | 0.1925 | -0.0222 | |||
| WABC / Westamerica Bancorporation | 0.05 | 16.11 | 2.65 | 8.65 | 0.1901 | 0.0284 | |||
| AS / Amer Sports, Inc. | 0.11 | 5.03 | 2.64 | -20.35 | 0.1893 | -0.0303 | |||
| PEGA / Pegasystems Inc. | 0.03 | -51.37 | 2.62 | -58.65 | 0.1883 | -0.2325 | |||
| CFLT / Confluent, Inc. | 0.11 | 2.60 | 0.1868 | 0.1868 | |||||
| EWBC / East West Bancorp, Inc. | 0.03 | -49.42 | 2.59 | -57.99 | 0.1856 | -0.2225 | |||
| TRN / Trinity Industries, Inc. | 0.10 | 5.03 | 2.57 | -30.31 | 0.1841 | -0.0600 | |||
| VC / Visteon Corporation | 0.03 | 5.04 | 2.56 | -1.04 | 0.1837 | 0.0121 | |||
| BFAM / Bright Horizons Family Solutions Inc. | 0.02 | -21.48 | 2.55 | -19.67 | 0.1829 | -0.0275 | |||
| U / Unity Software Inc. | 0.12 | -16.90 | 2.54 | -21.14 | 0.1823 | -0.0313 | |||
| PRG / PROG Holdings, Inc. | 0.10 | 5.03 | 2.53 | -35.23 | 0.1817 | -0.0776 | |||
| ALEX / Alexander & Baldwin, Inc. | 0.15 | 27.67 | 2.52 | 22.89 | 0.1811 | 0.0449 | |||
| NLY / Annaly Capital Management, Inc. | 0.13 | -40.75 | 2.52 | -43.11 | 0.1811 | -0.1130 | |||
| MGEE / MGE Energy, Inc. | 0.03 | 5.06 | 2.51 | 5.72 | 0.1805 | 0.0227 | |||
| AMRK / A-Mark Precious Metals, Inc. | 0.10 | 5.03 | 2.48 | -9.18 | 0.1783 | -0.0031 | |||
| TNC / Tennant Company | 0.03 | 5.03 | 2.44 | -11.37 | 0.1750 | -0.0075 | |||
| PTEN / Patterson-UTI Energy, Inc. | 0.43 | 31.67 | 2.42 | -7.97 | 0.1740 | -0.0007 | |||
| KNX / Knight-Swift Transportation Holdings Inc. | 0.06 | 2.42 | 0.1734 | 0.1734 | |||||
| ALE / ALLETE, Inc. | 0.04 | 5.05 | 2.40 | 4.85 | 0.1721 | 0.0204 | |||
| EVER / EverQuote, Inc. | 0.10 | 2.20 | 2.36 | 74.83 | 0.1690 | 0.0325 | |||
| VST / Vistra Corp. | 0.02 | -25.48 | 2.27 | -42.53 | 0.1627 | -0.0988 | |||
| APLS / Apellis Pharmaceuticals, Inc. | 0.12 | 5.03 | 2.25 | -30.45 | 0.1618 | -0.0532 | |||
| CPF / Central Pacific Financial Corp. | 0.09 | 5.02 | 2.25 | -9.74 | 0.1616 | -0.0038 | |||
| QTWO / Q2 Holdings, Inc. | 0.03 | -18.45 | 2.23 | -32.10 | 0.1598 | -0.0577 | |||
| CARG / CarGurus, Inc. | 0.08 | 5.03 | 2.23 | -25.08 | 0.1597 | -0.0373 | |||
| CCS / Century Communities, Inc. | 0.04 | 5.02 | 2.22 | -25.03 | 0.1596 | -0.0371 | |||
| DT / Dynatrace, Inc. | 0.05 | -67.36 | 2.19 | -73.46 | 0.1572 | -0.3901 | |||
| CRUS / Cirrus Logic, Inc. | 0.02 | 5.03 | 2.18 | 0.41 | 0.1567 | 0.0125 | |||
| VTS / Vitesse Energy, Inc. | 0.11 | 5.03 | 2.18 | -17.01 | 0.1565 | -0.0178 | |||
| AZTA / Azenta, Inc. | 0.08 | 5.03 | 2.15 | -48.83 | 0.1540 | -0.1240 | |||
| BHE / Benchmark Electronics, Inc. | 0.07 | 2.13 | 0.1526 | 0.1526 | |||||
| NJR / New Jersey Resources Corporation | 0.04 | 5.02 | 2.11 | 7.17 | 0.1512 | 0.0209 | |||
| PHR / Phreesia, Inc. | 0.08 | -31.36 | 2.09 | -17.42 | 0.1500 | -0.0494 | |||
| SGI / Somnigroup International Inc. | 0.03 | 50.24 | 2.09 | 130.43 | 0.1500 | 0.0621 | |||
| HURN / Huron Consulting Group Inc. | 0.02 | 2.08 | 0.1493 | 0.1493 | |||||
| CMPR / Cimpress plc | 0.05 | 5.03 | 2.08 | -33.63 | 0.1493 | -0.0585 | |||
| APP / AppLovin Corporation | 0.01 | -31.43 | 2.07 | -50.05 | 0.1488 | -0.1264 | |||
| FUBO / fuboTV Inc. | 0.68 | 2.05 | 0.1471 | 0.1471 | |||||
| RNST / Renasant Corporation | 0.06 | -42.51 | 2.05 | -52.59 | 0.1470 | -0.1394 | |||
| KNSA / Kiniksa Pharmaceuticals, Ltd. | 0.07 | 2.01 | 0.1442 | 0.1442 | |||||
| TXRH / Texas Roadhouse, Inc. | 0.01 | -47.55 | 2.00 | -51.95 | 0.1434 | -0.1323 | |||
| CUBE / CubeSmart | 0.05 | 72.81 | 1.99 | 54.50 | 0.1428 | 0.0238 | |||
| OVV / Ovintiv Inc. | 0.06 | -66.24 | 1.94 | -73.16 | 0.1390 | -0.3393 | |||
| WK / Workiva Inc. | 0.03 | 49.88 | 1.93 | 14.89 | 0.1384 | 0.0271 | |||
| WS / Worthington Steel, Inc. | 0.07 | -10.77 | 1.92 | -21.17 | 0.1376 | -0.0237 | |||
| VNT / Vontier Corporation | 0.06 | -46.09 | 1.86 | -56.29 | 0.1331 | -0.1801 | |||
| CNXC / Concentrix Corporation | 0.04 | 82.81 | 1.84 | 12.10 | 0.1324 | -0.0043 | |||
| IAS / Integral Ad Science Holding Corp. | 0.26 | 34.58 | 1.84 | -9.43 | 0.1323 | -0.0027 | |||
| TFX / Teleflex Incorporated | 0.01 | 4.98 | 1.82 | -20.19 | 0.1305 | -0.0206 | |||
| NTST / NETSTREIT Corp. | 0.11 | 1.79 | 0.1284 | 0.1284 | |||||
| INT / World Fuel Services Corp. | 0.07 | 5.03 | 1.78 | -6.78 | 0.1274 | 0.0011 | |||
| GOLF / Acushnet Holdings Corp. | 0.03 | 5.04 | 1.77 | 6.51 | 0.1267 | 0.0168 | |||
| HUN / Huntsman Corporation | 0.13 | -21.10 | 1.76 | -37.62 | 0.1263 | -0.0607 | |||
| CFFN / Capitol Federal Financial, Inc. | 0.31 | 5.03 | 1.76 | 0.06 | 0.1260 | 0.0097 | |||
| INGR / Ingredion Incorporated | 0.01 | -64.42 | 1.74 | -65.36 | 0.1251 | -0.2087 | |||
| ADT / ADT Inc. | 0.22 | 41.29 | 1.74 | 69.26 | 0.1249 | 0.0298 | |||
| IRDM / Iridium Communications Inc. | 0.07 | 67.03 | 1.74 | 11.15 | 0.1246 | -0.0032 | |||
| EVH / Evolent Health, Inc. | 0.17 | 5.03 | 1.72 | -0.92 | 0.1232 | 0.0083 | |||
| NATL / NCR Atleos Corporation | 0.06 | -16.19 | 1.70 | -26.57 | 0.1222 | -0.0315 | |||
| WFRD / Weatherford International plc | 0.04 | 5.03 | 1.69 | -30.92 | 0.1211 | -0.0409 | |||
| DRH / DiamondRock Hospitality Company | 0.23 | 5.03 | 1.68 | -12.21 | 0.1208 | -0.0063 | |||
| PECO / Phillips Edison & Company, Inc. | 0.05 | 5.04 | 1.68 | 0.30 | 0.1205 | 0.0095 | |||
| MAX / MediaAlpha, Inc. | 0.20 | 5.03 | 1.66 | -22.53 | 0.1192 | -0.0230 | |||
| SFIX / Stitch Fix, Inc. | 0.49 | -15.99 | 1.60 | -41.67 | 0.1148 | -0.0671 | |||
| VEC / V2X Inc | 0.03 | -37.04 | 1.58 | -39.90 | 0.1134 | -0.0610 | |||
| ANIP / ANI Pharmaceuticals, Inc. | 0.02 | 90.24 | 1.58 | 236.67 | 0.1134 | 0.0352 | |||
| OZK / Bank OZK | 0.04 | -66.31 | 1.58 | -71.75 | 0.1133 | -0.2573 | |||
| BWXT / BWX Technologies, Inc. | 0.01 | -65.19 | 1.56 | -43.27 | 0.1122 | -0.1183 | |||
| TGTX / TG Therapeutics, Inc. | 0.03 | -53.34 | 1.55 | -33.02 | 0.1114 | -0.0423 | |||
| PFGC / Performance Food Group Company | 0.02 | -68.04 | 1.53 | -71.46 | 0.1101 | -0.2463 | |||
| VRT / Vertiv Holdings Co | 0.02 | -20.59 | 1.53 | -42.09 | 0.1096 | -0.0652 | |||
| SEIC / SEI Investments Company | 0.02 | 4.99 | 1.51 | -5.02 | 0.1086 | 0.0029 | |||
| AMH / American Homes 4 Rent | 0.04 | 5.03 | 1.51 | 13.39 | 0.1082 | 0.0200 | |||
| RGA / Reinsurance Group of America, Incorporated | 0.01 | 4.96 | 1.51 | -13.75 | 0.1080 | -0.0077 | |||
| UPWK / Upwork Inc. | 0.11 | -57.44 | 1.51 | -64.50 | 0.1080 | -0.1731 | |||
| LII / Lennox International Inc. | 0.00 | -71.01 | 1.49 | -73.26 | 0.1068 | -0.2621 | |||
| PARR / Par Pacific Holdings, Inc. | 0.10 | 5.03 | 1.49 | -10.04 | 0.1068 | -0.0029 | |||
| GIII / G-III Apparel Group, Ltd. | 0.06 | -41.64 | 1.49 | -51.12 | 0.1067 | -0.1420 | |||
| DDS / Dillard's, Inc. | 0.00 | -39.46 | 1.48 | -55.18 | 0.1065 | -0.1130 | |||
| EXTR / Extreme Networks, Inc. | 0.11 | -30.69 | 1.47 | -42.31 | 0.1053 | -0.0633 | |||
| CLW / Clearwater Paper Corporation | 0.05 | 96.74 | 1.46 | 64.37 | 0.1047 | 0.0458 | |||
| TMHC / Taylor Morrison Home Corporation | 0.03 | 5.02 | 1.45 | -6.57 | 0.1042 | 0.0011 | |||
| DRS / Leonardo DRS, Inc. | 0.04 | 1.40 | 0.1006 | 0.1006 | |||||
| BYRN / Byrna Technologies Inc. | 0.06 | 5.03 | 1.38 | -13.05 | 0.0990 | -0.0062 | |||
| MSGE / Madison Square Garden Entertainment Corp. | 0.04 | 1.38 | 0.0989 | 0.0989 | |||||
| ACI / Albertsons Companies, Inc. | 0.06 | 5.03 | 1.36 | 15.17 | 0.0975 | 0.0193 | |||
| AMRX / Amneal Pharmaceuticals, Inc. | 0.18 | 1.36 | 0.0974 | 0.0974 | |||||
| CATY / Cathay General Bancorp | 0.03 | 5.06 | 1.34 | -7.77 | 0.0964 | -0.0002 | |||
| REVG / REV Group, Inc. | 0.04 | -29.20 | 1.34 | -33.32 | 0.0958 | -0.0369 | |||
| ENR / Energizer Holdings, Inc. | 0.05 | 5.03 | 1.33 | -16.45 | 0.0956 | -0.0101 | |||
| DUOL / Duolingo, Inc. | 0.00 | -72.32 | 1.30 | -70.40 | 0.0935 | -0.1982 | |||
| RMBS / Rambus Inc. | 0.03 | -40.36 | 1.30 | -52.78 | 0.0932 | -0.0892 | |||
| EXPI / eXp World Holdings, Inc. | 0.14 | 5.03 | 1.29 | -15.45 | 0.0927 | -0.0086 | |||
| APPF / AppFolio, Inc. | 0.01 | -74.70 | 1.26 | -77.67 | 0.0901 | -0.2826 | |||
| HUBG / Hub Group, Inc. | 0.04 | 5.04 | 1.24 | -25.66 | 0.0893 | -0.0216 | |||
| NSP / Insperity, Inc. | 0.02 | 5.02 | 1.20 | -8.98 | 0.0858 | -0.0013 | |||
| RDW / Redwire Corporation | 0.11 | 1.18 | 0.0848 | 0.0848 | |||||
| TPH / Tri Pointe Homes, Inc. | 0.04 | -66.85 | 1.18 | -72.35 | 0.0846 | -0.1979 | |||
| AMBA / Ambarella, Inc. | 0.02 | 5.05 | 1.11 | -34.26 | 0.0796 | -0.0323 | |||
| JBTM / JBT Marel Corporation | 0.01 | -49.21 | 1.08 | -59.83 | 0.0775 | -0.1006 | |||
| FRT / Federal Realty Investment Trust | 0.01 | 5.03 | 1.08 | -9.10 | 0.0774 | -0.0013 | |||
| CHX / ChampionX Corporation | 0.04 | -46.64 | 1.07 | -55.07 | 0.0767 | -0.0809 | |||
| M / Macy's, Inc. | 0.09 | 5.03 | 1.06 | -23.03 | 0.0758 | -0.0152 | |||
| FLR / Fluor Corporation | 0.03 | -66.58 | 1.01 | -75.83 | 0.0728 | -0.2054 | |||
| FAF / First American Financial Corporation | 0.02 | -48.55 | 1.01 | -58.01 | 0.0728 | -0.1612 | |||
| AAT / American Assets Trust, Inc. | 0.05 | -30.76 | 0.98 | -46.63 | 0.0705 | -0.0514 | |||
| SSB / SouthState Corporation | 0.01 | -46.99 | 0.95 | -56.46 | 0.0680 | -0.0762 | |||
| HNST / The Honest Company, Inc. | 0.20 | 5.03 | 0.95 | -21.51 | 0.0678 | -0.0120 | |||
| MYGN / Myriad Genetics, Inc. | 0.12 | 5.02 | 0.92 | -38.60 | 0.0659 | -0.0332 | |||
| U0K / Fidelis Insurance Holdings Limited | 0.06 | 0.91 | 0.0652 | 0.0652 | |||||
| S / SentinelOne, Inc. | 0.05 | 5.02 | 0.90 | -18.90 | 0.0644 | -0.0090 | |||
| ALKT / Alkami Technology, Inc. | 0.03 | 5.03 | 0.89 | -19.37 | 0.0639 | -0.0094 | |||
| ALSN / Allison Transmission Holdings, Inc. | 0.01 | 5.05 | 0.88 | -17.59 | 0.0633 | -0.0076 | |||
| SFD / Smithfield Foods, Inc. | 0.04 | 0.88 | 0.0633 | 0.0633 | |||||
| GTLB / GitLab Inc. | 0.02 | 5.00 | 0.75 | -32.68 | 0.0542 | -0.0201 | |||
| ONTO / Onto Innovation Inc. | 0.01 | -47.26 | 0.75 | -68.58 | 0.0538 | -0.1045 | |||
| CDXS / Codexis, Inc. | 0.23 | 5.03 | 0.53 | -42.41 | 0.0382 | -0.0230 | |||
| US361ESC0496 / ESC GCI LIBERTY INC SR | 0.04 | 0.00 | 0.00 | 0.0000 | 0.0000 | ||||
| VITL / Vital Farms, Inc. | 0.00 | -100.00 | 0.00 | -100.00 | -0.1326 | ||||
| CAVA / CAVA Group, Inc. | 0.00 | -100.00 | 0.00 | -100.00 | -0.0970 | ||||
| BLBD / Blue Bird Corporation | 0.00 | -100.00 | 0.00 | -100.00 | -0.2123 | ||||
| AZPN / Aspen Technology, Inc. | 0.00 | -100.00 | 0.00 | -100.00 | -0.2910 | ||||
| WEAV / Weave Communications, Inc. | 0.00 | -100.00 | 0.00 | -100.00 | -0.0651 | ||||
| ML / MoneyLion Inc. | 0.00 | -100.00 | 0.00 | -100.00 | -0.0823 |