Mga Batayang Estadistika
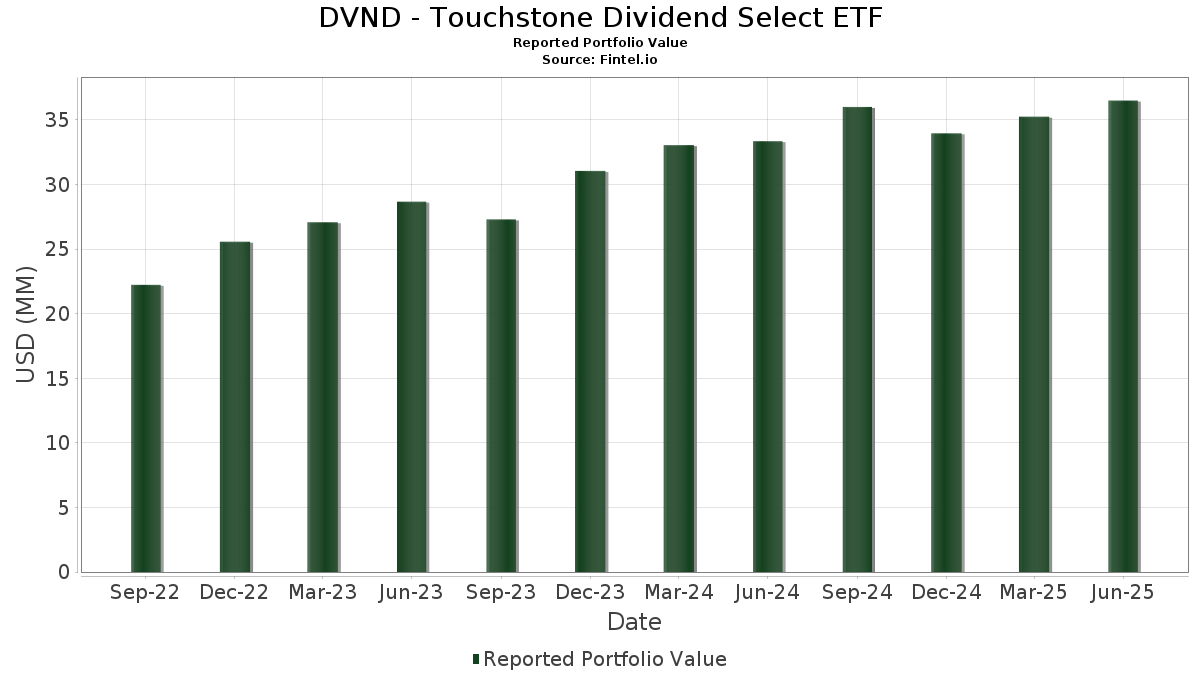
| Nilai Portofolio | $ 36,496,784 |
| Posisi Saat Ini | 56 |
Kepemilikan Terbaru, Kinerja, AUM (dari 13F, 13D)
DVND - Touchstone Dividend Select ETF telah mengungkapkan total kepemilikan 56 dalam pengajuan SEC terbaru mereka. Nilai portofolio terbaru dihitung sebesar $ 36,496,784 USD. Aset yang Dikelola (AUM) sebenarnya adalah nilai ini ditambah kas (yang tidak diungkapkan). Aset-aset utama DVND - Touchstone Dividend Select ETF adalah Microsoft Corporation (US:MSFT) , Broadcom Inc. (US:AVGO) , Dreyfus Government Cash Management Funds - Dreyfus Government Cash Management Fund Institutional Shares (US:DGCXX) , Oracle Corporation (US:ORCL) , and Bank of America Corporation (US:BAC) .
Peningkatan Tertinggi Kuartal Ini
Kami menggunakan perubahan dalam alokasi portofolio karena ini adalah metrik yang paling bermakna. Perubahan dapat disebabkan oleh perdagangan atau perubahan harga saham.
| Keamanan | Saham (MM) |
Nilai (Juta Dolar AS) |
Portfolio % | ΔPorsyento ng Portfolio |
|---|---|---|---|---|
| 0.00 | 1.83 | 5.0293 | 1.5046 | |
| 0.00 | 1.33 | 3.6365 | 1.2141 | |
| 0.00 | 0.89 | 2.4437 | 0.7894 | |
| 0.02 | 0.86 | 2.3537 | 0.4290 | |
| 0.00 | 0.85 | 2.3343 | 0.4276 | |
| 0.00 | 0.77 | 2.1169 | 0.4155 | |
| 0.00 | 0.73 | 2.0074 | 0.3474 | |
| 0.00 | 0.66 | 1.8136 | 0.3163 | |
| 0.00 | 0.60 | 1.6568 | 0.2131 | |
| 0.01 | 0.74 | 2.0209 | 0.1855 |
Penurunan Tertinggi Kuartal Ini
Kami menggunakan perubahan dalam alokasi portofolio karena ini adalah metrik yang paling bermakna. Perubahan dapat disebabkan oleh perdagangan atau perubahan harga saham.
| Keamanan | Saham (MM) |
Nilai (Juta Dolar AS) |
Portfolio % | ΔPorsyento ng Portfolio |
|---|---|---|---|---|
| 0.00 | 0.47 | 1.2975 | -0.6657 | |
| 0.02 | 0.62 | 1.6964 | -0.5057 | |
| 0.00 | 0.77 | 2.1012 | -0.4801 | |
| 0.01 | 0.51 | 1.4068 | -0.3703 | |
| 0.00 | 0.58 | 1.5904 | -0.3689 | |
| 1.26 | 1.26 | 3.4522 | -0.3416 | |
| 0.00 | 0.54 | 1.4788 | -0.3283 | |
| 0.00 | 0.51 | 1.4082 | -0.2953 | |
| 0.02 | 0.39 | 1.0763 | -0.2889 | |
| 0.00 | 0.70 | 1.9151 | -0.2858 |
Pengajuan 13F dan Dana
Formulir ini diajukan pada 2025-08-27 untuk periode pelaporan 2025-06-30. Klik ikon tautan untuk melihat riwayat transaksi selengkapnya.
Tingkatkan ke versi premium untuk membuka data premium dan ekspor ke Excel. ![]() .
.
| Keamanan | Ketik | Harga Saham Rata-rata | Saham (MM) |
ΔSaham (%) |
ΔSaham (%) |
Nilai ($MM) |
Portpolyo (%) |
ΔPortofolio (%) |
|
|---|---|---|---|---|---|---|---|---|---|
| MSFT / Microsoft Corporation | 0.00 | 11.45 | 1.83 | 47.67 | 5.0293 | 1.5046 | |||
| AVGO / Broadcom Inc. | 0.00 | -5.63 | 1.33 | 55.45 | 3.6365 | 1.2141 | |||
| DGCXX / Dreyfus Government Cash Management Funds - Dreyfus Government Cash Management Fund Institutional Shares | 1.26 | -5.82 | 1.26 | -5.76 | 3.4522 | -0.3416 | |||
| ORCL / Oracle Corporation | 0.00 | -2.23 | 0.89 | 52.83 | 2.4437 | 0.7894 | |||
| BAC / Bank of America Corporation | 0.02 | 11.61 | 0.86 | 26.55 | 2.3537 | 0.4290 | |||
| GS / The Goldman Sachs Group, Inc. | 0.00 | -2.20 | 0.85 | 26.83 | 2.3343 | 0.4276 | |||
| WFC / Wells Fargo & Company | 0.01 | -2.22 | 0.84 | 9.07 | 2.3110 | 0.1191 | |||
| CSCO / Cisco Systems, Inc. | 0.01 | -7.25 | 0.80 | 4.31 | 2.1890 | 0.0163 | |||
| IBM / International Business Machines Corporation | 0.00 | -9.77 | 0.78 | 6.97 | 2.1489 | 0.0696 | |||
| KLAC / KLA Corporation | 0.00 | -2.27 | 0.77 | 28.88 | 2.1169 | 0.4155 | |||
| PM / Philip Morris International Inc. | 0.00 | -26.57 | 0.77 | -15.73 | 2.1012 | -0.4801 | |||
| AAPL / Apple Inc. | 0.00 | 1.20 | 0.74 | -6.54 | 2.0390 | -0.2187 | |||
| SCHW / The Charles Schwab Corporation | 0.01 | -2.23 | 0.74 | 14.09 | 2.0209 | 0.1855 | |||
| META / Meta Platforms, Inc. | 0.00 | -2.27 | 0.73 | 25.13 | 2.0074 | 0.3474 | |||
| TXN / Texas Instruments Incorporated | 0.00 | -2.23 | 0.73 | 13.02 | 1.9996 | 0.1675 | |||
| MDT / Medtronic plc | 0.01 | -2.23 | 0.73 | -5.09 | 1.9943 | -0.1819 | |||
| HD / The Home Depot, Inc. | 0.00 | -2.23 | 0.72 | -2.17 | 1.9842 | -0.1154 | |||
| BLK / BlackRock, Inc. | 0.00 | 1.04 | 0.72 | 12.05 | 1.9647 | 0.1492 | |||
| JNJ / Johnson & Johnson | 0.00 | -2.22 | 0.70 | -9.94 | 1.9151 | -0.2858 | |||
| V / Visa Inc. | 0.00 | 0.21 | 0.67 | 1.51 | 1.8417 | -0.0358 | |||
| XOM / Exxon Mobil Corporation | 0.01 | 5.95 | 0.67 | -4.01 | 1.8377 | -0.1429 | |||
| RTX / RTX Corporation | 0.00 | -12.06 | 0.67 | -3.05 | 1.8339 | -0.1240 | |||
| CAT / Caterpillar Inc. | 0.00 | 6.50 | 0.66 | 25.43 | 1.8136 | 0.3163 | |||
| AMT / American Tower Corporation | 0.00 | -2.23 | 0.64 | -0.62 | 1.7530 | -0.0740 | |||
| CVX / Chevron Corporation | 0.00 | 8.74 | 0.63 | -6.94 | 1.7293 | -0.1937 | |||
| USB / U.S. Bancorp | 0.01 | -2.22 | 0.63 | 4.84 | 1.7238 | 0.0213 | |||
| VZ / Verizon Communications Inc. | 0.01 | -2.22 | 0.62 | -6.61 | 1.7053 | -0.1870 | |||
| T / AT&T Inc. | 0.02 | -22.09 | 0.62 | -20.36 | 1.6964 | -0.5057 | |||
| QCOM / QUALCOMM Incorporated | 0.00 | 11.38 | 0.61 | 15.31 | 1.6749 | 0.1737 | |||
| ADI / Analog Devices, Inc. | 0.00 | 0.63 | 0.60 | 18.90 | 1.6568 | 0.2131 | |||
| SYY / Sysco Corporation | 0.01 | -2.22 | 0.59 | -1.33 | 1.6294 | -0.0793 | |||
| DUK / Duke Energy Corporation | 0.00 | -13.16 | 0.58 | -15.94 | 1.5904 | -0.3689 | |||
| JPM / JPMorgan Chase & Co. | 0.00 | -28.91 | 0.58 | 42.26 | 1.5888 | 0.0947 | |||
| SO / The Southern Company | 0.01 | -2.23 | 0.57 | -2.39 | 1.5697 | -0.0941 | |||
| CMCSA / Comcast Corporation | 0.02 | 6.93 | 0.56 | 3.52 | 1.5340 | -0.0011 | |||
| LMT / Lockheed Martin Corporation | 0.00 | 11.25 | 0.56 | 15.29 | 1.5313 | 0.1573 | |||
| MMM / 3M Company | 0.00 | -2.21 | 0.55 | 1.47 | 1.5147 | -0.0318 | |||
| MCD / McDonald's Corporation | 0.00 | 1.13 | 0.55 | -5.54 | 1.4995 | -0.1412 | |||
| YUM / Yum! Brands, Inc. | 0.00 | -10.06 | 0.54 | -15.25 | 1.4788 | -0.3283 | |||
| PEP / PepsiCo, Inc. | 0.00 | 4.91 | 0.52 | -7.62 | 1.4306 | -0.1721 | |||
| SWK / Stanley Black & Decker, Inc. | 0.01 | 3.14 | 0.52 | -9.12 | 1.4217 | -0.1972 | |||
| SBUX / Starbucks Corporation | 0.01 | -2.22 | 0.52 | -8.67 | 1.4158 | -0.1885 | |||
| BDX / Becton, Dickinson and Company | 0.00 | 13.77 | 0.51 | -14.50 | 1.4082 | -0.2953 | |||
| CVS / CVS Health Corporation | 0.01 | -19.53 | 0.51 | -18.05 | 1.4068 | -0.3703 | |||
| LUV / Southwest Airlines Co. | 0.01 | -2.22 | 0.48 | -5.47 | 1.3281 | -0.1271 | |||
| UNH / UnitedHealth Group Incorporated | 0.00 | 14.84 | 0.47 | -31.55 | 1.2975 | -0.6657 | |||
| LVS / Las Vegas Sands Corp. | 0.01 | 3.17 | 0.45 | 16.11 | 1.2468 | 0.1363 | |||
| DD / DuPont de Nemours, Inc. | 0.01 | 10.49 | 0.45 | 1.57 | 1.2396 | -0.0246 | |||
| IFF / International Flavors & Fragrances Inc. | 0.01 | -2.23 | 0.44 | -7.38 | 1.2044 | -0.1409 | |||
| DG / Dollar General Corporation | 0.00 | -19.66 | 0.43 | 4.41 | 1.1697 | 0.0112 | |||
| STZ / Constellation Brands, Inc. | 0.00 | 3.57 | 0.43 | -8.21 | 1.1659 | -0.1485 | |||
| APD / Air Products and Chemicals, Inc. | 0.00 | -11.80 | 0.42 | -15.74 | 1.1623 | -0.2637 | |||
| ARE / Alexandria Real Estate Equities, Inc. | 0.01 | 10.98 | 0.39 | -12.89 | 1.0771 | -0.2024 | |||
| PFE / Pfizer Inc. | 0.02 | -14.70 | 0.39 | -18.50 | 1.0763 | -0.2889 | |||
| MRK / Merck & Co., Inc. | 0.00 | 2.25 | 0.39 | -9.77 | 1.0645 | -0.1573 | |||
| INTC / Intel Corporation | 0.01 | -2.22 | 0.26 | -3.41 | 0.6994 | -0.0512 |