Mga Batayang Estadistika
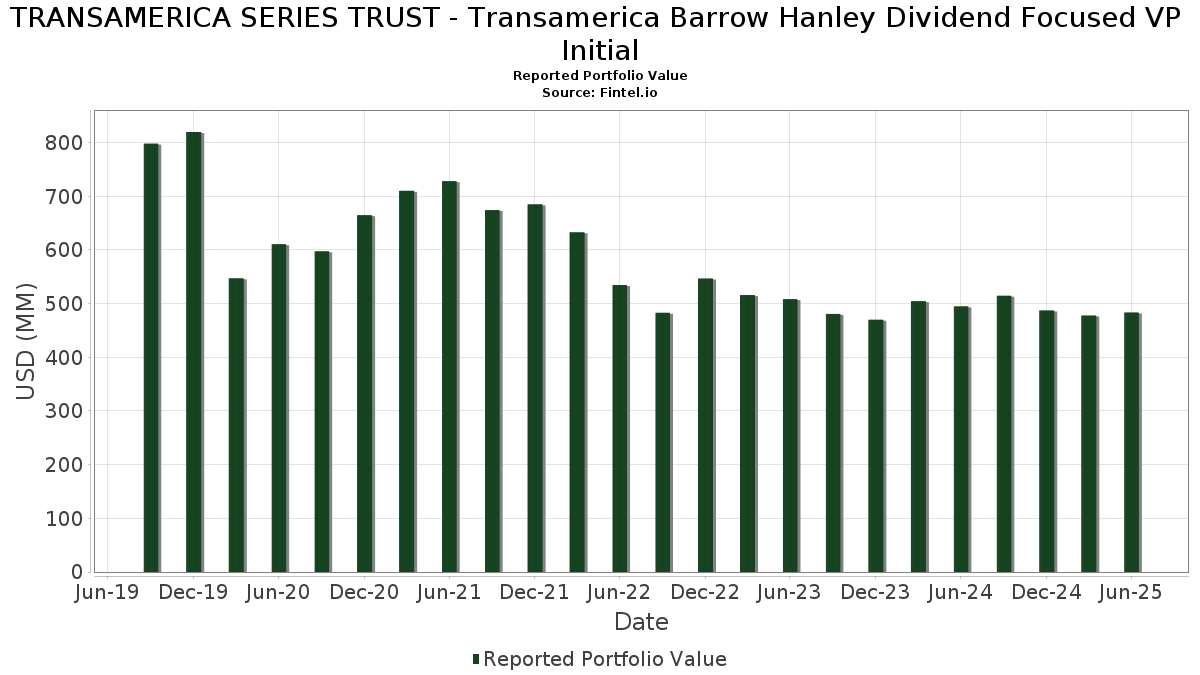
| Nilai Portofolio | $ 483,180,165 |
| Posisi Saat Ini | 48 |
Kepemilikan Terbaru, Kinerja, AUM (dari 13F, 13D)
TRANSAMERICA SERIES TRUST - Transamerica Barrow Hanley Dividend Focused VP Initial telah mengungkapkan total kepemilikan 48 dalam pengajuan SEC terbaru mereka. Nilai portofolio terbaru dihitung sebesar $ 483,180,165 USD. Aset yang Dikelola (AUM) sebenarnya adalah nilai ini ditambah kas (yang tidak diungkapkan). Aset-aset utama TRANSAMERICA SERIES TRUST - Transamerica Barrow Hanley Dividend Focused VP Initial adalah Cisco Systems, Inc. (US:CSCO) , CME Group Inc. (US:CME) , Gilead Sciences, Inc. (US:GILD) , Bank of America Corporation (US:BAC) , and Broadcom Inc. (US:AVGO) . Posisi baru TRANSAMERICA SERIES TRUST - Transamerica Barrow Hanley Dividend Focused VP Initial meliputi: IDEX Corporation (US:IEX) , Stryker Corporation (US:SYK) , .
Peningkatan Tertinggi Kuartal Ini
Kami menggunakan perubahan dalam alokasi portofolio karena ini adalah metrik yang paling bermakna. Perubahan dapat disebabkan oleh perdagangan atau perubahan harga saham.
| Keamanan | Saham (MM) |
Nilai (Juta Dolar AS) |
Portfolio % | ΔPorsyento ng Portfolio |
|---|---|---|---|---|
| 0.04 | 7.86 | 1.6263 | 1.6263 | |
| 0.02 | 6.74 | 1.3943 | 1.3943 | |
| 0.06 | 17.17 | 3.5497 | 1.2077 | |
| 0.36 | 17.20 | 3.5563 | 1.1256 | |
| 0.11 | 15.98 | 3.3042 | 1.1141 | |
| 3.88 | 0.8024 | 0.8024 | ||
| 0.06 | 13.92 | 2.8778 | 0.7300 | |
| 0.03 | 14.91 | 3.0826 | 0.7137 | |
| 0.01 | 10.18 | 2.1044 | 0.3219 | |
| 0.31 | 21.64 | 4.4750 | 0.3131 |
Penurunan Tertinggi Kuartal Ini
Kami menggunakan perubahan dalam alokasi portofolio karena ini adalah metrik yang paling bermakna. Perubahan dapat disebabkan oleh perdagangan atau perubahan harga saham.
| Keamanan | Saham (MM) |
Nilai (Juta Dolar AS) |
Portfolio % | ΔPorsyento ng Portfolio |
|---|---|---|---|---|
| 0.03 | 6.48 | 1.3403 | -1.0083 | |
| 0.14 | 6.68 | 1.3821 | -0.7104 | |
| 0.16 | 18.13 | 3.7492 | -0.6679 | |
| 0.06 | 15.11 | 3.1257 | -0.5995 | |
| 0.08 | 6.38 | 1.3184 | -0.5718 | |
| 0.19 | 15.49 | 3.2036 | -0.5562 | |
| 0.07 | 18.62 | 3.8502 | -0.5181 | |
| 0.09 | 6.24 | 1.2903 | -0.4739 | |
| 0.10 | 8.99 | 1.8587 | -0.4548 | |
| 0.01 | 5.71 | 1.1813 | -0.4192 |
Pengajuan 13F dan Dana
Formulir ini diajukan pada 2025-08-27 untuk periode pelaporan 2025-06-30. Klik ikon tautan untuk melihat riwayat transaksi selengkapnya.
Tingkatkan ke versi premium untuk membuka data premium dan ekspor ke Excel. ![]() .
.
| Keamanan | Ketik | Harga Saham Rata-rata | Saham (MM) |
ΔSaham (%) |
ΔSaham (%) |
Nilai ($MM) |
Portpolyo (%) |
ΔPortofolio (%) |
|
|---|---|---|---|---|---|---|---|---|---|
| CSCO / Cisco Systems, Inc. | 0.31 | -2.62 | 21.64 | 9.49 | 4.4750 | 0.3131 | |||
| CME / CME Group Inc. | 0.07 | -13.61 | 18.62 | -10.25 | 3.8502 | -0.5181 | |||
| GILD / Gilead Sciences, Inc. | 0.16 | -12.65 | 18.13 | -13.57 | 3.7492 | -0.6679 | |||
| BAC / Bank of America Corporation | 0.36 | 31.38 | 17.20 | 48.99 | 3.5563 | 1.1256 | |||
| AVGO / Broadcom Inc. | 0.06 | -6.26 | 17.17 | 54.35 | 3.5497 | 1.2077 | |||
| CL / Colgate-Palmolive Company | 0.18 | -6.56 | 16.26 | -9.36 | 3.3625 | -0.4149 | |||
| TXN / Texas Instruments Incorporated | 0.08 | -4.89 | 16.22 | 9.89 | 3.3537 | 0.2461 | |||
| MS / Morgan Stanley | 0.11 | 27.24 | 15.98 | 53.63 | 3.3042 | 1.1141 | |||
| MET / MetLife, Inc. | 0.19 | -13.38 | 15.49 | -13.24 | 3.2036 | -0.5562 | |||
| RSG / Republic Services, Inc. | 0.06 | -16.10 | 15.11 | -14.56 | 3.1257 | -0.5995 | |||
| MSFT / Microsoft Corporation | 0.03 | 0.00 | 14.91 | 32.51 | 3.0826 | 0.7137 | |||
| TSM / Taiwan Semiconductor Manufacturing Company Limited - Depositary Receipt (Common Stock) | 0.06 | 0.00 | 13.92 | 36.43 | 2.8778 | 0.7300 | |||
| ADP / Automatic Data Processing, Inc. | 0.04 | 0.00 | 13.16 | 0.94 | 2.7214 | -0.0239 | |||
| HD / The Home Depot, Inc. | 0.03 | 0.00 | 12.82 | 0.05 | 2.6508 | -0.0473 | |||
| DGX / Quest Diagnostics Incorporated | 0.07 | -8.64 | 12.41 | -3.01 | 2.5673 | -0.1280 | |||
| SBGSY / Schneider Electric S.E. - Depositary Receipt (Common Stock) | 0.21 | 0.00 | 11.06 | 16.24 | 2.2865 | 0.2836 | |||
| RELX / RELX PLC - Depositary Receipt (Common Stock) | 0.19 | -4.48 | 10.54 | 2.97 | 2.1802 | 0.0242 | |||
| URI / United Rentals, Inc. | 0.01 | 0.00 | 10.18 | 20.23 | 2.1044 | 0.3219 | |||
| LIN / Linde plc | 0.02 | 0.00 | 9.89 | 0.76 | 2.0459 | -0.0217 | |||
| CINF / Cincinnati Financial Corporation | 0.07 | 0.00 | 9.68 | 0.81 | 2.0027 | -0.0202 | |||
| KMB / Kimberly-Clark Corporation | 0.07 | 0.00 | 9.39 | -9.36 | 1.9418 | -0.2395 | |||
| CFG / Citizens Financial Group, Inc. | 0.21 | 0.00 | 9.21 | 9.23 | 1.9037 | 0.1290 | |||
| MDT / Medtronic plc | 0.10 | -15.67 | 8.99 | -18.20 | 1.8587 | -0.4548 | |||
| STLD / Steel Dynamics, Inc. | 0.06 | 0.00 | 8.12 | 2.34 | 1.6797 | 0.0085 | |||
| MCO / Moody's Corporation | 0.02 | 0.00 | 8.08 | 7.71 | 1.6701 | 0.0912 | |||
| USB / U.S. Bancorp | 0.18 | 0.00 | 7.92 | 7.17 | 1.6377 | 0.0817 | |||
| IEX / IDEX Corporation | 0.04 | 7.86 | 1.6263 | 1.6263 | |||||
| WCC / WESCO International, Inc. | 0.04 | -20.91 | 7.57 | -5.68 | 1.5647 | -0.1247 | |||
| PGR / The Progressive Corporation | 0.03 | 0.00 | 7.36 | -5.70 | 1.5229 | -0.1217 | |||
| DLR / Digital Realty Trust, Inc. | 0.04 | 0.00 | 7.21 | 21.68 | 1.4904 | 0.2430 | |||
| UNP / Union Pacific Corporation | 0.03 | -8.09 | 7.16 | -10.50 | 1.4808 | -0.2038 | |||
| XYL / Xylem Inc. | 0.06 | -6.75 | 7.15 | 0.97 | 1.4788 | -0.0125 | |||
| WSO / Watsco, Inc. | 0.02 | 0.00 | 6.92 | -13.12 | 1.4314 | -0.2462 | |||
| COST / Costco Wholesale Corporation | 0.01 | 0.00 | 6.91 | 4.67 | 1.4287 | 0.0388 | |||
| SYK / Stryker Corporation | 0.02 | 6.74 | 1.3943 | 1.3943 | |||||
| BMY / Bristol-Myers Squibb Company | 0.14 | -11.38 | 6.68 | -32.74 | 1.3821 | -0.7104 | |||
| OKE / ONEOK, Inc. | 0.08 | 0.00 | 6.66 | -17.73 | 1.3782 | -0.3276 | |||
| PKG / Packaging Corporation of America | 0.03 | -38.94 | 6.48 | -41.89 | 1.3403 | -1.0083 | |||
| MRK / Merck & Co., Inc. | 0.08 | -19.46 | 6.38 | -28.98 | 1.3184 | -0.5718 | |||
| OMC / Omnicom Group Inc. | 0.09 | -14.17 | 6.24 | -25.52 | 1.2903 | -0.4739 | |||
| AMT / American Tower Corporation | 0.03 | 0.00 | 6.01 | 1.57 | 1.2418 | -0.0031 | |||
| WY / Weyerhaeuser Company | 0.23 | -6.21 | 5.92 | -17.70 | 1.2243 | -0.2906 | |||
| TU / TELUS Corporation | 0.36 | 0.00 | 5.83 | 11.98 | 1.2062 | 0.1095 | |||
| ELV / Elevance Health, Inc. | 0.01 | -15.96 | 5.71 | -24.84 | 1.1813 | -0.4192 | |||
| CSA / Accenture plc | 0.02 | 0.00 | 5.54 | -4.21 | 1.1447 | -0.0722 | |||
| DHI / D.R. Horton, Inc. | 0.04 | 0.00 | 5.51 | 1.40 | 1.1396 | -0.0047 | |||
| WTRG / Essential Utilities, Inc. | 0.14 | 0.00 | 5.37 | -6.05 | 1.1113 | -0.0931 | |||
| FIXED INC CLEARING CORP.REPO / RA (000000000) | 3.88 | 0.8024 | 0.8024 |