Mga Batayang Estadistika
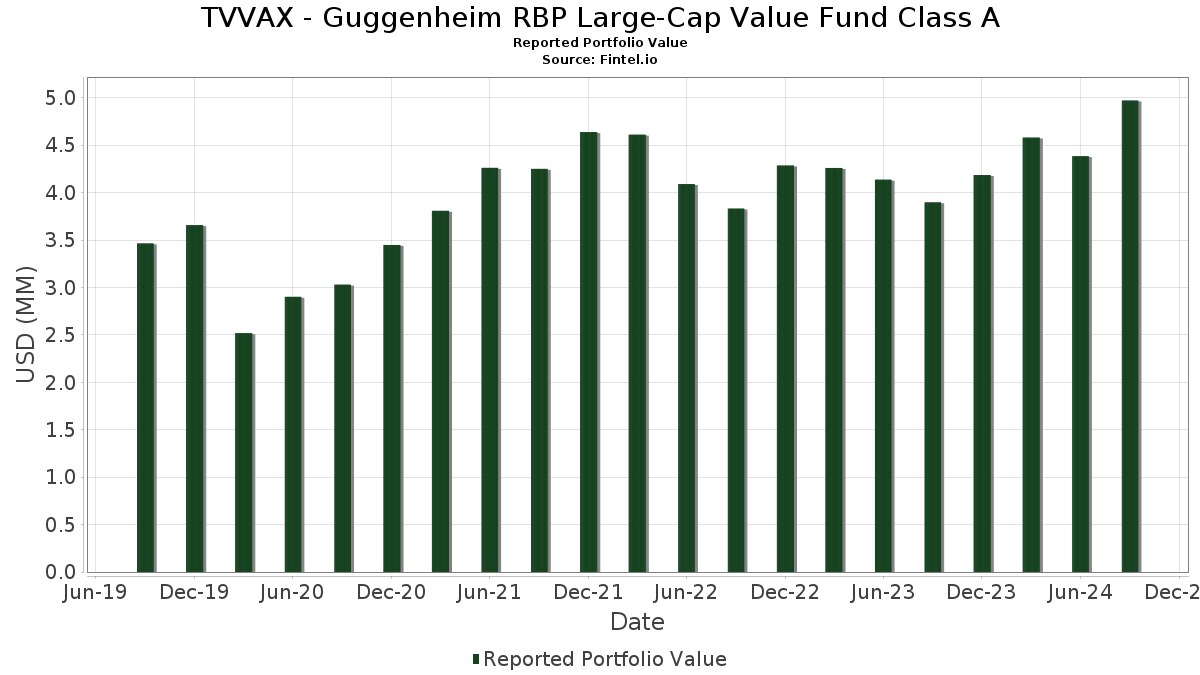
| Nilai Portofolio | $ 4,970,550 |
| Posisi Saat Ini | 122 |
Kepemilikan Terbaru, Kinerja, AUM (dari 13F, 13D)
TVVAX - Guggenheim RBP Large-Cap Value Fund Class A telah mengungkapkan total kepemilikan 122 dalam pengajuan SEC terbaru mereka. Nilai portofolio terbaru dihitung sebesar $ 4,970,550 USD. Aset yang Dikelola (AUM) sebenarnya adalah nilai ini ditambah kas (yang tidak diungkapkan). Aset-aset utama TVVAX - Guggenheim RBP Large-Cap Value Fund Class A adalah JPMorgan Chase & Co. (US:JPM) , Exxon Mobil Corporation (US:XOM) , Walmart Inc. (US:WMT) , Oracle Corporation (US:ORCL) , and The Coca-Cola Company (US:KO) . Posisi baru TVVAX - Guggenheim RBP Large-Cap Value Fund Class A meliputi: Wells Fargo & Company (US:WFC) , Bath & Body Works, Inc. (US:BBWI) , Jack Henry & Associates, Inc. (US:JKHY) , Invesco Ltd. (US:IVZ) , and Amentum Holdings, Inc. (US:AMTM) .
Peningkatan Tertinggi Kuartal Ini
Kami menggunakan perubahan dalam alokasi portofolio karena ini adalah metrik yang paling bermakna. Perubahan dapat disebabkan oleh perdagangan atau perubahan harga saham.
| Keamanan | Saham (MM) |
Nilai (Juta Dolar AS) |
Portfolio % | ΔPorsyento ng Portfolio |
|---|---|---|---|---|
| 0.00 | 0.09 | 1.8358 | 1.8358 | |
| 0.00 | 0.12 | 2.4569 | 1.1508 | |
| 0.00 | 0.05 | 1.0972 | 1.0972 | |
| 0.00 | 0.05 | 1.0946 | 0.9809 | |
| 0.00 | 0.11 | 2.1072 | 0.9710 | |
| 0.00 | 0.06 | 1.2496 | 0.8751 | |
| 0.00 | 0.07 | 1.3495 | 0.8143 | |
| 0.00 | 0.04 | 0.8003 | 0.8003 | |
| 0.00 | 0.04 | 0.7435 | 0.7435 | |
| 0.00 | 0.04 | 0.7778 | 0.6744 |
Penurunan Tertinggi Kuartal Ini
Kami menggunakan perubahan dalam alokasi portofolio karena ini adalah metrik yang paling bermakna. Perubahan dapat disebabkan oleh perdagangan atau perubahan harga saham.
| Keamanan | Saham (MM) |
Nilai (Juta Dolar AS) |
Portfolio % | ΔPorsyento ng Portfolio |
|---|---|---|---|---|
| 0.00 | 0.03 | 0.6471 | -1.4452 | |
| 0.00 | 0.01 | 0.1218 | -0.9044 | |
| 0.00 | 0.00 | 0.0391 | -0.7360 | |
| 0.00 | 0.07 | 1.4318 | -0.4009 | |
| 0.00 | 0.10 | 1.9608 | -0.3606 | |
| 0.00 | 0.06 | 1.1691 | -0.3091 | |
| 0.00 | 0.05 | 0.9043 | -0.2946 | |
| 0.00 | 0.01 | 0.1034 | -0.1971 | |
| 0.00 | 0.00 | 0.0470 | -0.1642 | |
| 0.00 | 0.04 | 0.7177 | -0.1556 |
Pengajuan 13F dan Dana
Formulir ini diajukan pada 2024-11-29 untuk periode pelaporan 2024-09-30. Klik ikon tautan untuk melihat riwayat transaksi selengkapnya.
Tingkatkan ke versi premium untuk membuka data premium dan ekspor ke Excel. ![]() .
.
| Keamanan | Ketik | Harga Saham Rata-rata | Saham (MM) |
ΔSaham (%) |
ΔSaham (%) |
Nilai ($MM) |
Portpolyo (%) |
ΔPortofolio (%) |
|
|---|---|---|---|---|---|---|---|---|---|
| JPM / JPMorgan Chase & Co. | 0.00 | 3.81 | 0.14 | 7.87 | 2.7528 | -0.1157 | |||
| XOM / Exxon Mobil Corporation | 0.00 | 108.33 | 0.12 | 112.07 | 2.4569 | 1.1508 | |||
| WMT / Walmart Inc. | 0.00 | -0.54 | 0.12 | 19.00 | 2.3840 | 0.1175 | |||
| ORCL / Oracle Corporation | 0.00 | 0.16 | 0.11 | 20.45 | 2.1259 | 0.1425 | |||
| KO / The Coca-Cola Company | 0.00 | 85.25 | 0.11 | 110.00 | 2.1072 | 0.9710 | |||
| PG / The Procter & Gamble Company | 0.00 | 3.47 | 0.10 | 9.57 | 2.0606 | -0.0778 | |||
| MRK / Merck & Co., Inc. | 0.00 | 3.84 | 0.10 | -4.85 | 1.9608 | -0.3606 | |||
| IVE / iShares Trust - iShares S&P 500 Value ETF | 0.00 | 2.12 | 0.09 | 10.59 | 1.8931 | -0.0366 | |||
| PEP / PepsiCo, Inc. | 0.00 | 3.75 | 0.09 | 6.82 | 1.8805 | -0.1020 | |||
| WFC / Wells Fargo & Company | 0.00 | 0.09 | 1.8358 | 1.8358 | |||||
| ABT / Abbott Laboratories | 0.00 | 2.64 | 0.09 | 12.82 | 1.7683 | -0.0024 | |||
| DIS / The Walt Disney Company | 0.00 | 14.39 | 0.09 | 11.54 | 1.7396 | -0.0306 | |||
| NEE / NextEra Energy, Inc. | 0.00 | -0.20 | 0.08 | 18.57 | 1.6705 | 0.0892 | |||
| CAT / Caterpillar Inc. | 0.00 | -9.61 | 0.08 | 5.26 | 1.6161 | -0.1010 | |||
| TJX / The TJX Companies, Inc. | 0.00 | 14.88 | 0.07 | 23.33 | 1.4852 | 0.1196 | |||
| BSX / Boston Scientific Corporation | 0.00 | 3.07 | 0.07 | 12.31 | 1.4620 | -0.0080 | |||
| AMAT / Applied Materials, Inc. | 0.00 | 2.90 | 0.07 | -12.35 | 1.4318 | -0.4009 | |||
| ADP / Automatic Data Processing, Inc. | 0.00 | -0.39 | 0.07 | 16.39 | 1.4197 | 0.0334 | |||
| AMT / American Tower Corporation | 0.00 | 18.80 | 0.07 | 43.75 | 1.3788 | 0.2848 | |||
| PH / Parker-Hannifin Corporation | 0.00 | 127.66 | 0.07 | 191.30 | 1.3495 | 0.8143 | |||
| MDLZ / Mondelez International, Inc. | 0.00 | 3.52 | 0.07 | 17.54 | 1.3412 | 0.0434 | |||
| ICE / Intercontinental Exchange, Inc. | 0.00 | -3.71 | 0.07 | 13.79 | 1.3308 | 0.0026 | |||
| PLD / Prologis, Inc. | 0.00 | 6.42 | 0.06 | 18.52 | 1.2957 | 0.0746 | |||
| MSI / Motorola Solutions, Inc. | 0.00 | -2.72 | 0.06 | 14.29 | 1.2835 | 0.0060 | |||
| BDX / Becton, Dickinson and Company | 0.00 | 10.92 | 0.06 | 14.55 | 1.2706 | 0.0184 | |||
| ABBV / AbbVie Inc. | 0.00 | 226.80 | 0.06 | 287.50 | 1.2496 | 0.8751 | |||
| AMP / Ameriprise Financial, Inc. | 0.00 | 3.20 | 0.06 | 13.21 | 1.2098 | 0.0077 | |||
| FDX / FedEx Corporation | 0.00 | -2.28 | 0.06 | -10.77 | 1.1691 | -0.3091 | |||
| LMT / Lockheed Martin Corporation | 0.00 | 4.17 | 0.06 | 31.82 | 1.1669 | 0.1575 | |||
| APH / Amphenol Corporation | 0.00 | 3.59 | 0.06 | 0.00 | 1.1641 | -0.1462 | |||
| AEP / American Electric Power Company, Inc. | 0.00 | -3.73 | 0.06 | 13.73 | 1.1633 | -0.0020 | |||
| YUM / Yum! Brands, Inc. | 0.00 | 100.00 | 0.06 | 114.81 | 1.1602 | 0.5399 | |||
| TRV / The Travelers Companies, Inc. | 0.00 | 1.64 | 0.06 | 18.37 | 1.1590 | 0.0421 | |||
| SLB / Schlumberger Limited | 0.00 | 30.14 | 0.06 | 16.33 | 1.1497 | 0.0293 | |||
| OKE / ONEOK, Inc. | 0.00 | 4.17 | 0.06 | 16.67 | 1.1369 | 0.0355 | |||
| TGT / Target Corporation | 0.00 | 4.02 | 0.06 | 9.80 | 1.1263 | -0.0334 | |||
| ACGL / Arch Capital Group Ltd. | 0.00 | 19.15 | 0.06 | 33.33 | 1.1256 | 0.1649 | |||
| LVS / Las Vegas Sands Corp. | 0.00 | 4.62 | 0.06 | 19.57 | 1.1154 | 0.0585 | |||
| HIG / The Hartford Insurance Group, Inc. | 0.00 | -6.31 | 0.06 | 10.00 | 1.1151 | -0.0323 | |||
| ETR / Entergy Corporation | 0.00 | -4.76 | 0.06 | 17.02 | 1.1034 | 0.0412 | |||
| UAL / United Airlines Holdings, Inc. | 0.00 | 4.54 | 0.06 | 22.22 | 1.1014 | 0.0882 | |||
| AIG / American International Group, Inc. | 0.00 | 3.72 | 0.06 | 3.77 | 1.0993 | -0.1124 | |||
| USB / U.S. Bancorp | 0.00 | 0.05 | 1.0972 | 1.0972 | |||||
| DOV / Dover Corporation | 0.00 | 921.43 | 0.05 | 980.00 | 1.0946 | 0.9809 | |||
| UNM / Unum Group | 0.00 | -1.42 | 0.05 | 15.22 | 1.0738 | 0.0176 | |||
| DAL / Delta Air Lines, Inc. | 0.00 | 4.58 | 0.05 | 12.77 | 1.0645 | -0.0076 | |||
| GM / General Motors Company | 0.00 | 3.85 | 0.05 | 0.00 | 1.0625 | -0.1329 | |||
| MANH / Manhattan Associates, Inc. | 0.00 | 5.00 | 0.05 | 20.45 | 1.0616 | 0.0620 | |||
| NKE / NIKE, Inc. | 0.00 | 4.89 | 0.05 | 23.26 | 1.0605 | 0.0884 | |||
| FE / FirstEnergy Corp. | 0.00 | 4.63 | 0.05 | 21.43 | 1.0207 | 0.0714 | |||
| COR / Cencora, Inc. | 0.00 | 4.15 | 0.05 | 4.17 | 1.0154 | -0.0851 | |||
| TFC / Truist Financial Corporation | 0.00 | -6.32 | 0.05 | 31.58 | 1.0126 | 0.0933 | |||
| GL / Globe Life Inc. | 0.00 | -15.72 | 0.05 | 8.70 | 1.0084 | -0.0399 | |||
| GPN / Global Payments Inc. | 0.00 | -4.15 | 0.05 | 2.08 | 0.9916 | -0.1099 | |||
| NTAP / NetApp, Inc. | 0.00 | 4.21 | 0.05 | 0.00 | 0.9763 | -0.1254 | |||
| AMGN / Amgen Inc. | 0.00 | 4.93 | 0.05 | 9.09 | 0.9583 | -0.0404 | |||
| SUI / Sun Communities, Inc. | 0.00 | 5.18 | 0.05 | 17.95 | 0.9307 | 0.0422 | |||
| ECL / Ecolab Inc. | 0.00 | 5.26 | 0.05 | 12.50 | 0.9174 | 0.0013 | |||
| J / Jacobs Solutions Inc. | 0.00 | 4.19 | 0.05 | -2.17 | 0.9093 | -0.1411 | |||
| OXY / Occidental Petroleum Corporation | 0.00 | 4.02 | 0.05 | -15.09 | 0.9043 | -0.2946 | |||
| MIDD / The Middleby Corporation | 0.00 | 5.48 | 0.04 | 20.00 | 0.8554 | 0.0495 | |||
| BBWI / Bath & Body Works, Inc. | 0.00 | 0.04 | 0.8003 | 0.8003 | |||||
| AKAM / Akamai Technologies, Inc. | 0.00 | 656.86 | 0.04 | 850.00 | 0.7778 | 0.6744 | |||
| FTV / Fortive Corporation | 0.00 | -9.76 | 0.04 | -5.00 | 0.7720 | -0.1337 | |||
| DD / DuPont de Nemours, Inc. | 0.00 | 0.04 | 0.7435 | 0.7435 | |||||
| TT / Trane Technologies plc | 0.00 | 213.33 | 0.04 | 500.00 | 0.7294 | 0.5742 | |||
| AR / Antero Resources Corporation | 0.00 | 5.55 | 0.04 | -7.89 | 0.7177 | -0.1556 | |||
| ITW / Illinois Tool Works Inc. | 0.00 | 3.05 | 0.04 | 12.90 | 0.7062 | 0.0075 | |||
| JNJ / Johnson & Johnson | 0.00 | 14.67 | 0.03 | 30.77 | 0.6826 | 0.0772 | |||
| HD / The Home Depot, Inc. | 0.00 | -70.37 | 0.03 | -65.22 | 0.6471 | -1.4452 | |||
| JKHY / Jack Henry & Associates, Inc. | 0.00 | 0.03 | 0.6378 | 0.6378 | |||||
| STT / State Street Corporation | 0.00 | 7.19 | 0.03 | 29.17 | 0.6322 | 0.0759 | |||
| T / AT&T Inc. | 0.00 | 3.85 | 0.03 | 17.39 | 0.5564 | 0.0316 | |||
| O / Realty Income Corporation | 0.00 | 4.05 | 0.03 | 22.73 | 0.5532 | 0.0538 | |||
| NRG / NRG Energy, Inc. | 0.00 | 3.96 | 0.03 | 23.81 | 0.5255 | 0.0383 | |||
| IVZ / Invesco Ltd. | 0.00 | 0.02 | 0.4970 | 0.4970 | |||||
| ELS / Equity LifeStyle Properties, Inc. | 0.00 | 3.87 | 0.02 | 14.29 | 0.4970 | 0.0044 | |||
| JCI / Johnson Controls International plc | 0.00 | 0.00 | 0.02 | 15.79 | 0.4570 | 0.0156 | |||
| ARE / Alexandria Real Estate Equities, Inc. | 0.00 | 3.80 | 0.02 | 5.56 | 0.3888 | -0.0273 | |||
| BLL / Ball Corp. | 0.00 | 0.00 | 0.02 | 12.50 | 0.3647 | 0.0012 | |||
| RSG / Republic Services, Inc. | 0.00 | 0.00 | 0.02 | 0.00 | 0.3568 | -0.0325 | |||
| DRI / Darden Restaurants, Inc. | 0.00 | 0.00 | 0.02 | 6.25 | 0.3506 | -0.0139 | |||
| ERIE / Erie Indemnity Company | 0.00 | 180.00 | 0.02 | 400.00 | 0.3017 | 0.2201 | |||
| IR / Ingersoll Rand Inc. | 0.00 | 0.00 | 0.01 | 9.09 | 0.2469 | -0.0108 | |||
| WELL / Welltower Inc. | 0.00 | 0.00 | 0.01 | 20.00 | 0.2453 | 0.0201 | |||
| MCD / McDonald's Corporation | 0.00 | 0.00 | 0.01 | 20.00 | 0.2431 | 0.0137 | |||
| NEM / Newmont Corporation | 0.00 | 0.00 | 0.01 | 22.22 | 0.2326 | 0.0271 | |||
| MRO / Marathon Oil Corporation | 0.00 | 0.00 | 0.01 | -8.33 | 0.2318 | -0.0496 | |||
| AMTM / Amentum Holdings, Inc. | 0.00 | 0.01 | 0.2240 | 0.2240 | |||||
| DOW / Dow Inc. | 0.00 | 0.00 | 0.01 | 10.00 | 0.2225 | -0.0212 | |||
| BAC / Bank of America Corporation | 0.00 | 0.00 | 0.01 | -9.09 | 0.2194 | -0.0286 | |||
| PPG / PPG Industries, Inc. | 0.00 | 0.00 | 0.01 | 12.50 | 0.1877 | -0.0135 | |||
| EQR / Equity Residential | 0.00 | 0.00 | 0.01 | 12.50 | 0.1858 | -0.0093 | |||
| BURL / Burlington Stores, Inc. | 0.00 | 0.00 | 0.01 | 12.50 | 0.1841 | -0.0050 | |||
| WRB / W. R. Berkley Corporation | 0.00 | 49.46 | 0.01 | 0.00 | 0.1574 | -0.0071 | |||
| LEN / Lennar Corporation | 0.00 | 0.00 | 0.01 | 40.00 | 0.1497 | 0.0147 | |||
| HEI / HEICO Corporation | 0.00 | 18.18 | 0.01 | 50.00 | 0.1357 | 0.0250 | |||
| AXTA / Axalta Coating Systems Ltd. | 0.00 | 0.00 | 0.01 | 0.00 | 0.1322 | -0.0086 | |||
| MTCH / Match Group, Inc. | 0.00 | 0.00 | 0.01 | 20.00 | 0.1254 | 0.0119 | |||
| BJ / BJ's Wholesale Club Holdings, Inc. | 0.00 | -85.74 | 0.01 | -86.67 | 0.1218 | -0.9044 | |||
| US21871X1090 / Corebridge Financial, Inc. | 0.00 | 0.00 | 0.01 | 0.00 | 0.1205 | -0.0152 | |||
| BAH / Booz Allen Hamilton Holding Corporation | 0.00 | 0.00 | 0.01 | 0.00 | 0.1072 | -0.0071 | |||
| AVB / AvalonBay Communities, Inc. | 0.00 | -66.18 | 0.01 | -58.33 | 0.1034 | -0.1971 | |||
| ACM / AECOM | 0.00 | 85.19 | 0.01 | 150.00 | 0.1031 | 0.0495 | |||
| RGLD / Royal Gold, Inc. | 0.00 | 0.01 | 0.1008 | 0.1008 | |||||
| VST / Vistra Corp. | 0.00 | 0.00 | 0.00 | 33.33 | 0.0946 | 0.0172 | |||
| LECO / Lincoln Electric Holdings, Inc. | 0.00 | 0.00 | 0.00 | 0.00 | 0.0882 | -0.0095 | |||
| WMB / The Williams Companies, Inc. | 0.00 | 0.00 | 0.00 | 0.00 | 0.0866 | -0.0043 | |||
| QCOM / QUALCOMM Incorporated | 0.00 | 0.00 | 0.00 | -25.00 | 0.0781 | -0.0251 | |||
| FOXA / Fox Corporation | 0.00 | 0.00 | 0.0727 | 0.0727 | |||||
| KDP / Keurig Dr Pepper Inc. | 0.00 | 0.00 | 0.00 | 0.00 | 0.0688 | -0.0003 | |||
| SO / The Southern Company | 0.00 | 0.00 | 0.00 | 0.00 | 0.0594 | 0.0018 | |||
| RCL / Royal Caribbean Cruises Ltd. | 0.00 | 0.00 | 0.0531 | 0.0531 | |||||
| PWR / Quanta Services, Inc. | 0.00 | 0.00 | 0.00 | 0.00 | 0.0476 | 0.0019 | |||
| CVX / Chevron Corporation | 0.00 | -73.33 | 0.00 | -77.78 | 0.0470 | -0.1642 | |||
| A / Agilent Technologies, Inc. | 0.00 | 0.00 | 0.00 | 100.00 | 0.0445 | 0.0007 | |||
| LDOS / Leidos Holdings, Inc. | 0.00 | 0.00 | 0.0423 | 0.0423 | |||||
| SEIC / SEI Investments Company | 0.00 | 0.00 | 0.0414 | 0.0414 | |||||
| ALV / Autoliv, Inc. | 0.00 | -94.07 | 0.00 | -95.45 | 0.0391 | -0.7360 | |||
| IRM / Iron Mountain Incorporated | 0.00 | 0.00 | 0.00 | 0.00 | 0.0356 | 0.0053 | |||
| ROST / Ross Stores, Inc. | 0.00 | 0.00 | 0.0150 | 0.0150 | |||||
| ATMU / Atmus Filtration Technologies Inc. | 0.00 | 0.00 | 0.0000 | 0.0000 | |||||
| CINF / Cincinnati Financial Corporation | 0.00 | -100.00 | 0.00 | -100.00 | -0.0718 |