Mga Batayang Estadistika
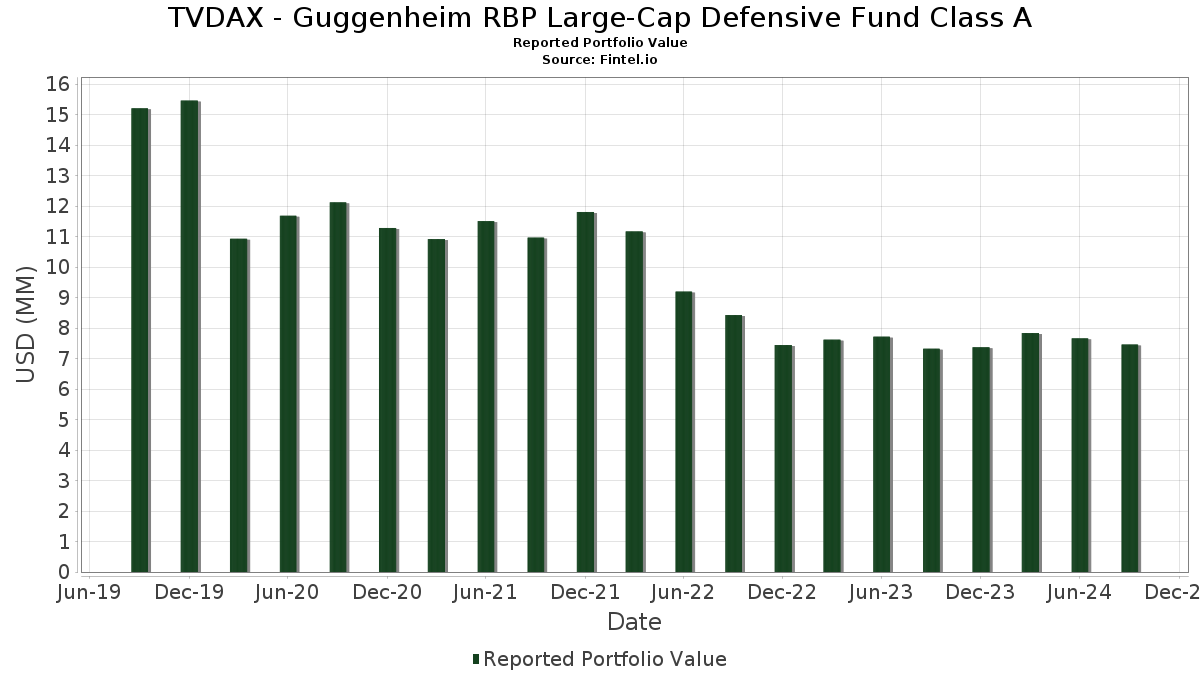
| Nilai Portofolio | $ 7,461,546 |
| Posisi Saat Ini | 101 |
Kepemilikan Terbaru, Kinerja, AUM (dari 13F, 13D)
TVDAX - Guggenheim RBP Large-Cap Defensive Fund Class A telah mengungkapkan total kepemilikan 101 dalam pengajuan SEC terbaru mereka. Nilai portofolio terbaru dihitung sebesar $ 7,461,546 USD. Aset yang Dikelola (AUM) sebenarnya adalah nilai ini ditambah kas (yang tidak diungkapkan). Aset-aset utama TVDAX - Guggenheim RBP Large-Cap Defensive Fund Class A adalah Microsoft Corporation (US:MSFT) , Direxion Shares ETF Trust - Direxion Daily NVDA Bear 1X Shares (US:NVDD) , Apple Inc. (US:AAPL) , Alphabet Inc. (US:GOOG) , and Amazon.com, Inc. (US:AMZN) . Posisi baru TVDAX - Guggenheim RBP Large-Cap Defensive Fund Class A meliputi: Republic Services, Inc. (US:RSG) , General Electric Company (US:GE) , Parker-Hannifin Corporation (US:PH) , Xylem Inc. (US:XYL) , and United Therapeutics Corporation (US:UTHR) .
Peningkatan Tertinggi Kuartal Ini
Kami menggunakan perubahan dalam alokasi portofolio karena ini adalah metrik yang paling bermakna. Perubahan dapat disebabkan oleh perdagangan atau perubahan harga saham.
| Keamanan | Saham (MM) |
Nilai (Juta Dolar AS) |
Portfolio % | ΔPorsyento ng Portfolio |
|---|---|---|---|---|
| 0.00 | 0.12 | 1.6119 | 1.3269 | |
| 0.00 | 0.12 | 1.6079 | 1.3189 | |
| 0.00 | 0.32 | 4.2096 | 1.1134 | |
| 0.00 | 0.08 | 1.0950 | 1.0950 | |
| 0.00 | 0.10 | 1.2942 | 0.8062 | |
| 0.00 | 0.15 | 2.0252 | 0.6380 | |
| 0.00 | 0.05 | 0.6688 | 0.6339 | |
| 0.00 | 0.05 | 0.6218 | 0.6218 | |
| 0.00 | 0.40 | 5.2518 | 0.4097 | |
| 0.00 | 0.14 | 1.8235 | 0.3682 |
Penurunan Tertinggi Kuartal Ini
Kami menggunakan perubahan dalam alokasi portofolio karena ini adalah metrik yang paling bermakna. Perubahan dapat disebabkan oleh perdagangan atau perubahan harga saham.
| Keamanan | Saham (MM) |
Nilai (Juta Dolar AS) |
Portfolio % | ΔPorsyento ng Portfolio |
|---|---|---|---|---|
| 0.00 | 0.01 | 0.1090 | -2.4710 | |
| 0.00 | 0.06 | 0.7446 | -1.7508 | |
| 0.00 | 0.00 | -1.4148 | ||
| 0.00 | 0.02 | 0.1993 | -1.3285 | |
| 0.00 | 0.01 | 0.1271 | -1.2174 | |
| 0.00 | 0.02 | 0.2183 | -1.1926 | |
| 0.00 | 0.02 | 0.2673 | -0.9292 | |
| 0.00 | 0.56 | 7.3726 | -0.9116 | |
| 0.00 | 0.36 | 4.8076 | -0.7564 | |
| 0.00 | 0.01 | 0.0807 | -0.5732 |
Pengajuan 13F dan Dana
Formulir ini diajukan pada 2024-11-29 untuk periode pelaporan 2024-09-30. Klik ikon tautan untuk melihat riwayat transaksi selengkapnya.
Tingkatkan ke versi premium untuk membuka data premium dan ekspor ke Excel. ![]() .
.
| Keamanan | Ketik | Harga Saham Rata-rata | Saham (MM) |
ΔSaham (%) |
ΔSaham (%) |
Nilai ($MM) |
Portpolyo (%) |
ΔPortofolio (%) |
|
|---|---|---|---|---|---|---|---|---|---|
| MSFT / Microsoft Corporation | 0.00 | -9.85 | 0.56 | -13.15 | 7.3726 | -0.9116 | |||
| NVDD / Direxion Shares ETF Trust - Direxion Daily NVDA Bear 1X Shares | 0.00 | 7.60 | 0.40 | 5.90 | 5.2518 | 0.4097 | |||
| AAPL / Apple Inc. | 0.00 | -5.43 | 0.39 | 4.62 | 5.1217 | 0.3476 | |||
| GOOG / Alphabet Inc. | 0.00 | -7.56 | 0.36 | -15.85 | 4.8076 | -0.7564 | |||
| AMZN / Amazon.com, Inc. | 0.00 | 37.51 | 0.32 | 32.22 | 4.2096 | 1.1134 | |||
| META / Meta Platforms, Inc. | 0.00 | -11.15 | 0.29 | 0.69 | 3.8776 | 0.1288 | |||
| LLY / Eli Lilly and Company | 0.00 | -9.60 | 0.20 | -11.50 | 2.6593 | -0.2724 | |||
| JPM / JPMorgan Chase & Co. | 0.00 | -8.00 | 0.19 | -4.46 | 2.5766 | -0.0432 | |||
| V / Visa Inc. | 0.00 | -15.97 | 0.17 | -11.23 | 2.2094 | -0.3081 | |||
| MA / Mastercard Incorporated | 0.00 | -13.40 | 0.17 | -3.51 | 2.2037 | -0.0134 | |||
| WMT / Walmart Inc. | 0.00 | -18.11 | 0.16 | -2.48 | 2.0957 | 0.0031 | |||
| COST / Costco Wholesale Corporation | 0.00 | 36.51 | 0.15 | 42.06 | 2.0252 | 0.6380 | |||
| CEG / Constellation Energy Corporation | 0.00 | -5.88 | 0.14 | 22.32 | 1.8235 | 0.3682 | |||
| ABT / Abbott Laboratories | 0.00 | -13.50 | 0.13 | -5.04 | 1.7565 | -0.0483 | |||
| MRK / Merck & Co., Inc. | 0.00 | -10.51 | 0.13 | -18.24 | 1.7345 | -0.3260 | |||
| ANET / Arista Networks Inc | 0.00 | -14.65 | 0.13 | -6.62 | 1.6925 | -0.0734 | |||
| BSX / Boston Scientific Corporation | 0.00 | -12.87 | 0.13 | -5.30 | 1.6729 | -0.0478 | |||
| TJX / The TJX Companies, Inc. | 0.00 | -14.10 | 0.12 | -8.15 | 1.6548 | -0.1049 | |||
| TMUS / T-Mobile US, Inc. | 0.00 | -19.07 | 0.12 | -5.43 | 1.6281 | -0.0469 | |||
| VOO / Vanguard Index Funds - Vanguard S&P 500 ETF | 0.00 | 422.73 | 0.12 | 450.00 | 1.6119 | 1.3269 | |||
| SO / The Southern Company | 0.00 | -14.33 | 0.12 | 0.00 | 1.6110 | 0.0336 | |||
| SPY / SPDR S&P 500 ETF | 0.00 | 414.63 | 0.12 | 450.00 | 1.6079 | 1.3189 | |||
| ICE / Intercontinental Exchange, Inc. | 0.00 | -14.48 | 0.12 | 0.00 | 1.6002 | 0.0452 | |||
| BDX / Becton, Dickinson and Company | 0.00 | -4.32 | 0.12 | -0.85 | 1.5595 | 0.0187 | |||
| TRV / The Travelers Companies, Inc. | 0.00 | -19.06 | 0.11 | -6.67 | 1.4926 | -0.0692 | |||
| ACGL / Arch Capital Group Ltd. | 0.00 | -18.84 | 0.11 | -9.68 | 1.4919 | -0.1246 | |||
| PEP / PepsiCo, Inc. | 0.00 | -29.01 | 0.11 | -27.40 | 1.4206 | -0.4721 | |||
| COR / Cencora, Inc. | 0.00 | -8.67 | 0.11 | -8.62 | 1.4170 | -0.0975 | |||
| MDLZ / Mondelez International, Inc. | 0.00 | -5.29 | 0.10 | 7.22 | 1.3836 | 0.1181 | |||
| STZ / Constellation Brands, Inc. | 0.00 | -14.92 | 0.10 | -14.78 | 1.3074 | -0.1888 | |||
| KO / The Coca-Cola Company | 0.00 | 129.05 | 0.10 | 162.16 | 1.2942 | 0.8062 | |||
| EG / Everest Group, Ltd. | 0.00 | -9.63 | 0.10 | -6.86 | 1.2698 | -0.0627 | |||
| ITW / Illinois Tool Works Inc. | 0.00 | -9.54 | 0.09 | 1.16 | 1.1556 | 0.0292 | |||
| UNH / UnitedHealth Group Incorporated | 0.00 | 0.08 | 1.0950 | 1.0950 | |||||
| FE / FirstEnergy Corp. | 0.00 | -11.11 | 0.08 | 3.80 | 1.0933 | 0.0583 | |||
| NEE / NextEra Energy, Inc. | 0.00 | -18.10 | 0.07 | -2.70 | 0.9655 | 0.0025 | |||
| CMS / CMS Energy Corporation | 0.00 | -10.57 | 0.07 | 6.35 | 0.8968 | 0.0726 | |||
| ORCL / Oracle Corporation | 0.00 | -8.64 | 0.07 | 10.00 | 0.8849 | 0.1022 | |||
| NOW / ServiceNow, Inc. | 0.00 | 15.62 | 0.07 | 32.00 | 0.8791 | 0.2269 | |||
| ABBV / AbbVie Inc. | 0.00 | -12.36 | 0.06 | -4.69 | 0.8183 | -0.0037 | |||
| MSI / Motorola Solutions, Inc. | 0.00 | 10.74 | 0.06 | 30.43 | 0.8002 | 0.1952 | |||
| INTU / Intuit Inc. | 0.00 | -14.41 | 0.06 | -19.44 | 0.7836 | -0.1613 | |||
| VRTX / Vertex Pharmaceuticals Incorporated | 0.00 | 63.51 | 0.06 | 64.71 | 0.7474 | 0.2982 | |||
| AVGO / Broadcom Inc. | 0.00 | 170.83 | 0.06 | -70.83 | 0.7446 | -1.7508 | |||
| NFLX / Netflix, Inc. | 0.00 | 1,675.00 | 0.05 | 2,400.00 | 0.6688 | 0.6339 | |||
| SHW / The Sherwin-Williams Company | 0.00 | 51.76 | 0.05 | 96.00 | 0.6539 | 0.3254 | |||
| AEP / American Electric Power Company, Inc. | 0.00 | -5.20 | 0.05 | 11.63 | 0.6459 | 0.0777 | |||
| ECL / Ecolab Inc. | 0.00 | 16.88 | 0.05 | 23.68 | 0.6342 | 0.1409 | |||
| CI / The Cigna Group | 0.00 | -9.93 | 0.05 | -4.08 | 0.6258 | -0.0207 | |||
| CL / Colgate-Palmolive Company | 0.00 | 0.05 | 0.6218 | 0.6218 | |||||
| SNPS / Synopsys, Inc. | 0.00 | 12.99 | 0.04 | -2.22 | 0.5851 | -0.0083 | |||
| DXCM / DexCom, Inc. | 0.00 | -14.04 | 0.04 | -50.00 | 0.5289 | -0.4859 | |||
| TW / Tradeweb Markets Inc. | 0.00 | 0.00 | 0.03 | 16.00 | 0.3959 | 0.0650 | |||
| WELL / Welltower Inc. | 0.00 | -24.00 | 0.03 | -6.45 | 0.3877 | -0.0174 | |||
| FDX / FedEx Corporation | 0.00 | 12.36 | 0.03 | 3.85 | 0.3635 | 0.0179 | |||
| TT / Trane Technologies plc | 0.00 | 176.00 | 0.03 | 225.00 | 0.3563 | 0.2497 | |||
| O / Realty Income Corporation | 0.00 | -13.02 | 0.02 | 4.35 | 0.3319 | 0.0220 | |||
| EHC / Encompass Health Corporation | 0.00 | 0.00 | 0.02 | 9.09 | 0.3312 | 0.0445 | |||
| RSG / Republic Services, Inc. | 0.00 | 0.02 | 0.3068 | 0.3068 | |||||
| GE / General Electric Company | 0.00 | 0.02 | 0.2905 | 0.2905 | |||||
| ZTS / Zoetis Inc. | 0.00 | -79.68 | 0.02 | -77.27 | 0.2673 | -0.9292 | |||
| CDNS / Cadence Design Systems, Inc. | 0.00 | -24.10 | 0.02 | -32.00 | 0.2268 | -0.1041 | |||
| J / Jacobs Solutions Inc. | 0.00 | 0.00 | 0.02 | -5.88 | 0.2225 | -0.0091 | |||
| DOV / Dover Corporation | 0.00 | 0.02 | 0.2216 | 0.2216 | |||||
| AMGN / Amgen Inc. | 0.00 | -86.82 | 0.02 | -84.62 | 0.2183 | -1.1926 | |||
| DIS / The Walt Disney Company | 0.00 | -86.87 | 0.02 | -87.18 | 0.1993 | -1.3285 | |||
| AMP / Ameriprise Financial, Inc. | 0.00 | 42.86 | 0.01 | 75.00 | 0.1872 | 0.0710 | |||
| LNT / Alliant Energy Corporation | 0.00 | 0.00 | 0.01 | 18.18 | 0.1846 | 0.0336 | |||
| NRG / NRG Energy, Inc. | 0.00 | 0.00 | 0.01 | 18.18 | 0.1791 | 0.0298 | |||
| AMH / American Homes 4 Rent | 0.00 | 0.00 | 0.01 | 8.33 | 0.1744 | 0.0098 | |||
| HEI / HEICO Corporation | 0.00 | 36.11 | 0.01 | 50.00 | 0.1702 | 0.0659 | |||
| HLT / Hilton Worldwide Holdings Inc. | 0.00 | 1.85 | 0.01 | 9.09 | 0.1684 | 0.0158 | |||
| BKNG / Booking Holdings Inc. | 0.00 | 0.00 | 0.01 | 9.09 | 0.1678 | 0.0139 | |||
| APH / Amphenol Corporation | 0.00 | 0.00 | 0.01 | -8.33 | 0.1575 | -0.0013 | |||
| VST / Vistra Corp. | 0.00 | 0.00 | 0.01 | 37.50 | 0.1559 | 0.0456 | |||
| AVB / AvalonBay Communities, Inc. | 0.00 | 0.01 | 0.1556 | 0.1556 | |||||
| LDOS / Leidos Holdings, Inc. | 0.00 | 144.83 | 0.01 | 175.00 | 0.1537 | 0.0989 | |||
| GRMN / Garmin Ltd. | 0.00 | 0.00 | 0.01 | 11.11 | 0.1403 | 0.0137 | |||
| IR / Ingersoll Rand Inc. | 0.00 | 0.00 | 0.01 | 11.11 | 0.1369 | 0.0134 | |||
| PH / Parker-Hannifin Corporation | 0.00 | 0.01 | 0.1343 | 0.1343 | |||||
| PANW / Palo Alto Networks, Inc. | 0.00 | -93.32 | 0.01 | -94.19 | 0.1271 | -1.2174 | |||
| CACI / CACI International Inc | 0.00 | -21.74 | 0.01 | 0.00 | 0.1206 | -0.0075 | |||
| XOM / Exxon Mobil Corporation | 0.00 | -96.12 | 0.01 | -95.96 | 0.1090 | -2.4710 | |||
| FICO / Fair Isaac Corporation | 0.00 | 0.00 | 0.01 | 40.00 | 0.1033 | 0.0261 | |||
| XYL / Xylem Inc. | 0.00 | 0.01 | 0.0915 | 0.0915 | |||||
| UTHR / United Therapeutics Corporation | 0.00 | 0.01 | 0.0904 | 0.0904 | |||||
| EME / EMCOR Group, Inc. | 0.00 | 0.00 | 0.01 | 20.00 | 0.0858 | 0.0148 | |||
| CHD / Church & Dwight Co., Inc. | 0.00 | -93.36 | 0.01 | -91.67 | 0.0807 | -0.5732 | |||
| BAH / Booz Allen Hamilton Holding Corporation | 0.00 | 0.00 | 0.01 | 0.00 | 0.0735 | 0.0057 | |||
| ERIE / Erie Indemnity Company | 0.00 | 0.00 | 0.00 | 33.33 | 0.0645 | 0.0223 | |||
| AMTM / Amentum Holdings, Inc. | 0.00 | 0.00 | 0.0548 | 0.0548 | |||||
| HIG / The Hartford Insurance Group, Inc. | 0.00 | 0.00 | 0.00 | 0.00 | 0.0531 | 0.0088 | |||
| GDDY / GoDaddy Inc. | 0.00 | 0.00 | 0.00 | 0.00 | 0.0521 | 0.0068 | |||
| NTAP / NetApp, Inc. | 0.00 | 0.00 | 0.00 | 0.00 | 0.0509 | -0.0009 | |||
| DECK / Deckers Outdoor Corporation | 0.00 | 500.00 | 0.00 | 0.00 | 0.0508 | 0.0007 | |||
| TYL / Tyler Technologies, Inc. | 0.00 | 0.00 | 0.00 | 0.00 | 0.0465 | 0.0074 | |||
| YUM / Yum! Brands, Inc. | 0.00 | 0.00 | 0.00 | 0.00 | 0.0464 | 0.0035 | |||
| PTC / PTC Inc. | 0.00 | 0.00 | 0.00 | 0.00 | 0.0384 | 0.0007 | |||
| EGP / EastGroup Properties, Inc. | 0.00 | 0.00 | 0.0372 | 0.0372 | |||||
| OXY / Occidental Petroleum Corporation | 0.00 | 0.00 | 0.00 | -33.33 | 0.0363 | -0.0070 | |||
| RMD / ResMed Inc. | 0.00 | 0.00 | 0.0357 | 0.0357 | |||||
| CRM / Salesforce, Inc. | 0.00 | -100.00 | 0.00 | -100.00 | -0.1232 | ||||
| ACN / Accenture plc | 0.00 | -100.00 | 0.00 | -100.00 | -1.4148 | ||||
| NBIX / Neurocrine Biosciences, Inc. | 0.00 | -100.00 | 0.00 | -100.00 | -0.0678 |