Mga Batayang Estadistika
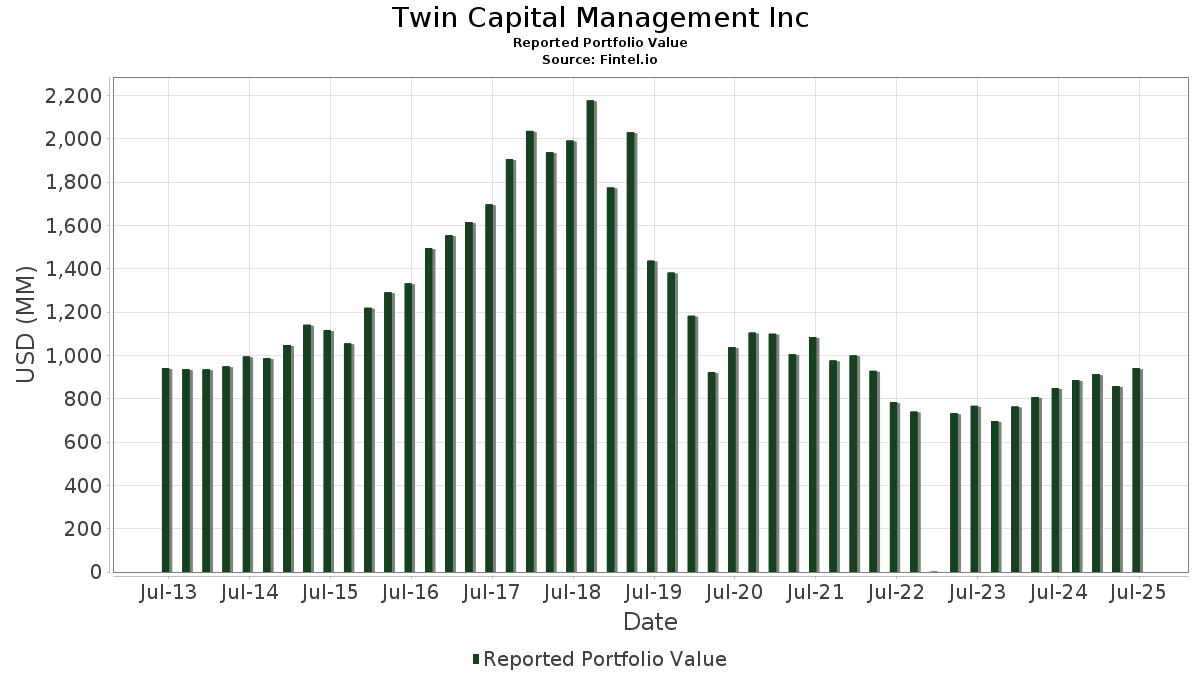
| Nilai Portofolio | $ 940,759,440 |
| Posisi Saat Ini | 256 |
Kepemilikan Terbaru, Kinerja, AUM (dari 13F, 13D)
Twin Capital Management Inc telah mengungkapkan total kepemilikan 256 dalam pengajuan SEC terbaru mereka. Nilai portofolio terbaru dihitung sebesar $ 940,759,440 USD. Aset yang Dikelola (AUM) sebenarnya adalah nilai ini ditambah kas (yang tidak diungkapkan). Aset-aset utama Twin Capital Management Inc adalah Microsoft Corporation (US:MSFT) , NVIDIA Corporation (US:NVDA) , Apple Inc. (US:AAPL) , Amazon.com, Inc. (US:AMZN) , and Broadcom Inc. (US:AVGO) . Posisi baru Twin Capital Management Inc meliputi: RB Global, Inc. (US:RBA) , Synovus Financial Corp. (US:SNV) , .
Peningkatan Tertinggi Kuartal Ini
Kami menggunakan perubahan dalam alokasi portofolio karena ini adalah metrik yang paling bermakna. Perubahan dapat disebabkan oleh perdagangan atau perubahan harga saham.
| Keamanan | Saham (MM) |
Nilai (Juta Dolar AS) |
Portfolio % | ΔPorsyento ng Portfolio |
|---|---|---|---|---|
| 0.36 | 56.91 | 6.0494 | 1.5559 | |
| 0.13 | 65.65 | 6.9779 | 1.2477 | |
| 0.10 | 28.36 | 3.0143 | 1.0219 | |
| 0.04 | 5.36 | 0.5700 | 0.5118 | |
| 0.06 | 4.21 | 0.4471 | 0.4471 | |
| 0.02 | 5.33 | 0.5666 | 0.4104 | |
| 0.03 | 24.87 | 2.6431 | 0.4043 | |
| 0.02 | 5.88 | 0.6246 | 0.3910 | |
| 0.01 | 3.21 | 0.3413 | 0.3413 | |
| 0.01 | 2.73 | 0.2899 | 0.2899 |
Penurunan Tertinggi Kuartal Ini
Kami menggunakan perubahan dalam alokasi portofolio karena ini adalah metrik yang paling bermakna. Perubahan dapat disebabkan oleh perdagangan atau perubahan harga saham.
| Keamanan | Saham (MM) |
Nilai (Juta Dolar AS) |
Portfolio % | ΔPorsyento ng Portfolio |
|---|---|---|---|---|
| 0.27 | 54.93 | 5.8390 | -0.9270 | |
| 0.01 | 3.55 | 0.3775 | -0.7527 | |
| 0.00 | 1.46 | 0.1549 | -0.2942 | |
| 0.01 | 1.95 | 0.2076 | -0.2857 | |
| 0.03 | 13.05 | 1.3876 | -0.2575 | |
| 0.11 | 5.07 | 0.5385 | -0.2337 | |
| 0.01 | 3.07 | 0.3263 | -0.2332 | |
| 0.02 | 2.36 | 0.2504 | -0.1886 | |
| 0.06 | 9.75 | 1.0367 | -0.1857 | |
| 0.00 | 1.09 | 0.1160 | -0.1856 |
Pengajuan 13F dan Dana
Formulir ini diajukan pada 2025-08-06 untuk periode pelaporan 2025-06-30. Klik ikon tautan untuk melihat riwayat transaksi selengkapnya.
Tingkatkan ke versi premium untuk membuka data premium dan ekspor ke Excel. ![]() .
.
| Keamanan | Ketik | Harga Saham Rata-rata | Saham (MM) |
ΔSaham (%) |
ΔSaham (%) |
Nilai ($MM) |
Portpolyo (%) |
ΔPortofolio (%) |
|
|---|---|---|---|---|---|---|---|---|---|
| MSFT / Microsoft Corporation | 0.13 | 0.86 | 65.65 | 33.65 | 6.9779 | 1.2477 | |||
| NVDA / NVIDIA Corporation | 0.36 | 1.36 | 56.91 | 47.75 | 6.0494 | 1.5559 | |||
| AAPL / Apple Inc. | 0.27 | 2.54 | 54.93 | -5.28 | 5.8390 | -0.9270 | |||
| AMZN / Amazon.com, Inc. | 0.15 | 1.27 | 32.03 | 16.77 | 3.4048 | 0.2047 | |||
| AVGO / Broadcom Inc. | 0.10 | 0.85 | 28.36 | 66.03 | 3.0143 | 1.0219 | |||
| GOOGL / Alphabet Inc. | 0.15 | 1.67 | 26.52 | 15.87 | 2.8193 | 0.1488 | |||
| META / Meta Platforms, Inc. | 0.03 | 1.18 | 24.87 | 29.57 | 2.6431 | 0.4043 | |||
| JPM / JPMorgan Chase & Co. | 0.06 | 0.79 | 17.36 | 19.13 | 1.8458 | 0.1452 | |||
| LLY / Eli Lilly and Company | 0.02 | 7.96 | 15.10 | 1.90 | 1.6056 | -0.1237 | |||
| TSLA / Tesla, Inc. | 0.04 | 1.27 | 13.37 | 24.13 | 1.4213 | 0.1646 | |||
| BRK.B / Berkshire Hathaway Inc. | 0.03 | 1.49 | 13.05 | -7.43 | 1.3876 | -0.2575 | |||
| V / Visa Inc. | 0.03 | 0.69 | 11.08 | 2.01 | 1.1775 | -0.0894 | |||
| PG / The Procter & Gamble Company | 0.06 | -0.44 | 9.75 | -6.93 | 1.0367 | -0.1857 | |||
| NFLX / Netflix, Inc. | 0.01 | 1.78 | 9.41 | 46.16 | 1.0001 | 0.2491 | |||
| ORCL / Oracle Corporation | 0.04 | -2.16 | 8.75 | 52.99 | 0.9296 | 0.2627 | |||
| XOM / Exxon Mobil Corporation | 0.08 | 9.42 | 8.66 | -0.82 | 0.9204 | -0.0981 | |||
| JNJ / Johnson & Johnson | 0.05 | 0.14 | 8.17 | -7.76 | 0.8681 | -0.1649 | |||
| COST / Costco Wholesale Corporation | 0.01 | 0.27 | 8.13 | 4.96 | 0.8644 | -0.0395 | |||
| ABT / Abbott Laboratories | 0.06 | 12.12 | 7.78 | 14.96 | 0.8266 | 0.0374 | |||
| GS / The Goldman Sachs Group, Inc. | 0.01 | 0.51 | 7.61 | 30.23 | 0.8093 | 0.1272 | |||
| KO / The Coca-Cola Company | 0.11 | 11.31 | 7.54 | 9.96 | 0.8017 | 0.0015 | |||
| ABBV / AbbVie Inc. | 0.04 | 3.48 | 7.50 | -8.32 | 0.7972 | -0.1572 | |||
| INTU / Intuit Inc. | 0.01 | -10.04 | 7.41 | 15.41 | 0.7872 | 0.0386 | |||
| WMT / Walmart Inc. | 0.07 | 1.82 | 7.28 | 13.41 | 0.7734 | 0.0249 | |||
| QCOM / QUALCOMM Incorporated | 0.04 | 9.43 | 7.14 | 13.45 | 0.7589 | 0.0248 | |||
| HD / The Home Depot, Inc. | 0.02 | -0.62 | 6.75 | -0.59 | 0.7173 | -0.0745 | |||
| DIS / The Walt Disney Company | 0.05 | 34.78 | 6.50 | 69.35 | 0.6913 | 0.2433 | |||
| WFC / Wells Fargo & Company | 0.08 | 1.14 | 6.42 | 12.89 | 0.6826 | 0.0189 | |||
| MMM / 3M Company | 0.04 | 1.45 | 6.04 | 5.17 | 0.6425 | -0.0280 | |||
| LIN / Linde plc | 0.01 | 2.75 | 5.93 | 3.55 | 0.6301 | -0.0379 | |||
| GE / General Electric Company | 0.02 | -19.63 | 5.88 | 3.34 | 0.6247 | -0.0386 | |||
| IBM / International Business Machines Corporation | 0.02 | 147.60 | 5.88 | 193.60 | 0.6246 | 0.3910 | |||
| VZ / Verizon Communications Inc. | 0.13 | 0.63 | 5.68 | -4.01 | 0.6033 | -0.0865 | |||
| AMGN / Amgen Inc. | 0.02 | 1.52 | 5.67 | -9.03 | 0.6031 | -0.1244 | |||
| ETN / Eaton Corporation plc | 0.02 | 0.67 | 5.51 | 32.21 | 0.5855 | 0.0995 | |||
| PLTR / Palantir Technologies Inc. | 0.04 | -1.05 | 5.39 | 59.85 | 0.5726 | 0.1794 | |||
| EMR / Emerson Electric Co. | 0.04 | 783.70 | 5.36 | 976.71 | 0.5700 | 0.5118 | |||
| HON / Honeywell International Inc. | 0.02 | 261.95 | 5.33 | 298.06 | 0.5666 | 0.4104 | |||
| CVX / Chevron Corporation | 0.04 | 0.21 | 5.24 | -14.23 | 0.5568 | -0.1557 | |||
| CMCSA / Comcast Corporation | 0.15 | 5.05 | 5.18 | 1.61 | 0.5502 | -0.0441 | |||
| BMY / Bristol-Myers Squibb Company | 0.11 | 0.84 | 5.07 | -23.48 | 0.5385 | -0.2337 | |||
| CBRE / CBRE Group, Inc. | 0.04 | 0.23 | 5.06 | 7.39 | 0.5374 | -0.0118 | |||
| FTNT / Fortinet, Inc. | 0.05 | 2.06 | 5.04 | 12.09 | 0.5362 | 0.0112 | |||
| KLAC / KLA Corporation | 0.01 | -12.10 | 4.97 | 15.84 | 0.5278 | 0.0277 | |||
| CAT / Caterpillar Inc. | 0.01 | -20.58 | 4.82 | -6.52 | 0.5125 | -0.0892 | |||
| MRK / Merck & Co., Inc. | 0.06 | -0.72 | 4.76 | -12.45 | 0.5063 | -0.1284 | |||
| PHM / PulteGroup, Inc. | 0.04 | 0.95 | 4.63 | 3.56 | 0.4917 | -0.0294 | |||
| PAYX / Paychex, Inc. | 0.03 | 0.72 | 4.52 | -5.04 | 0.4809 | -0.0749 | |||
| BSX / Boston Scientific Corporation | 0.04 | 2.13 | 4.46 | 8.73 | 0.4741 | -0.0044 | |||
| ADBE / Adobe Inc. | 0.01 | 1.35 | 4.43 | 2.24 | 0.4710 | -0.0346 | |||
| PWR / Quanta Services, Inc. | 0.01 | 1.20 | 4.41 | 50.55 | 0.4693 | 0.1271 | |||
| ANET / Arista Networks Inc | 0.04 | 4.10 | 4.41 | 37.48 | 0.4691 | 0.0946 | |||
| SCHW / The Charles Schwab Corporation | 0.05 | -0.33 | 4.37 | 16.17 | 0.4643 | 0.0257 | |||
| KR / The Kroger Co. | 0.06 | 1.25 | 4.33 | 7.28 | 0.4607 | -0.0106 | |||
| CB / Chubb Limited | 0.01 | 0.43 | 4.30 | -3.65 | 0.4569 | -0.0635 | |||
| EOG / EOG Resources, Inc. | 0.04 | 0.91 | 4.30 | -5.87 | 0.4566 | -0.0758 | |||
| COF / Capital One Financial Corporation | 0.02 | 2.13 | 4.27 | 21.18 | 0.4537 | 0.0428 | |||
| CRM / Salesforce, Inc. | 0.02 | 0.99 | 4.26 | 2.60 | 0.4525 | -0.0314 | |||
| DUK / Duke Energy Corporation | 0.04 | 1.23 | 4.21 | -2.07 | 0.4480 | -0.0541 | |||
| NEE / NextEra Energy, Inc. | 0.06 | 4.21 | 0.4471 | 0.4471 | |||||
| C / Citigroup Inc. | 0.05 | 2.31 | 4.17 | 22.68 | 0.4433 | 0.0467 | |||
| RTX / RTX Corporation | 0.03 | 3.81 | 4.14 | 14.45 | 0.4403 | 0.0180 | |||
| ACN / Accenture plc | 0.01 | 4.75 | 3.84 | 0.34 | 0.4079 | -0.0383 | |||
| HIG / The Hartford Insurance Group, Inc. | 0.03 | 0.12 | 3.81 | 2.67 | 0.4050 | -0.0280 | |||
| KIM / Kimco Realty Corporation | 0.18 | 1.66 | 3.80 | 0.61 | 0.4044 | -0.0367 | |||
| WSM / Williams-Sonoma, Inc. | 0.02 | 9.68 | 3.79 | 13.34 | 0.4029 | 0.0127 | |||
| GILD / Gilead Sciences, Inc. | 0.03 | 1.64 | 3.69 | 0.57 | 0.3927 | -0.0359 | |||
| T / AT&T Inc. | 0.12 | -16.22 | 3.61 | -14.27 | 0.3834 | -0.1074 | |||
| UNH / UnitedHealth Group Incorporated | 0.01 | -38.46 | 3.55 | -63.34 | 0.3775 | -0.7527 | |||
| GOOG / Alphabet Inc. | 0.02 | -0.70 | 3.49 | 12.76 | 0.3711 | 0.0099 | |||
| SYK / Stryker Corporation | 0.01 | 2.54 | 3.32 | 8.99 | 0.3532 | -0.0025 | |||
| WAB / Westinghouse Air Brake Technologies Corporation | 0.02 | 2.93 | 3.30 | 18.82 | 0.3503 | 0.0267 | |||
| SHW / The Sherwin-Williams Company | 0.01 | 1.65 | 3.29 | -0.03 | 0.3492 | -0.0342 | |||
| CI / The Cigna Group | 0.01 | 1.98 | 3.25 | 2.46 | 0.3457 | -0.0246 | |||
| CSCO / Cisco Systems, Inc. | 0.05 | 20.20 | 3.24 | 35.18 | 0.3443 | 0.0647 | |||
| EME / EMCOR Group, Inc. | 0.01 | 3.21 | 0.3413 | 0.3413 | |||||
| TT / Trane Technologies plc | 0.01 | 15.81 | 3.18 | 50.38 | 0.3383 | 0.0913 | |||
| SNA / Snap-on Incorporated | 0.01 | -30.67 | 3.07 | -36.00 | 0.3263 | -0.2332 | |||
| GM / General Motors Company | 0.06 | 2.32 | 3.03 | 7.07 | 0.3221 | -0.0081 | |||
| DHI / D.R. Horton, Inc. | 0.02 | 0.34 | 3.01 | 1.73 | 0.3197 | -0.0251 | |||
| GD / General Dynamics Corporation | 0.01 | 1.03 | 3.00 | 8.11 | 0.3187 | -0.0049 | |||
| FAST / Fastenal Company | 0.07 | 104.81 | 2.99 | 10.93 | 0.3174 | 0.0033 | |||
| TROW / T. Rowe Price Group, Inc. | 0.03 | 1.65 | 2.95 | 6.76 | 0.3140 | -0.0087 | |||
| WELL / Welltower Inc. | 0.02 | 77.84 | 2.95 | 78.51 | 0.3135 | 0.1207 | |||
| FIS / Fidelity National Information Services, Inc. | 0.04 | 1.64 | 2.95 | 10.79 | 0.3134 | 0.0030 | |||
| TXN / Texas Instruments Incorporated | 0.01 | 40.06 | 2.92 | 61.81 | 0.3103 | 0.0999 | |||
| EG / Everest Group, Ltd. | 0.01 | 2.74 | 2.89 | -3.92 | 0.3077 | -0.0437 | |||
| ADSK / Autodesk, Inc. | 0.01 | 6.44 | 2.88 | 25.86 | 0.3063 | 0.0392 | |||
| MA / Mastercard Incorporated | 0.01 | 10.19 | 2.88 | 12.97 | 0.3057 | 0.0087 | |||
| MET / MetLife, Inc. | 0.04 | 0.44 | 2.84 | 0.60 | 0.3015 | -0.0274 | |||
| LEN / Lennar Corporation | 0.03 | 3.86 | 2.79 | 0.11 | 0.2970 | -0.0287 | |||
| CTSH / Cognizant Technology Solutions Corporation | 0.04 | 2.03 | 2.75 | 4.09 | 0.2919 | -0.0159 | |||
| AXP / American Express Company | 0.01 | 2.73 | 0.2899 | 0.2899 | |||||
| BK / The Bank of New York Mellon Corporation | 0.03 | 0.48 | 2.72 | 9.15 | 0.2892 | -0.0016 | |||
| AMP / Ameriprise Financial, Inc. | 0.01 | 62.33 | 2.72 | 79.04 | 0.2887 | 0.1117 | |||
| SYF / Synchrony Financial | 0.04 | 2.82 | 2.68 | 29.67 | 0.2844 | 0.0436 | |||
| STT / State Street Corporation | 0.02 | 2.65 | 2.64 | 21.91 | 0.2804 | 0.0280 | |||
| EVRG / Evergy, Inc. | 0.04 | 2.83 | 2.61 | 2.84 | 0.2771 | -0.0187 | |||
| CME / CME Group Inc. | 0.01 | -19.81 | 2.60 | -16.68 | 0.2761 | -0.0876 | |||
| CG / The Carlyle Group Inc. | 0.05 | 3.36 | 2.58 | 21.90 | 0.2739 | 0.0273 | |||
| ORI / Old Republic International Corporation | 0.07 | 2.63 | 2.56 | 0.59 | 0.2718 | -0.0248 | |||
| NTRS / Northern Trust Corporation | 0.02 | 0.47 | 2.54 | 29.14 | 0.2705 | 0.0406 | |||
| TRV / The Travelers Companies, Inc. | 0.01 | -0.07 | 2.53 | 1.08 | 0.2693 | -0.0231 | |||
| ABNB / Airbnb, Inc. | 0.02 | 370.21 | 2.39 | 421.88 | 0.2535 | 0.2001 | |||
| PEP / PepsiCo, Inc. | 0.02 | -28.91 | 2.36 | -37.42 | 0.2504 | -0.1886 | |||
| SW / Smurfit Westrock Plc | 0.05 | -3.82 | 2.32 | -7.87 | 0.2463 | -0.0472 | |||
| ADP / Automatic Data Processing, Inc. | 0.01 | -4.10 | 2.31 | -3.19 | 0.2455 | -0.0328 | |||
| MSI / Motorola Solutions, Inc. | 0.01 | 0.52 | 2.30 | -3.49 | 0.2440 | -0.0334 | |||
| OGE / OGE Energy Corp. | 0.05 | -14.57 | 2.25 | -17.49 | 0.2393 | -0.0791 | |||
| PFE / Pfizer Inc. | 0.09 | 39.21 | 2.25 | 33.20 | 0.2389 | 0.0420 | |||
| AMAT / Applied Materials, Inc. | 0.01 | -2.59 | 2.24 | 22.90 | 0.2380 | 0.0254 | |||
| TJX / The TJX Companies, Inc. | 0.02 | -1.15 | 2.23 | 0.23 | 0.2366 | -0.0225 | |||
| OXY / Occidental Petroleum Corporation | 0.05 | 2.40 | 2.23 | -12.88 | 0.2366 | -0.0614 | |||
| ADM / Archer-Daniels-Midland Company | 0.04 | 2.25 | 2.21 | 12.38 | 0.2346 | 0.0055 | |||
| MDT / Medtronic plc | 0.02 | -1.45 | 2.18 | -4.43 | 0.2316 | -0.0343 | |||
| BAC / Bank of America Corporation | 0.04 | 79.88 | 2.12 | 104.04 | 0.2256 | 0.1042 | |||
| FI / Fiserv, Inc. | 0.01 | 2.64 | 2.07 | -19.88 | 0.2202 | -0.0814 | |||
| APO / Apollo Global Management, Inc. | 0.01 | 39.63 | 2.00 | 44.69 | 0.2128 | 0.0513 | |||
| F / Ford Motor Company | 0.18 | 2.78 | 1.99 | 11.15 | 0.2119 | 0.0027 | |||
| ODFL / Old Dominion Freight Line, Inc. | 0.01 | 3.74 | 1.99 | 1.79 | 0.2114 | -0.0166 | |||
| APP / AppLovin Corporation | 0.01 | 2.37 | 1.96 | 35.26 | 0.2088 | 0.0394 | |||
| CMG / Chipotle Mexican Grill, Inc. | 0.03 | -0.51 | 1.95 | 11.22 | 0.2077 | 0.0028 | |||
| CTAS / Cintas Corporation | 0.01 | -57.40 | 1.95 | -53.81 | 0.2076 | -0.2857 | |||
| DUOL / Duolingo, Inc. | 0.00 | 2.96 | 1.94 | 35.90 | 0.2061 | 0.0397 | |||
| NEM / Newmont Corporation | 0.03 | -14.79 | 1.93 | 2.83 | 0.2047 | -0.0138 | |||
| ARW / Arrow Electronics, Inc. | 0.01 | 2.75 | 1.89 | 26.12 | 0.2013 | 0.0261 | |||
| DOX / Amdocs Limited | 0.02 | 3.03 | 1.88 | 2.79 | 0.1998 | -0.0136 | |||
| SLB / Schlumberger Limited | 0.05 | 1.57 | 1.86 | -17.90 | 0.1976 | -0.0664 | |||
| AMT / American Tower Corporation | 0.01 | -13.37 | 1.86 | -12.03 | 0.1976 | -0.0489 | |||
| GNTX / Gentex Corporation | 0.08 | 2.76 | 1.82 | -3.04 | 0.1933 | -0.0255 | |||
| GXO / GXO Logistics, Inc. | 0.04 | 3.81 | 1.80 | 29.42 | 0.1912 | 0.0290 | |||
| DLR / Digital Realty Trust, Inc. | 0.01 | -22.39 | 1.79 | -5.58 | 0.1906 | -0.0309 | |||
| DRI / Darden Restaurants, Inc. | 0.01 | -1.60 | 1.79 | 3.23 | 0.1905 | -0.0120 | |||
| AEP / American Electric Power Company, Inc. | 0.02 | 0.90 | 1.78 | -4.21 | 0.1888 | -0.0275 | |||
| BILL / BILL Holdings, Inc. | 0.04 | 98.52 | 1.72 | 100.23 | 0.1827 | 0.0825 | |||
| KD / Kyndryl Holdings, Inc. | 0.04 | 2.54 | 1.69 | 37.01 | 0.1795 | 0.0357 | |||
| CL / Colgate-Palmolive Company | 0.02 | 1.71 | 1.67 | -1.36 | 0.1780 | -0.0200 | |||
| SF / Stifel Financial Corp. | 0.02 | 2.18 | 1.67 | 12.50 | 0.1779 | 0.0043 | |||
| ULTA / Ulta Beauty, Inc. | 0.00 | 3.13 | 1.60 | 31.58 | 0.1702 | 0.0283 | |||
| FHN / First Horizon Corporation | 0.07 | 1.54 | 1.56 | 10.86 | 0.1661 | 0.0016 | |||
| MS / Morgan Stanley | 0.01 | -3.37 | 1.56 | 16.68 | 0.1659 | 0.0098 | |||
| SO / The Southern Company | 0.02 | -1.53 | 1.56 | -1.64 | 0.1654 | -0.0192 | |||
| WEC / WEC Energy Group, Inc. | 0.01 | -1.97 | 1.55 | -6.25 | 0.1644 | -0.0281 | |||
| HOLX / Hologic, Inc. | 0.02 | 1.67 | 1.54 | 7.30 | 0.1640 | -0.0038 | |||
| RMD / ResMed Inc. | 0.01 | 59.03 | 1.54 | 83.35 | 0.1639 | 0.0658 | |||
| CVS / CVS Health Corporation | 0.02 | 93.74 | 1.54 | 97.31 | 0.1636 | 0.0726 | |||
| RL / Ralph Lauren Corporation | 0.01 | -0.59 | 1.52 | 23.52 | 0.1614 | 0.0180 | |||
| BIIB / Biogen Inc. | 0.01 | 4.26 | 1.51 | -4.31 | 0.1607 | -0.0236 | |||
| PSA / Public Storage | 0.01 | 2.88 | 1.51 | 0.87 | 0.1602 | -0.0141 | |||
| ECL / Ecolab Inc. | 0.01 | 83.70 | 1.48 | 95.24 | 0.1572 | 0.0688 | |||
| GEN / Gen Digital Inc. | 0.05 | 1.62 | 1.46 | 12.58 | 0.1552 | 0.0039 | |||
| COR / Cencora, Inc. | 0.00 | -64.89 | 1.46 | -62.15 | 0.1549 | -0.2942 | |||
| USFD / US Foods Holding Corp. | 0.02 | 2.77 | 1.41 | 20.85 | 0.1504 | 0.0139 | |||
| FCX / Freeport-McMoRan Inc. | 0.03 | 1.39 | 0.1476 | 0.1476 | |||||
| PNW / Pinnacle West Capital Corporation | 0.02 | 2.97 | 1.36 | -3.27 | 0.1447 | -0.0195 | |||
| RSG / Republic Services, Inc. | 0.01 | 1.31 | 0.1391 | 0.1391 | |||||
| KMB / Kimberly-Clark Corporation | 0.01 | -0.24 | 1.27 | -9.59 | 0.1353 | -0.0289 | |||
| RBA / RB Global, Inc. | 0.01 | 1.27 | 0.1353 | 0.1353 | |||||
| NOW / ServiceNow, Inc. | 0.00 | -1.52 | 1.27 | 27.24 | 0.1346 | 0.0184 | |||
| TAP / Molson Coors Beverage Company | 0.03 | 2.90 | 1.23 | -18.75 | 0.1304 | -0.0456 | |||
| ICE / Intercontinental Exchange, Inc. | 0.01 | -0.21 | 1.21 | 6.16 | 0.1283 | -0.0044 | |||
| FITB / Fifth Third Bancorp | 0.03 | -1.62 | 1.15 | 3.23 | 0.1224 | -0.0077 | |||
| IPG / The Interpublic Group of Companies, Inc. | 0.05 | 11.92 | 1.13 | 0.90 | 0.1196 | -0.0105 | |||
| SPGI / S&P Global Inc. | 0.00 | -59.32 | 1.09 | -57.79 | 0.1160 | -0.1856 | |||
| CNC / Centene Corporation | 0.02 | 35.61 | 1.08 | 21.26 | 0.1146 | 0.0109 | |||
| RJF / Raymond James Financial, Inc. | 0.01 | -2.84 | 1.04 | 7.30 | 0.1109 | -0.0026 | |||
| UNP / Union Pacific Corporation | 0.00 | -1.29 | 1.04 | -3.81 | 0.1101 | -0.0156 | |||
| SNV / Synovus Financial Corp. | 0.02 | 1.03 | 0.1097 | 0.1097 | |||||
| TXT / Textron Inc. | 0.01 | 5.58 | 1.02 | 17.26 | 0.1084 | 0.0070 | |||
| TWLO / Twilio Inc. | 0.01 | 0.99 | 0.1054 | 0.1054 | |||||
| FFIV / F5, Inc. | 0.00 | -0.94 | 0.99 | 9.39 | 0.1053 | -0.0002 | |||
| WMB / The Williams Companies, Inc. | 0.02 | -0.93 | 0.99 | 4.12 | 0.1048 | -0.0057 | |||
| XYL / Xylem Inc. | 0.01 | -2.43 | 0.98 | 5.60 | 0.1042 | -0.0040 | |||
| DVN / Devon Energy Corporation | 0.03 | 3.91 | 0.96 | -11.56 | 0.1025 | -0.0248 | |||
| MANH / Manhattan Associates, Inc. | 0.00 | 3.14 | 0.94 | 17.65 | 0.1000 | 0.0068 | |||
| PGR / The Progressive Corporation | 0.00 | -0.89 | 0.92 | -6.61 | 0.0978 | -0.0170 | |||
| RF / Regions Financial Corporation | 0.04 | -1.61 | 0.92 | 6.50 | 0.0977 | -0.0030 | |||
| PPG / PPG Industries, Inc. | 0.01 | -1.80 | 0.90 | 2.15 | 0.0962 | -0.0072 | |||
| REXR / Rexford Industrial Realty, Inc. | 0.03 | 3.33 | 0.90 | -6.15 | 0.0958 | -0.0162 | |||
| ANSS / ANSYS, Inc. | 0.00 | 30.08 | 0.89 | 44.43 | 0.0951 | 0.0228 | |||
| PNC / The PNC Financial Services Group, Inc. | 0.00 | -1.08 | 0.89 | 4.95 | 0.0947 | -0.0044 | |||
| LULU / lululemon athletica inc. | 0.00 | 1.58 | 0.89 | -14.71 | 0.0943 | -0.0271 | |||
| LOPE / Grand Canyon Education, Inc. | 0.00 | 2.52 | 0.88 | 12.02 | 0.0932 | 0.0019 | |||
| ITT / ITT Inc. | 0.01 | 1.07 | 0.88 | 22.86 | 0.0931 | 0.0098 | |||
| VLO / Valero Energy Corporation | 0.01 | -1.18 | 0.87 | 0.58 | 0.0925 | -0.0084 | |||
| DLTR / Dollar Tree, Inc. | 0.01 | -0.92 | 0.85 | 30.76 | 0.0900 | 0.0144 | |||
| DPZ / Domino's Pizza, Inc. | 0.00 | -1.84 | 0.82 | -3.77 | 0.0869 | -0.0122 | |||
| PYPL / PayPal Holdings, Inc. | 0.01 | -1.37 | 0.82 | 12.41 | 0.0867 | 0.0020 | |||
| CAVA / CAVA Group, Inc. | 0.01 | 2.22 | 0.80 | -0.37 | 0.0849 | -0.0086 | |||
| GRMN / Garmin Ltd. | 0.00 | 0.00 | 0.79 | -3.88 | 0.0843 | -0.0119 | |||
| GPC / Genuine Parts Company | 0.01 | -2.18 | 0.79 | -0.38 | 0.0838 | -0.0085 | |||
| CSL / Carlisle Companies Incorporated | 0.00 | 0.83 | 0.78 | 10.56 | 0.0824 | 0.0006 | |||
| EQT / EQT Corporation | 0.01 | -48.89 | 0.77 | -44.22 | 0.0821 | -0.0794 | |||
| UAL / United Airlines Holdings, Inc. | 0.01 | -0.94 | 0.75 | 14.26 | 0.0792 | 0.0031 | |||
| ACGL / Arch Capital Group Ltd. | 0.01 | 2.67 | 0.74 | -2.87 | 0.0792 | -0.0102 | |||
| OKE / ONEOK, Inc. | 0.01 | -2.36 | 0.74 | -19.76 | 0.0782 | -0.0287 | |||
| BG / Bunge Global SA | 0.01 | 3.20 | 0.73 | 8.47 | 0.0776 | -0.0010 | |||
| KMI / Kinder Morgan, Inc. | 0.02 | 0.72 | 0.0768 | 0.0768 | |||||
| SJM / The J. M. Smucker Company | 0.01 | 1.62 | 0.72 | -15.73 | 0.0764 | -0.0231 | |||
| UBER / Uber Technologies, Inc. | 0.01 | -74.05 | 0.72 | -66.77 | 0.0762 | -0.1756 | |||
| CTVA / Corteva, Inc. | 0.01 | -0.86 | 0.71 | 17.38 | 0.0754 | 0.0049 | |||
| SNPS / Synopsys, Inc. | 0.00 | -2.05 | 0.71 | 17.19 | 0.0754 | 0.0047 | |||
| LKQ / LKQ Corporation | 0.02 | 3.32 | 0.70 | -10.14 | 0.0745 | -0.0165 | |||
| EW / Edwards Lifesciences Corporation | 0.01 | -1.12 | 0.70 | 6.58 | 0.0741 | -0.0021 | |||
| LMT / Lockheed Martin Corporation | 0.00 | -0.92 | 0.70 | 2.66 | 0.0739 | -0.0051 | |||
| EBAY / eBay Inc. | 0.01 | -2.32 | 0.67 | 7.38 | 0.0711 | -0.0016 | |||
| EXR / Extra Space Storage Inc. | 0.00 | 23.45 | 0.66 | 22.51 | 0.0706 | 0.0074 | |||
| DTE / DTE Energy Company | 0.00 | -0.93 | 0.65 | -5.15 | 0.0686 | -0.0107 | |||
| LH / Labcorp Holdings Inc. | 0.00 | 2.89 | 0.63 | 16.11 | 0.0667 | 0.0036 | |||
| TGT / Target Corporation | 0.01 | 6.50 | 0.62 | 0.81 | 0.0658 | -0.0059 | |||
| UPS / United Parcel Service, Inc. | 0.01 | -4.76 | 0.62 | -12.64 | 0.0654 | -0.0167 | |||
| LOW / Lowe's Companies, Inc. | 0.00 | 50.11 | 0.62 | 42.69 | 0.0654 | 0.0151 | |||
| HPE / Hewlett Packard Enterprise Company | 0.03 | -8.35 | 0.61 | 21.39 | 0.0652 | 0.0063 | |||
| IVZ / Invesco Ltd. | 0.04 | -1.74 | 0.61 | 2.20 | 0.0643 | -0.0048 | |||
| ROP / Roper Technologies, Inc. | 0.00 | -2.15 | 0.59 | -5.87 | 0.0631 | -0.0105 | |||
| TEAM / Atlassian Corporation | 0.00 | 5.12 | 0.59 | 0.68 | 0.0625 | -0.0057 | |||
| PEG / Public Service Enterprise Group Incorporated | 0.01 | -2.39 | 0.58 | -0.17 | 0.0622 | -0.0062 | |||
| J / Jacobs Solutions Inc. | 0.00 | -1.54 | 0.58 | 7.02 | 0.0616 | -0.0015 | |||
| GPN / Global Payments Inc. | 0.01 | 3.81 | 0.58 | -15.10 | 0.0616 | -0.0181 | |||
| ELV / Elevance Health, Inc. | 0.00 | -0.94 | 0.57 | -11.42 | 0.0611 | -0.0146 | |||
| COO / The Cooper Companies, Inc. | 0.01 | 4.83 | 0.57 | -11.56 | 0.0611 | -0.0147 | |||
| AA / Alcoa Corporation | 0.02 | 1.83 | 0.56 | -1.57 | 0.0600 | -0.0068 | |||
| AEE / Ameren Corporation | 0.01 | 0.54 | 0.0578 | 0.0578 | |||||
| ETR / Entergy Corporation | 0.01 | -0.94 | 0.54 | -3.77 | 0.0570 | -0.0080 | |||
| TSN / Tyson Foods, Inc. | 0.01 | -2.55 | 0.53 | -14.47 | 0.0566 | -0.0161 | |||
| IR / Ingersoll Rand Inc. | 0.01 | -0.93 | 0.53 | 2.92 | 0.0562 | -0.0037 | |||
| MOS / The Mosaic Company | 0.01 | -3.69 | 0.51 | 29.95 | 0.0545 | 0.0085 | |||
| NTAP / NetApp, Inc. | 0.00 | -0.97 | 0.51 | 20.19 | 0.0545 | 0.0047 | |||
| LBTYK / Liberty Global Ltd. | 0.05 | 3.49 | 0.50 | -10.99 | 0.0534 | -0.0124 | |||
| ACI / Albertsons Companies, Inc. | 0.02 | 3.29 | 0.49 | 1.02 | 0.0524 | -0.0045 | |||
| EXPE / Expedia Group, Inc. | 0.00 | -0.95 | 0.49 | -0.61 | 0.0523 | -0.0055 | |||
| NUE / Nucor Corporation | 0.00 | -0.88 | 0.48 | 6.65 | 0.0512 | -0.0015 | |||
| HST / Host Hotels & Resorts, Inc. | 0.03 | -5.40 | 0.48 | 2.13 | 0.0510 | -0.0037 | |||
| GWW / W.W. Grainger, Inc. | 0.00 | -2.36 | 0.47 | 2.82 | 0.0504 | -0.0034 | |||
| TDC / Teradata Corporation | 0.02 | 3.29 | 0.47 | 2.41 | 0.0498 | -0.0035 | |||
| FDX / FedEx Corporation | 0.00 | 0.47 | 0.0496 | 0.0496 | |||||
| URI / United Rentals, Inc. | 0.00 | 5.89 | 0.45 | 27.43 | 0.0475 | 0.0065 | |||
| DAL / Delta Air Lines, Inc. | 0.01 | -0.92 | 0.45 | 11.78 | 0.0474 | 0.0009 | |||
| PFG / Principal Financial Group, Inc. | 0.01 | -0.92 | 0.40 | -6.74 | 0.0427 | -0.0075 | |||
| MDLZ / Mondelez International, Inc. | 0.01 | 97.54 | 0.40 | 96.08 | 0.0426 | 0.0188 | |||
| OMC / Omnicom Group Inc. | 0.01 | -0.92 | 0.37 | -14.12 | 0.0395 | -0.0109 | |||
| MNST / Monster Beverage Corporation | 0.01 | 9.50 | 0.36 | 17.05 | 0.0380 | 0.0024 | |||
| MOH / Molina Healthcare, Inc. | 0.00 | 6.30 | 0.35 | -3.84 | 0.0374 | -0.0053 | |||
| ROST / Ross Stores, Inc. | 0.00 | 0.00 | 0.32 | -0.31 | 0.0345 | -0.0034 | |||
| CMI / Cummins Inc. | 0.00 | -5.28 | 0.31 | -0.97 | 0.0324 | -0.0035 | |||
| GIS / General Mills, Inc. | 0.01 | -3.14 | 0.30 | -16.10 | 0.0316 | -0.0097 | |||
| HCA / HCA Healthcare, Inc. | 0.00 | -7.07 | 0.28 | 2.99 | 0.0294 | -0.0019 | |||
| MU / Micron Technology, Inc. | 0.00 | 0.28 | 0.0294 | 0.0294 | |||||
| TMO / Thermo Fisher Scientific Inc. | 0.00 | -4.92 | 0.27 | -22.38 | 0.0291 | -0.0121 | |||
| PM / Philip Morris International Inc. | 0.00 | 0.27 | 0.0287 | 0.0287 | |||||
| LHX / L3Harris Technologies, Inc. | 0.00 | 3.19 | 0.25 | 23.65 | 0.0267 | 0.0030 | |||
| TMUS / T-Mobile US, Inc. | 0.00 | 0.00 | 0.24 | -10.53 | 0.0254 | -0.0058 | |||
| NSC / Norfolk Southern Corporation | 0.00 | -5.23 | 0.22 | 2.83 | 0.0232 | -0.0017 | |||
| BBY / Best Buy Co., Inc. | 0.00 | 0.00 | 0.21 | -8.70 | 0.0224 | -0.0045 | |||
| MO / Altria Group, Inc. | 0.00 | -0.88 | 0.21 | -3.23 | 0.0223 | -0.0030 | |||
| KHC / The Kraft Heinz Company | 0.01 | 3.30 | 0.20 | -12.61 | 0.0215 | -0.0054 | |||
| US8085098304 / Schwab International Index Fund | 0.00 | -100.00 | 0.00 | 0.0000 | |||||
| LYB / LyondellBasell Industries N.V. | 0.00 | -100.00 | 0.00 | 0.0000 | |||||
| US00761L1026 / Aegis Value Fund, Inc. | 0.00 | -100.00 | 0.00 | 0.0000 | |||||
| JENSX / Jensen Quality Growth Fund Inc (The) - Jensen Quality Growth Fund Class J | 0.00 | -100.00 | 0.00 | 0.0000 | |||||
| CPRT / Copart, Inc. | 0.00 | -100.00 | 0.00 | 0.0000 | |||||
| VANGUARD SMALL-CAP GROWTH INDE / (921937710) | 0.00 | -100.00 | 0.00 | 0.0000 | |||||
| CCASX / Conestoga Funds - Conestoga Small Cap Fund Investor Class | 0.00 | -100.00 | 0.00 | 0.0000 | |||||
| DODIX / Dodge & Cox Funds - Dodge & Cox Income Fund | 0.00 | -100.00 | 0.00 | 0.0000 | |||||
| VOO / Vanguard Index Funds - Vanguard S&P 500 ETF | 0.00 | -100.00 | 0.00 | 0.0000 | |||||
| DODGX / Dodge & Cox Funds - Dodge & Cox Stock Fund | 0.00 | -100.00 | 0.00 | 0.0000 | |||||
| PCOR / Procore Technologies, Inc. | 0.00 | -100.00 | 0.00 | 0.0000 | |||||
| DLTNX / Doubleline Funds Trust - DoubleLine Total Return Bond Fund Class N | 0.00 | -100.00 | 0.00 | 0.0000 | |||||
| SWSSX / Schwab Capital Trust - Schwab Small-Cap Index Fund | 0.00 | -100.00 | 0.00 | 0.0000 | |||||
| SWAXX / Schwab Value Advantage Money Fund | 0.00 | -100.00 | 0.00 | 0.0000 | |||||
| VGT / Vanguard World Fund - Vanguard Information Technology ETF | 0.00 | -100.00 | 0.00 | 0.0000 | |||||
| SPYV / SPDR Series Trust - SPDR Portfolio S&P 500 Value ETF | 0.00 | -100.00 | 0.00 | 0.0000 | |||||
| AVT / Avnet, Inc. | 0.00 | -100.00 | 0.00 | 0.0000 | |||||
| CPT / Camden Property Trust | 0.00 | -100.00 | 0.00 | 0.0000 | |||||
| XLF / The Select Sector SPDR Trust - The Financial Select Sector SPDR Fund | 0.00 | -100.00 | 0.00 | 0.0000 | |||||
| FPACX / Fpa Funds Trust - FPA Crescent Portfolio Institutional Class | 0.00 | -100.00 | 0.00 | 0.0000 | |||||
| PCAR / PACCAR Inc | 0.00 | -100.00 | 0.00 | 0.0000 | |||||
| MWTRX / Metropolitan West Funds - Metropolitan West Total Return Bond Fund | 0.00 | -100.00 | 0.00 | 0.0000 | |||||
| WRB / W. R. Berkley Corporation | 0.00 | -100.00 | 0.00 | 0.0000 | |||||
| QQQ / Invesco QQQ Trust, Series 1 | 0.00 | -100.00 | 0.00 | 0.0000 | |||||
| ED / Consolidated Edison, Inc. | 0.00 | -100.00 | 0.00 | 0.0000 | |||||
| PRU / Prudential Financial, Inc. | 0.00 | -100.00 | 0.00 | 0.0000 | |||||
| MPC / Marathon Petroleum Corporation | 0.00 | -100.00 | 0.00 | 0.0000 | |||||
| ASH / Ashland Inc. | 0.00 | -100.00 | 0.00 | 0.0000 | |||||
| FPURX / Fidelity Puritan Trust - Fidelity Puritan Fund | 0.00 | -100.00 | 0.00 | 0.0000 | |||||
| FAM DIVIDEND FOCUS FUND / (314465204) | 0.00 | -100.00 | 0.00 | 0.0000 | |||||
| SNXFX / Schwab Investments - Schwab 1000 Index Fund | 0.00 | -100.00 | 0.00 | 0.0000 | |||||
| WAAEX / Wasatch Funds Trust - Wasatch Small Cap Growth Fund | 0.00 | -100.00 | 0.00 | 0.0000 | |||||
| GMED / Globus Medical, Inc. | 0.00 | -100.00 | 0.00 | 0.0000 | |||||
| AGG / iShares Trust - iShares Core U.S. Aggregate Bond ETF | 0.00 | -100.00 | 0.00 | 0.0000 | |||||
| FXAIX / Fidelity Concord Street Trust - Fidelity 500 Index Fund | 0.00 | -100.00 | 0.00 | 0.0000 | |||||
| ARGFX / Ariel Investment Trust - Ariel Fund Investor Class | 0.00 | -100.00 | 0.00 | 0.0000 | |||||
| NWSA / News Corporation | 0.00 | -100.00 | 0.00 | 0.0000 | |||||
| MAR / Marriott International, Inc. | 0.00 | -100.00 | 0.00 | 0.0000 | |||||
| US80850L7266 / Schwab U.S. Mid-Cap Index Fund | 0.00 | -100.00 | 0.00 | 0.0000 | |||||
| BRO / Brown & Brown, Inc. | 0.00 | -100.00 | 0.00 | 0.0000 | |||||
| LSBDX / Loomis Sayles Funds I - Loomis Sayles Funds Bond Fund Institutional Class | 0.00 | -100.00 | 0.00 | 0.0000 | |||||
| CRWD / CrowdStrike Holdings, Inc. | 0.00 | -100.00 | 0.00 | 0.0000 | |||||
| VB / Vanguard Index Funds - Vanguard Small-Cap ETF | 0.00 | -100.00 | 0.00 | 0.0000 | |||||
| SWGXX / Charles Schwab Family Of Funds - Schwab Government Securities Fund | 0.00 | -100.00 | 0.00 | 0.0000 | |||||
| VIMAX / Vanguard Index Funds - Vanguard Mid-Cap Index Fund Admiral Class | 0.00 | -100.00 | 0.00 | 0.0000 | |||||
| SCHWAB TREASURY OBLIGATIONS MO / (808515621) | 0.00 | -100.00 | 0.00 | 0.0000 | |||||
| CNP / CenterPoint Energy, Inc. | 0.00 | -100.00 | 0.00 | 0.0000 | |||||
| HPQ / HP Inc. | 0.00 | -100.00 | 0.00 | 0.0000 |