Mga Batayang Estadistika
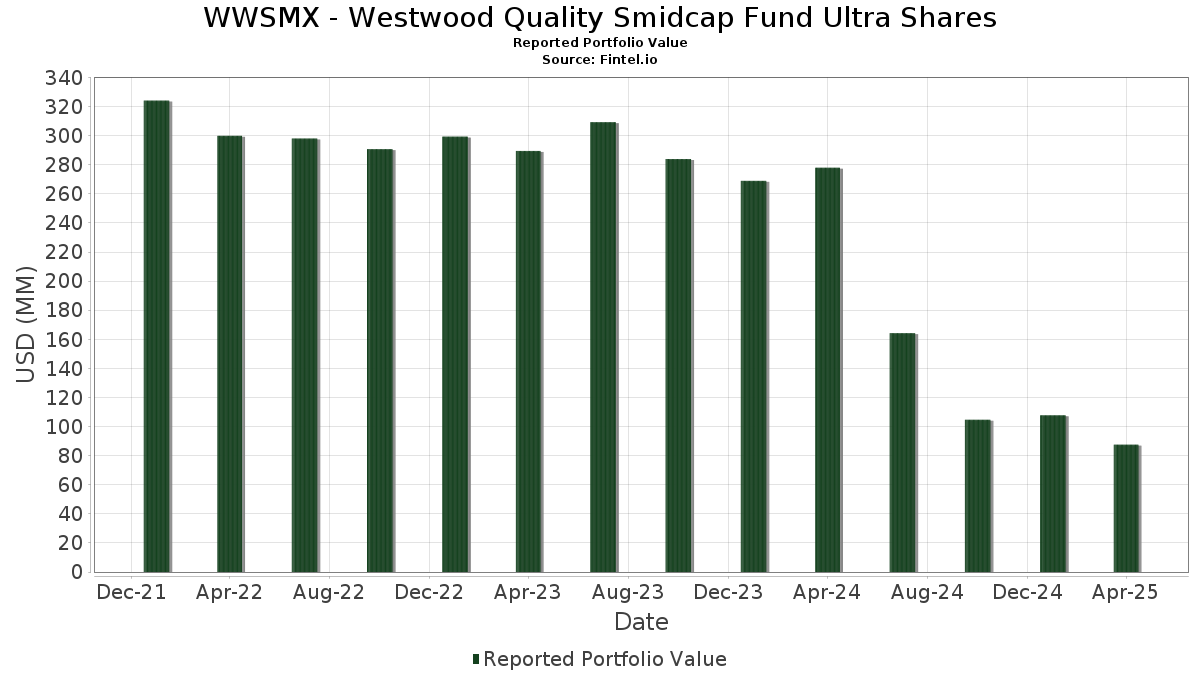
| Nilai Portofolio | $ 87,559,163 |
| Posisi Saat Ini | 64 |
Kepemilikan Terbaru, Kinerja, AUM (dari 13F, 13D)
WWSMX - Westwood Quality Smidcap Fund Ultra Shares telah mengungkapkan total kepemilikan 64 dalam pengajuan SEC terbaru mereka. Nilai portofolio terbaru dihitung sebesar $ 87,559,163 USD. Aset yang Dikelola (AUM) sebenarnya adalah nilai ini ditambah kas (yang tidak diungkapkan). Aset-aset utama WWSMX - Westwood Quality Smidcap Fund Ultra Shares adalah IDACORP, Inc. (US:IDA) , BWX Technologies, Inc. (US:BWXT) , TXNM Energy, Inc. (US:TXNM) , Advanced Drainage Systems, Inc. (US:WMS) , and MSA Safety Incorporated (US:MSA) . Posisi baru WWSMX - Westwood Quality Smidcap Fund Ultra Shares meliputi: Advanced Drainage Systems, Inc. (US:WMS) , MSA Safety Incorporated (US:MSA) , Marex Group plc (US:MRX) , Gulfport Energy Corporation (US:GPOR) , and Sensient Technologies Corporation (US:SXT) .
Peningkatan Tertinggi Kuartal Ini
Kami menggunakan perubahan dalam alokasi portofolio karena ini adalah metrik yang paling bermakna. Perubahan dapat disebabkan oleh perdagangan atau perubahan harga saham.
| Keamanan | Saham (MM) |
Nilai (Juta Dolar AS) |
Portfolio % | ΔPorsyento ng Portfolio |
|---|---|---|---|---|
| 0.02 | 1.83 | 2.0940 | 2.0940 | |
| 0.01 | 1.81 | 2.0678 | 2.0678 | |
| 0.03 | 1.49 | 1.7048 | 1.7048 | |
| 0.01 | 1.32 | 1.5080 | 1.5080 | |
| 0.01 | 1.09 | 1.2400 | 1.2400 | |
| 0.02 | 1.06 | 1.2149 | 1.2149 | |
| 0.01 | 0.89 | 1.0110 | 1.0110 | |
| 0.04 | 0.88 | 1.0097 | 1.0097 | |
| 0.03 | 1.40 | 1.6000 | 0.7069 | |
| 0.12 | 1.38 | 1.5734 | 0.5486 |
Penurunan Tertinggi Kuartal Ini
Kami menggunakan perubahan dalam alokasi portofolio karena ini adalah metrik yang paling bermakna. Perubahan dapat disebabkan oleh perdagangan atau perubahan harga saham.
| Keamanan | Saham (MM) |
Nilai (Juta Dolar AS) |
Portfolio % | ΔPorsyento ng Portfolio |
|---|---|---|---|---|
| 0.04 | 1.29 | 1.4778 | -1.0595 | |
| 0.02 | 0.85 | 0.9708 | -1.0384 | |
| 0.05 | 1.31 | 1.4976 | -0.6970 | |
| 0.01 | 0.88 | 1.0044 | -0.5066 | |
| 0.08 | 1.67 | 1.9065 | -0.4173 | |
| 0.04 | 1.56 | 1.7849 | -0.3788 | |
| 0.00 | 1.35 | 1.5474 | -0.3625 | |
| 0.01 | 1.49 | 1.7023 | -0.2901 | |
| 0.11 | 1.49 | 1.6972 | -0.2859 | |
| 0.03 | 1.73 | 1.9770 | -0.2744 |
Pengajuan 13F dan Dana
Formulir ini diajukan pada 2025-06-25 untuk periode pelaporan 2025-04-30. Klik ikon tautan untuk melihat riwayat transaksi selengkapnya.
Tingkatkan ke versi premium untuk membuka data premium dan ekspor ke Excel. ![]() .
.
| Keamanan | Ketik | Harga Saham Rata-rata | Saham (MM) |
ΔSaham (%) |
ΔSaham (%) |
Nilai ($MM) |
Portpolyo (%) |
ΔPortofolio (%) |
|
|---|---|---|---|---|---|---|---|---|---|
| IDA / IDACORP, Inc. | 0.02 | -26.34 | 2.13 | -20.88 | 2.4291 | -0.0727 | |||
| BWXT / BWX Technologies, Inc. | 0.02 | 0.81 | 1.89 | -2.62 | 2.1633 | 0.3535 | |||
| TXNM / TXNM Energy, Inc. | 0.03 | -24.69 | 1.84 | -17.15 | 2.0983 | 0.0348 | |||
| WMS / Advanced Drainage Systems, Inc. | 0.02 | 1.83 | 2.0940 | 2.0940 | |||||
| MSA / MSA Safety Incorporated | 0.01 | 1.81 | 2.0678 | 2.0678 | |||||
| HUBB / Hubbell Incorporated | 0.00 | -0.38 | 1.79 | -14.50 | 2.0491 | 0.0967 | |||
| RMBS / Rambus Inc. | 0.04 | -7.64 | 1.79 | -26.90 | 2.0436 | -0.2338 | |||
| WTFC / Wintrust Financial Corporation | 0.02 | 0.00 | 1.78 | -14.98 | 2.0289 | 0.0834 | |||
| ITGR / Integer Holdings Corporation | 0.01 | -18.75 | 1.77 | -27.84 | 2.0164 | -0.2609 | |||
| DPZ / Domino's Pizza, Inc. | 0.00 | -29.42 | 1.76 | -22.92 | 2.0048 | -0.1153 | |||
| COO / The Cooper Companies, Inc. | 0.02 | 8.12 | 1.75 | -8.54 | 1.9940 | 0.2173 | |||
| AIR / AAR Corp. | 0.03 | -9.30 | 1.73 | -28.45 | 1.9770 | -0.2744 | |||
| RNR / RenaissanceRe Holdings Ltd. | 0.01 | 0.00 | 1.72 | 4.00 | 1.9619 | 0.4249 | |||
| VRRM / Verra Mobility Corporation | 0.08 | -19.06 | 1.67 | -33.17 | 1.9065 | -0.4173 | |||
| LAD / Lithia Motors, Inc. | 0.01 | 0.45 | 1.65 | -21.82 | 1.8835 | -0.0796 | |||
| CFR / Cullen/Frost Bankers, Inc. | 0.01 | -8.99 | 1.64 | -23.94 | 1.8728 | -0.1342 | |||
| GBCI / Glacier Bancorp, Inc. | 0.04 | -8.24 | 1.63 | -24.70 | 1.8637 | -0.1533 | |||
| PCH / PotlatchDeltic Corporation | 0.04 | -21.67 | 1.56 | -32.79 | 1.7849 | -0.3788 | |||
| REXR / Rexford Industrial Realty, Inc. | 0.05 | 0.00 | 1.50 | -18.61 | 1.7098 | -0.0018 | |||
| CCK / Crown Holdings, Inc. | 0.02 | -17.53 | 1.50 | -9.56 | 1.7080 | 0.1687 | |||
| MRX / Marex Group plc | 0.03 | 1.49 | 1.7048 | 1.7048 | |||||
| LFUS / Littelfuse, Inc. | 0.01 | -8.97 | 1.49 | -30.37 | 1.7023 | -0.2901 | |||
| AVTR / Avantor, Inc. | 0.11 | 19.62 | 1.49 | -30.28 | 1.6972 | -0.2859 | |||
| CACI / CACI International Inc | 0.00 | -19.05 | 1.46 | -4.08 | 1.6643 | 0.2508 | |||
| AHR / American Healthcare REIT, Inc. | 0.04 | -19.73 | 1.41 | -8.43 | 1.6139 | 0.1780 | |||
| CCJ / Cameco Corporation | 0.03 | 59.87 | 1.40 | 45.99 | 1.6000 | 0.7069 | |||
| XPO / XPO, Inc. | 0.01 | 21.00 | 1.39 | -3.93 | 1.5910 | 0.2413 | |||
| PR / Permian Resources Corporation | 0.12 | 55.34 | 1.38 | 25.18 | 1.5734 | 0.5486 | |||
| BLD / TopBuild Corp. | 0.00 | -8.76 | 1.37 | -21.26 | 1.5623 | -0.0545 | |||
| LPLA / LPL Financial Holdings Inc. | 0.00 | -24.25 | 1.35 | -33.98 | 1.5474 | -0.3625 | |||
| OFC / Corporate Office Properties Trust | 0.05 | 0.00 | 1.35 | -11.34 | 1.5373 | 0.1247 | |||
| GPOR / Gulfport Energy Corporation | 0.01 | 1.32 | 1.5080 | 1.5080 | |||||
| AXTA / Axalta Coating Systems Ltd. | 0.04 | -13.95 | 1.31 | -22.22 | 1.5007 | -0.0710 | |||
| CAKE / The Cheesecake Factory Incorporated | 0.03 | -19.12 | 1.31 | -27.45 | 1.4977 | -0.1846 | |||
| IGIC / International General Insurance Holdings Ltd. | 0.05 | -42.05 | 1.31 | -44.42 | 1.4976 | -0.6970 | |||
| BJ / BJ's Wholesale Club Holdings, Inc. | 0.01 | -33.47 | 1.31 | -21.04 | 1.4921 | -0.0478 | |||
| KTOS / Kratos Defense & Security Solutions, Inc. | 0.04 | -53.12 | 1.29 | -52.55 | 1.4778 | -1.0595 | |||
| EXP / Eagle Materials Inc. | 0.01 | -18.82 | 1.29 | -32.48 | 1.4725 | 0.3113 | |||
| SSB / SouthState Corporation | 0.01 | -7.42 | 1.27 | -23.92 | 1.4504 | -0.1030 | |||
| IPAR / Interparfums, Inc. | 0.01 | 0.00 | 1.27 | -22.54 | 1.4489 | -0.0759 | |||
| ASO / Academy Sports and Outdoors, Inc. | 0.03 | 15.63 | 1.26 | -16.69 | 1.4432 | 0.0312 | |||
| TXRH / Texas Roadhouse, Inc. | 0.01 | -19.16 | 1.26 | -25.94 | 1.4425 | -0.1442 | |||
| MKTX / MarketAxess Holdings Inc. | 0.01 | -22.55 | 1.25 | -22.22 | 1.4320 | -0.0682 | |||
| FRT / Federal Realty Investment Trust | 0.01 | 0.00 | 1.24 | -13.46 | 1.4180 | 0.0829 | |||
| CHRD / Chord Energy Corporation | 0.01 | 0.00 | 1.24 | -19.79 | 1.4129 | -0.0221 | |||
| TKR / The Timken Company | 0.02 | -11.25 | 1.22 | -29.00 | 1.3994 | -0.2060 | |||
| PEGA / Pegasystems Inc. | 0.01 | 0.00 | 1.21 | -14.96 | 1.3766 | 0.0573 | |||
| PIPR / Piper Sandler Companies | 0.00 | 0.00 | 1.17 | -23.98 | 1.3403 | -0.0963 | |||
| SM / SM Energy Company | 0.05 | 40.55 | 1.15 | -15.67 | 1.3170 | 0.0451 | |||
| TFX / Teleflex Incorporated | 0.01 | 0.00 | 1.14 | -23.98 | 1.3010 | -0.0933 | |||
| RGLD / Royal Gold, Inc. | 0.01 | -21.87 | 1.14 | 2.06 | 1.3005 | 0.2625 | |||
| SXT / Sensient Technologies Corporation | 0.01 | 1.09 | 1.2400 | 1.2400 | |||||
| MCY / Mercury General Corporation | 0.02 | 1.06 | 1.2149 | 1.2149 | |||||
| MBIN / Merchants Bancorp | 0.03 | 0.00 | 1.02 | -28.31 | 1.1696 | -0.1590 | |||
| US31846V2117 / FIRST AM GOV OBLIG-U | 1.01 | -1.75 | 1.1544 | 0.1967 | |||||
| DOX / Amdocs Limited | 0.01 | -11.50 | 1.00 | -11.07 | 1.1473 | 0.0955 | |||
| MOGA / Moog, Inc. - Class A | 0.01 | 0.00 | 0.96 | -7.87 | 1.0967 | 0.1260 | |||
| ELS / Equity LifeStyle Properties, Inc. | 0.01 | -12.73 | 0.90 | -13.68 | 1.0312 | 0.0583 | |||
| USFD / US Foods Holding Corp. | 0.01 | 0.89 | 1.0110 | 1.0110 | |||||
| BRX / Brixmor Property Group Inc. | 0.04 | 0.88 | 1.0097 | 1.0097 | |||||
| BLBD / Blue Bird Corporation | 0.03 | 0.00 | 0.88 | -2.11 | 1.0094 | 0.1691 | |||
| BCC / Boise Cascade Company | 0.01 | -26.74 | 0.88 | -45.84 | 1.0044 | -0.5066 | |||
| COLD / Americold Realty Trust, Inc. | 0.04 | -13.09 | 0.86 | -23.10 | 0.9824 | -0.0584 | |||
| HXL / Hexcel Corporation | 0.02 | -47.03 | 0.85 | -60.66 | 0.9708 | -1.0384 |