Mga Batayang Estadistika
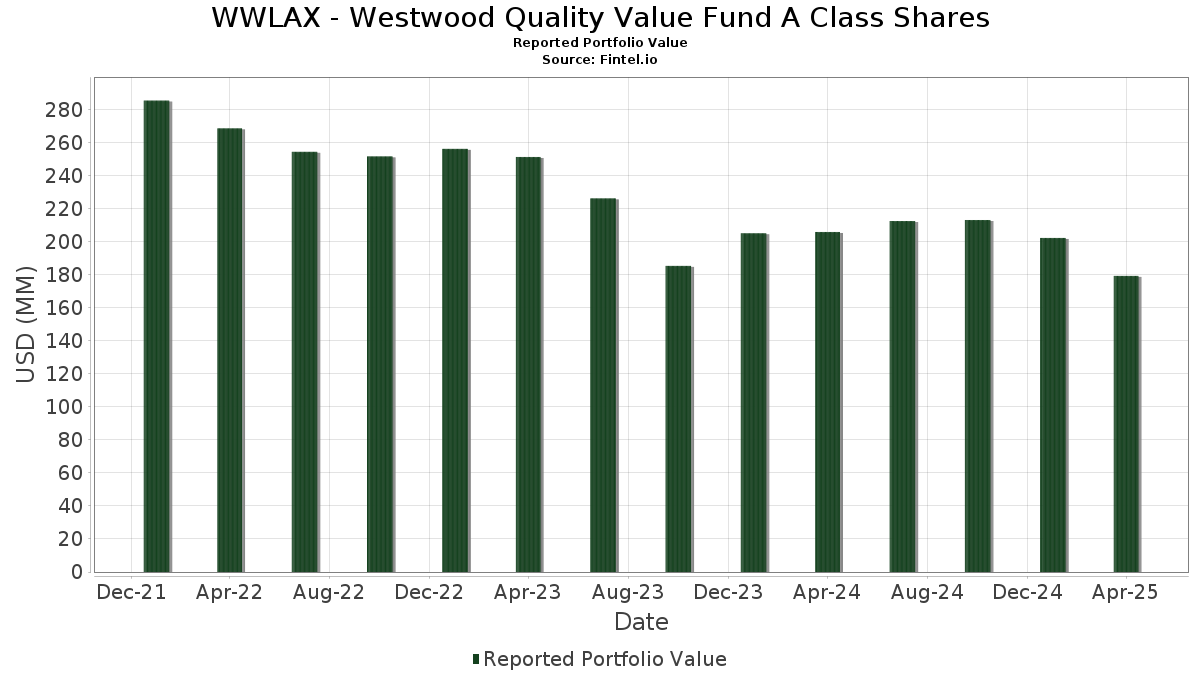
| Nilai Portofolio | $ 179,345,512 |
| Posisi Saat Ini | 47 |
Kepemilikan Terbaru, Kinerja, AUM (dari 13F, 13D)
WWLAX - Westwood Quality Value Fund A Class Shares telah mengungkapkan total kepemilikan 47 dalam pengajuan SEC terbaru mereka. Nilai portofolio terbaru dihitung sebesar $ 179,345,512 USD. Aset yang Dikelola (AUM) sebenarnya adalah nilai ini ditambah kas (yang tidak diungkapkan). Aset-aset utama WWLAX - Westwood Quality Value Fund A Class Shares adalah Microsoft Corporation (US:MSFT) , JPMorgan Chase & Co. (US:JPM) , FIRST AM GOV OBLIG-U (US:US31846V2117) , Abbott Laboratories (US:ABT) , and Union Pacific Corporation (US:UNP) . Posisi baru WWLAX - Westwood Quality Value Fund A Class Shares meliputi: FIRST AM GOV OBLIG-U (US:US31846V2117) , Vertex Pharmaceuticals Incorporated (US:VRTX) , Texas Instruments Incorporated (US:TXN) , Agree Realty Corporation (US:ADC) , and DICK'S Sporting Goods, Inc. (US:DKS) .
Peningkatan Tertinggi Kuartal Ini
Kami menggunakan perubahan dalam alokasi portofolio karena ini adalah metrik yang paling bermakna. Perubahan dapat disebabkan oleh perdagangan atau perubahan harga saham.
| Keamanan | Saham (MM) |
Nilai (Juta Dolar AS) |
Portfolio % | ΔPorsyento ng Portfolio |
|---|---|---|---|---|
| 0.03 | 4.51 | 2.5375 | 2.5375 | |
| 6.09 | 3.4293 | 2.4564 | ||
| 0.01 | 3.65 | 2.0541 | 2.0541 | |
| 0.02 | 3.63 | 2.0443 | 2.0443 | |
| 0.05 | 3.56 | 2.0021 | 2.0021 | |
| 0.01 | 1.82 | 1.0237 | 1.0237 | |
| 0.01 | 1.77 | 0.9978 | 0.9978 | |
| 0.05 | 4.55 | 2.5638 | 0.5582 | |
| 0.05 | 4.52 | 2.5431 | 0.5309 | |
| 0.01 | 4.33 | 2.4357 | 0.5207 |
Penurunan Tertinggi Kuartal Ini
Kami menggunakan perubahan dalam alokasi portofolio karena ini adalah metrik yang paling bermakna. Perubahan dapat disebabkan oleh perdagangan atau perubahan harga saham.
| Keamanan | Saham (MM) |
Nilai (Juta Dolar AS) |
Portfolio % | ΔPorsyento ng Portfolio |
|---|---|---|---|---|
| 0.05 | 3.49 | 1.9639 | -1.0935 | |
| 0.01 | 1.79 | 1.0086 | -1.0208 | |
| 0.01 | 4.89 | 2.7508 | -0.8358 | |
| 0.05 | 2.88 | 1.6237 | -0.4170 | |
| 0.03 | 3.02 | 1.6999 | -0.2680 | |
| 0.01 | 3.25 | 1.8291 | -0.2129 | |
| 0.01 | 3.25 | 1.8290 | -0.1680 | |
| 0.04 | 3.25 | 1.8313 | -0.1249 | |
| 0.01 | 3.57 | 2.0107 | -0.1140 | |
| 0.08 | 3.31 | 1.8622 | -0.1111 |
Pengajuan 13F dan Dana
Formulir ini diajukan pada 2025-06-25 untuk periode pelaporan 2025-04-30. Klik ikon tautan untuk melihat riwayat transaksi selengkapnya.
Tingkatkan ke versi premium untuk membuka data premium dan ekspor ke Excel. ![]() .
.
| Keamanan | Ketik | Harga Saham Rata-rata | Saham (MM) |
ΔSaham (%) |
ΔSaham (%) |
Nilai ($MM) |
Portpolyo (%) |
ΔPortofolio (%) |
|
|---|---|---|---|---|---|---|---|---|---|
| MSFT / Microsoft Corporation | 0.02 | 5.62 | 6.67 | 0.59 | 3.7524 | 0.4773 | |||
| JPM / JPMorgan Chase & Co. | 0.03 | -2.77 | 6.28 | -11.02 | 3.5370 | 0.0471 | |||
| US31846V2117 / FIRST AM GOV OBLIG-U | 6.09 | 209.50 | 3.4293 | 2.4564 | |||||
| ABT / Abbott Laboratories | 0.04 | -14.50 | 5.30 | -12.61 | 2.9853 | -0.0140 | |||
| UNP / Union Pacific Corporation | 0.02 | 0.00 | 5.25 | -12.97 | 2.9546 | -0.0258 | |||
| UNH / UnitedHealth Group Incorporated | 0.01 | -11.22 | 4.89 | -32.67 | 2.7508 | -0.8358 | |||
| V / Visa Inc. | 0.01 | -10.81 | 4.65 | -9.84 | 2.6188 | 0.0686 | |||
| TMUS / T-Mobile US, Inc. | 0.02 | -12.19 | 4.58 | -6.93 | 2.5785 | 0.1465 | |||
| DIS / The Walt Disney Company | 0.05 | 39.51 | 4.55 | 12.22 | 2.5638 | 0.5582 | |||
| PGR / The Progressive Corporation | 0.02 | -6.32 | 4.54 | 7.08 | 2.5539 | 0.4604 | |||
| WMT / Walmart Inc. | 0.05 | 11.99 | 4.52 | 10.96 | 2.5431 | 0.5309 | |||
| ICE / Intercontinental Exchange, Inc. | 0.03 | 4.51 | 2.5375 | 2.5375 | |||||
| GOOGL / Alphabet Inc. | 0.03 | 10.54 | 4.47 | -13.97 | 2.5166 | -0.0513 | |||
| CACI / CACI International Inc | 0.01 | -5.80 | 4.33 | 11.67 | 2.4357 | 0.5207 | |||
| BWXT / BWX Technologies, Inc. | 0.04 | 0.00 | 3.99 | -3.37 | 2.2439 | 0.2051 | |||
| XOM / Exxon Mobil Corporation | 0.04 | 0.00 | 3.93 | -1.13 | 2.2149 | 0.2483 | |||
| DRI / Darden Restaurants, Inc. | 0.02 | -12.55 | 3.83 | -10.13 | 2.1579 | 0.0498 | |||
| WM / Waste Management, Inc. | 0.02 | -16.49 | 3.78 | -11.54 | 2.1283 | 0.0165 | |||
| AJG / Arthur J. Gallagher & Co. | 0.01 | -16.40 | 3.70 | -11.19 | 2.0821 | 0.0242 | |||
| VRTX / Vertex Pharmaceuticals Incorporated | 0.01 | 3.65 | 2.0541 | 2.0541 | |||||
| GD / General Dynamics Corporation | 0.01 | -11.53 | 3.65 | -6.32 | 2.0520 | 0.1290 | |||
| TXN / Texas Instruments Incorporated | 0.02 | 3.63 | 2.0443 | 2.0443 | |||||
| PLD / Prologis, Inc. | 0.04 | 4.89 | 3.63 | -10.11 | 2.0430 | 0.0478 | |||
| HUBB / Hubbell Incorporated | 0.01 | 11.90 | 3.61 | -3.94 | 2.0338 | 0.1753 | |||
| ORLY / O'Reilly Automotive, Inc. | 0.00 | -19.43 | 3.60 | -11.91 | 2.0282 | 0.0068 | |||
| HSY / The Hershey Company | 0.02 | -20.26 | 3.60 | -10.67 | 2.0267 | 0.0348 | |||
| ACN / Accenture plc | 0.01 | 6.91 | 3.57 | -16.93 | 2.0107 | -0.1140 | |||
| ADC / Agree Realty Corporation | 0.05 | 3.56 | 2.0021 | 2.0021 | |||||
| BRK.B / Berkshire Hathaway Inc. | 0.01 | -24.31 | 3.55 | -13.87 | 1.9959 | -0.0386 | |||
| WEC / WEC Energy Group, Inc. | 0.03 | -21.78 | 3.54 | -13.70 | 1.9930 | -0.0344 | |||
| WFC / Wells Fargo & Company | 0.05 | -37.42 | 3.49 | -43.61 | 1.9639 | -1.0935 | |||
| JNJ / Johnson & Johnson | 0.02 | -16.65 | 3.48 | -14.38 | 1.9606 | -0.0495 | |||
| SO / The Southern Company | 0.04 | -22.36 | 3.47 | -15.03 | 1.9550 | -0.0646 | |||
| BLD / TopBuild Corp. | 0.01 | 1.60 | 3.45 | -12.29 | 1.9399 | -0.0022 | |||
| NEE / NextEra Energy, Inc. | 0.05 | -8.20 | 3.44 | -14.19 | 1.9366 | -0.0450 | |||
| CVX / Chevron Corporation | 0.02 | -4.82 | 3.36 | -13.20 | 1.8911 | -0.0216 | |||
| BAC / Bank of America Corporation | 0.08 | -3.81 | 3.31 | -17.13 | 1.8622 | -0.1111 | |||
| SSB / SouthState Corporation | 0.04 | 0.00 | 3.25 | -17.81 | 1.8313 | -0.1249 | |||
| CRM / Salesforce, Inc. | 0.01 | 0.00 | 3.25 | -21.35 | 1.8291 | -0.2129 | |||
| GS / The Goldman Sachs Group, Inc. | 0.01 | -5.96 | 3.25 | -19.58 | 1.8290 | -0.1680 | |||
| CHD / Church & Dwight Co., Inc. | 0.03 | 11.36 | 3.17 | 4.83 | 1.7826 | 0.2898 | |||
| BCC / Boise Cascade Company | 0.03 | 2.57 | 3.02 | -24.16 | 1.6999 | -0.2680 | |||
| MRVL / Marvell Technology, Inc. | 0.05 | 35.06 | 2.88 | -30.15 | 1.6237 | -0.4170 | |||
| DKS / DICK'S Sporting Goods, Inc. | 0.01 | 1.82 | 1.0237 | 1.0237 | |||||
| PEP / PepsiCo, Inc. | 0.01 | -51.50 | 1.79 | -56.38 | 1.0086 | -1.0208 | |||
| AMT / American Tower Corporation | 0.01 | 1.77 | 0.9978 | 0.9978 | |||||
| EOG / EOG Resources, Inc. | 0.02 | 0.00 | 1.69 | -12.27 | 0.9536 | -0.0009 |