Mga Batayang Estadistika
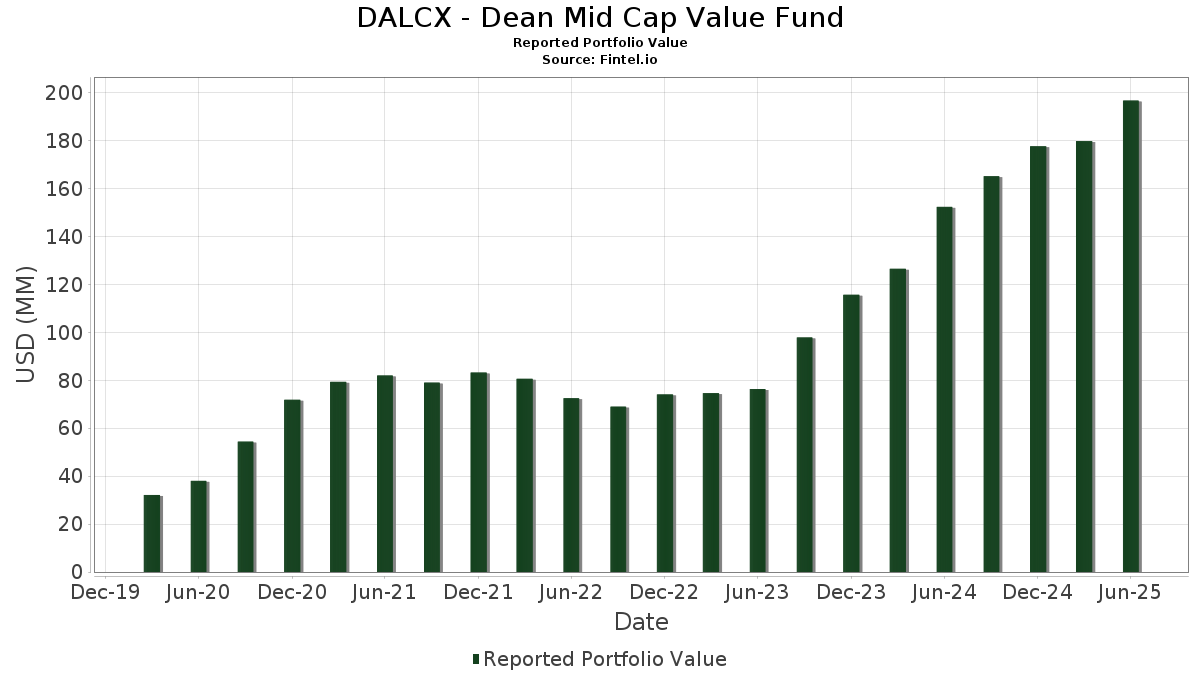
| Nilai Portofolio | $ 196,687,220 |
| Posisi Saat Ini | 60 |
Kepemilikan Terbaru, Kinerja, AUM (dari 13F, 13D)
DALCX - Dean Mid Cap Value Fund telah mengungkapkan total kepemilikan 60 dalam pengajuan SEC terbaru mereka. Nilai portofolio terbaru dihitung sebesar $ 196,687,220 USD. Aset yang Dikelola (AUM) sebenarnya adalah nilai ini ditambah kas (yang tidak diungkapkan). Aset-aset utama DALCX - Dean Mid Cap Value Fund adalah The Bank of New York Mellon Corporation (US:BK) , Dollar General Corporation (US:DG) , L3Harris Technologies, Inc. (US:LHX) , Microchip Technology Incorporated (US:MCHP) , and Ameren Corporation (US:AEE) . Posisi baru DALCX - Dean Mid Cap Value Fund meliputi: WESCO International, Inc. (US:WCC) , .
Peningkatan Tertinggi Kuartal Ini
Kami menggunakan perubahan dalam alokasi portofolio karena ini adalah metrik yang paling bermakna. Perubahan dapat disebabkan oleh perdagangan atau perubahan harga saham.
| Keamanan | Saham (MM) |
Nilai (Juta Dolar AS) |
Portfolio % | ΔPorsyento ng Portfolio |
|---|---|---|---|---|
| 5.33 | 2.7093 | 2.7093 | ||
| 0.04 | 2.72 | 1.3832 | 1.3832 | |
| 0.01 | 2.64 | 1.3390 | 1.3390 | |
| 0.06 | 4.12 | 2.0941 | 0.8127 | |
| 0.02 | 3.30 | 1.6749 | 0.6054 | |
| 0.02 | 3.98 | 2.0198 | 0.5532 | |
| 0.15 | 3.48 | 1.7690 | 0.5342 | |
| 0.04 | 4.32 | 2.1929 | 0.4429 | |
| 0.01 | 3.00 | 1.5265 | 0.3267 | |
| 0.02 | 4.30 | 2.1859 | 0.2924 |
Penurunan Tertinggi Kuartal Ini
Kami menggunakan perubahan dalam alokasi portofolio karena ini adalah metrik yang paling bermakna. Perubahan dapat disebabkan oleh perdagangan atau perubahan harga saham.
| Keamanan | Saham (MM) |
Nilai (Juta Dolar AS) |
Portfolio % | ΔPorsyento ng Portfolio |
|---|---|---|---|---|
| 0.01 | 1.17 | 0.5919 | -0.8522 | |
| 0.03 | 2.85 | 1.4478 | -0.6242 | |
| 0.09 | 3.22 | 1.6364 | -0.5874 | |
| 0.14 | 2.92 | 1.4812 | -0.5222 | |
| 0.03 | 2.71 | 1.3777 | -0.4064 | |
| 0.00 | 3.30 | 1.6765 | -0.3673 | |
| 0.04 | 2.99 | 1.5166 | -0.3476 | |
| 0.01 | 2.85 | 1.4486 | -0.3364 | |
| 0.03 | 2.42 | 1.2296 | -0.3320 | |
| 0.07 | 2.60 | 1.3191 | -0.2506 |
Pengajuan 13F dan Dana
Formulir ini diajukan pada 2025-08-29 untuk periode pelaporan 2025-06-30. Klik ikon tautan untuk melihat riwayat transaksi selengkapnya.
Tingkatkan ke versi premium untuk membuka data premium dan ekspor ke Excel. ![]() .
.
| Keamanan | Ketik | Harga Saham Rata-rata | Saham (MM) |
ΔSaham (%) |
ΔSaham (%) |
Nilai ($MM) |
Portpolyo (%) |
ΔPortofolio (%) |
|
|---|---|---|---|---|---|---|---|---|---|
| Huntington Conservative Deposit Account / STIV (N/A) | 5.33 | 2.7093 | 2.7093 | ||||||
| BK / The Bank of New York Mellon Corporation | 0.06 | 5.07 | 5.27 | 14.15 | 2.6760 | 0.1072 | |||
| DG / Dollar General Corporation | 0.04 | 5.55 | 4.32 | 37.32 | 2.1929 | 0.4429 | |||
| LHX / L3Harris Technologies, Inc. | 0.02 | 5.55 | 4.30 | 26.49 | 2.1859 | 0.2924 | |||
| MCHP / Microchip Technology Incorporated | 0.06 | 23.19 | 4.12 | 79.14 | 2.0941 | 0.8127 | |||
| AEE / Ameren Corporation | 0.04 | 5.55 | 4.06 | 0.97 | 2.0644 | -0.1759 | |||
| WRB / W. R. Berkley Corporation | 0.05 | 5.55 | 4.00 | 8.97 | 2.0298 | -0.0110 | |||
| LFUS / Littelfuse, Inc. | 0.02 | 30.94 | 3.98 | 50.91 | 2.0198 | 0.5532 | |||
| EHC / Encompass Health Corporation | 0.03 | -15.95 | 3.97 | 1.77 | 2.0186 | -0.1549 | |||
| SSNC / SS&C Technologies Holdings, Inc. | 0.05 | 5.20 | 3.91 | 4.26 | 1.9883 | -0.1009 | |||
| PB / Prosperity Bancshares, Inc. | 0.05 | 5.55 | 3.74 | 3.89 | 1.8998 | -0.1041 | |||
| ARW / Arrow Electronics, Inc. | 0.03 | 4.99 | 3.72 | 28.86 | 1.8919 | 0.2830 | |||
| HIG / The Hartford Insurance Group, Inc. | 0.03 | 5.55 | 3.71 | 8.23 | 1.8836 | -0.0233 | |||
| JAZZ / Jazz Pharmaceuticals plc | 0.03 | 24.21 | 3.68 | 6.17 | 1.8701 | -0.0600 | |||
| DGX / Quest Diagnostics Incorporated | 0.02 | 5.55 | 3.67 | 12.05 | 1.8668 | 0.0414 | |||
| AIZ / Assurant, Inc. | 0.02 | 5.55 | 3.64 | -0.63 | 1.8485 | -0.1896 | |||
| RGA / Reinsurance Group of America, Incorporated | 0.02 | 17.82 | 3.63 | 18.71 | 1.8438 | 0.1417 | |||
| DOV / Dover Corporation | 0.02 | 5.55 | 3.52 | 10.08 | 1.7859 | 0.0083 | |||
| ATO / Atmos Energy Corporation | 0.02 | 4.34 | 3.51 | 4.04 | 1.7806 | -0.0950 | |||
| GTES / Gates Industrial Corporation plc | 0.15 | 25.48 | 3.48 | 56.99 | 1.7690 | 0.5342 | |||
| TTWO / Take-Two Interactive Software, Inc. | 0.01 | 5.55 | 3.43 | 23.69 | 1.7401 | 0.1985 | |||
| BWA / BorgWarner Inc. | 0.10 | 5.55 | 3.39 | 23.33 | 1.7246 | 0.1926 | |||
| AVY / Avery Dennison Corporation | 0.02 | 22.60 | 3.37 | 20.86 | 1.7103 | 0.1599 | |||
| OGE / OGE Energy Corp. | 0.08 | 5.18 | 3.33 | 1.55 | 1.6931 | -0.1335 | |||
| AMP / Ameriprise Financial, Inc. | 0.01 | 5.54 | 3.32 | 16.39 | 1.6881 | 0.0985 | |||
| USFD / US Foods Holding Corp. | 0.04 | 5.32 | 3.32 | 23.91 | 1.6852 | 0.1949 | |||
| AZO / AutoZone, Inc. | 0.00 | -7.68 | 3.30 | -10.11 | 1.6765 | -0.3673 | |||
| RRX / Regal Rexnord Corporation | 0.02 | 34.77 | 3.30 | 71.63 | 1.6749 | 0.6054 | |||
| REG / Regency Centers Corporation | 0.05 | 15.12 | 3.29 | 11.17 | 1.6690 | 0.0240 | |||
| CNP / CenterPoint Energy, Inc. | 0.09 | -20.49 | 3.22 | -19.37 | 1.6364 | -0.5874 | |||
| IFF / International Flavors & Fragrances Inc. | 0.04 | 5.55 | 3.15 | 0.03 | 1.6000 | -0.1526 | |||
| RF / Regions Financial Corporation | 0.13 | 5.35 | 3.14 | 14.04 | 1.5972 | 0.0623 | |||
| AVB / AvalonBay Communities, Inc. | 0.02 | 16.28 | 3.13 | 10.26 | 1.5894 | 0.0099 | |||
| ITT / ITT Inc. | 0.02 | 5.56 | 3.13 | 28.14 | 1.5894 | 0.2306 | |||
| PR / Permian Resources Corporation | 0.23 | 17.74 | 3.13 | 15.78 | 1.5878 | 0.0852 | |||
| RJF / Raymond James Financial, Inc. | 0.02 | 5.55 | 3.10 | 16.55 | 1.5741 | 0.0941 | |||
| CTRA / Coterra Energy Inc. | 0.12 | 39.14 | 3.09 | 22.22 | 1.5678 | 0.1619 | |||
| BR / Broadridge Financial Solutions, Inc. | 0.01 | 5.55 | 3.03 | 5.80 | 1.5374 | -0.0548 | |||
| LAD / Lithia Motors, Inc. | 0.01 | 21.14 | 3.00 | 39.40 | 1.5265 | 0.3267 | |||
| AGCO / AGCO Corporation | 0.03 | 5.55 | 3.00 | 17.64 | 1.5249 | 0.1044 | |||
| CBRE / CBRE Group, Inc. | 0.02 | 5.55 | 2.99 | 13.08 | 1.5196 | 0.0473 | |||
| XEL / Xcel Energy Inc. | 0.04 | -7.34 | 2.99 | -10.87 | 1.5166 | -0.3476 | |||
| KNX / Knight-Swift Transportation Holdings Inc. | 0.07 | 31.55 | 2.92 | 33.76 | 1.4818 | 0.2681 | |||
| CAG / Conagra Brands, Inc. | 0.14 | 5.55 | 2.92 | -19.01 | 1.4812 | -0.5222 | |||
| STAG / STAG Industrial, Inc. | 0.08 | 5.27 | 2.88 | 5.74 | 1.4613 | -0.0530 | |||
| RSG / Republic Services, Inc. | 0.01 | -12.68 | 2.85 | -11.07 | 1.4486 | -0.3364 | |||
| BJ / BJ's Wholesale Club Holdings, Inc. | 0.03 | -18.99 | 2.85 | -23.46 | 1.4478 | -0.6242 | |||
| WY / Weyerhaeuser Company | 0.11 | 24.54 | 2.85 | 9.25 | 1.4460 | -0.0041 | |||
| MOH / Molina Healthcare, Inc. | 0.01 | 4.39 | 2.84 | -5.62 | 1.4422 | -0.2316 | |||
| HAS / Hasbro, Inc. | 0.04 | 5.55 | 2.75 | 26.75 | 1.3962 | 0.1889 | |||
| EMN / Eastman Chemical Company | 0.04 | 2.72 | 1.3832 | 1.3832 | |||||
| ZBH / Zimmer Biomet Holdings, Inc. | 0.03 | 4.99 | 2.71 | -15.38 | 1.3777 | -0.4064 | |||
| OMC / Omnicom Group Inc. | 0.04 | 22.80 | 2.67 | 6.55 | 1.3560 | -0.0385 | |||
| WCC / WESCO International, Inc. | 0.01 | 2.64 | 1.3390 | 1.3390 | |||||
| PHM / PulteGroup, Inc. | 0.02 | 21.11 | 2.63 | 24.22 | 1.3343 | 0.1575 | |||
| BKR / Baker Hughes Company | 0.07 | 5.55 | 2.60 | -7.94 | 1.3191 | -0.2506 | |||
| GPN / Global Payments Inc. | 0.03 | 5.55 | 2.42 | -13.73 | 1.2296 | -0.3320 | |||
| CPB / The Campbell's Company | 0.08 | 27.12 | 2.41 | -2.43 | 1.2247 | -0.1503 | |||
| SKX / Skechers U.S.A., Inc. | 0.03 | 5.56 | 2.18 | 17.27 | 1.1079 | 0.0730 | |||
| MKSI / MKS Inc. | 0.01 | 76.03 | 1.17 | -1.69 | 0.5919 | -0.8522 |