Mga Batayang Estadistika
| Nilai Portofolio | $ 1,703,575,860 |
| Posisi Saat Ini | 161 |
Kepemilikan Terbaru, Kinerja, AUM (dari 13F, 13D)
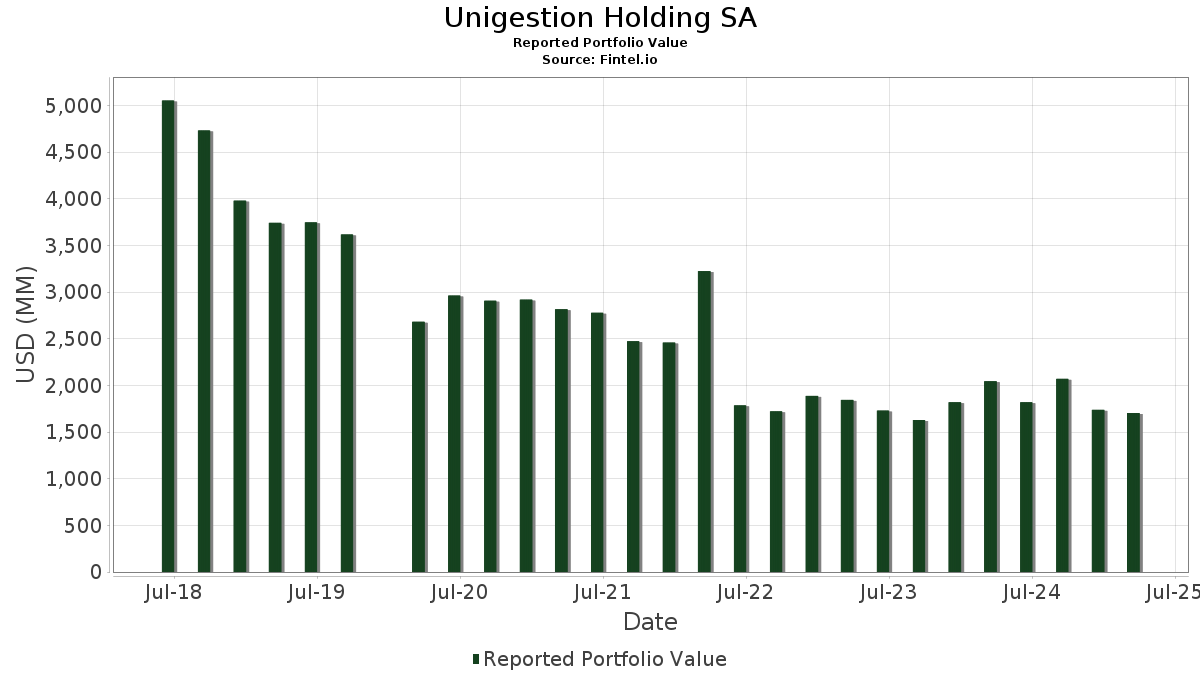
Unigestion Holding SA telah mengungkapkan total kepemilikan 161 dalam pengajuan SEC terbaru mereka. Nilai portofolio terbaru dihitung sebesar $ 1,703,575,860 USD. Aset yang Dikelola (AUM) sebenarnya adalah nilai ini ditambah kas (yang tidak diungkapkan). Aset-aset utama Unigestion Holding SA adalah Apple Inc. (US:AAPL) , Cisco Systems, Inc. (US:CSCO) , Mastercard Incorporated (US:MA) , Microsoft Corporation (US:MSFT) , and Visa Inc. (US:V) . Posisi baru Unigestion Holding SA meliputi: GoDaddy Inc. (US:GDDY) , Lam Research Corporation (US:LRCX) , General Electric Company (US:GE) , Genuine Parts Company (US:GPC) , and .
Peningkatan Tertinggi Kuartal Ini
Kami menggunakan perubahan dalam alokasi portofolio karena ini adalah metrik yang paling bermakna. Perubahan dapat disebabkan oleh perdagangan atau perubahan harga saham.
| Keamanan | Saham (MM) |
Nilai (Juta Dolar AS) |
Portfolio % | ΔPorsyento ng Portfolio |
|---|---|---|---|---|
| 0.04 | 22.67 | 1.3305 | 1.1189 | |
| 1.00 | 61.59 | 3.6156 | 0.9279 | |
| 0.05 | 14.99 | 0.8798 | 0.8798 | |
| 0.14 | 10.76 | 0.6316 | 0.5958 | |
| 0.08 | 17.00 | 0.9978 | 0.3623 | |
| 0.13 | 11.26 | 0.6612 | 0.3586 | |
| 0.00 | 18.86 | 0.3878 | 0.3423 | |
| 0.19 | 47.21 | 2.7715 | 0.3376 | |
| 0.02 | 15.26 | 0.3136 | 0.3136 | |
| 0.33 | 10.32 | 0.6057 | 0.2779 |
Penurunan Tertinggi Kuartal Ini
Kami menggunakan perubahan dalam alokasi portofolio karena ini adalah metrik yang paling bermakna. Perubahan dapat disebabkan oleh perdagangan atau perubahan harga saham.
| Keamanan | Saham (MM) |
Nilai (Juta Dolar AS) |
Portfolio % | ΔPorsyento ng Portfolio |
|---|---|---|---|---|
| 0.11 | 58.74 | 1.2075 | -2.1051 | |
| 0.11 | 18.85 | 0.3876 | -2.1010 | |
| 0.16 | 56.92 | 1.1702 | -1.8190 | |
| 0.15 | 46.52 | 0.9564 | -1.7196 | |
| 0.33 | 14.78 | 0.3039 | -1.5044 | |
| 0.13 | 11.74 | 0.2413 | -1.3994 | |
| 0.04 | 11.36 | 0.2336 | -1.3557 | |
| 0.42 | 27.73 | 0.5701 | -1.3200 | |
| 0.04 | 13.20 | 0.2715 | -1.3091 | |
| 0.61 | 43.64 | 0.8973 | -1.2237 |
Pengajuan 13F dan Dana
Formulir ini diajukan pada 2025-04-10 untuk periode pelaporan 2025-03-31. Klik ikon tautan untuk melihat riwayat transaksi selengkapnya.
Tingkatkan ke versi premium untuk membuka data premium dan ekspor ke Excel. ![]() .
.
| Keamanan | Ketik | Harga Saham Rata-rata | Saham (MM) |
ΔSaham (%) |
ΔSaham (%) |
Nilai ($MM) |
Portpolyo (%) |
ΔPortofolio (%) |
|
|---|---|---|---|---|---|---|---|---|---|
| AAPL / Apple Inc. | 0.32 | 17.17 | 71.15 | 3.90 | 4.1763 | 0.2349 | |||
| CSCO / Cisco Systems, Inc. | 1.00 | 26.54 | 61.59 | 31.91 | 3.6156 | 0.9279 | |||
| MA / Mastercard Incorporated | 0.11 | -1.91 | 58.74 | 2.06 | 1.2075 | -2.1051 | |||
| MSFT / Microsoft Corporation | 0.15 | -3.00 | 57.17 | -13.69 | 3.3556 | -0.4568 | |||
| V / Visa Inc. | 0.16 | -1.13 | 56.92 | 9.60 | 1.1702 | -1.8190 | |||
| MMC / Marsh & McLennan Companies, Inc. | 0.19 | -2.80 | 47.21 | 11.66 | 2.7715 | 0.3376 | |||
| ADP / Automatic Data Processing, Inc. | 0.15 | -4.14 | 46.52 | 0.07 | 0.9564 | -1.7196 | |||
| KO / The Coca-Cola Company | 0.61 | 2.96 | 43.64 | 18.44 | 0.8973 | -1.2237 | |||
| PAYX / Paychex, Inc. | 0.28 | 12.30 | 43.44 | 23.46 | 0.8930 | -1.1321 | |||
| MSI / Motorola Solutions, Inc. | 0.10 | 2.41 | 43.10 | -2.99 | 2.5301 | -0.0273 | |||
| COR / Cencora, Inc. | 0.15 | 19.93 | 42.62 | 48.41 | 0.8762 | -0.7769 | |||
| TMUS / T-Mobile US, Inc. | 0.16 | 17.99 | 42.30 | 42.47 | 0.8696 | -0.8393 | |||
| TJX / The TJX Companies, Inc. | 0.30 | 36.47 | 35.93 | 37.55 | 0.7388 | -0.7651 | |||
| RSG / Republic Services, Inc. | 0.14 | -0.49 | 33.41 | 19.78 | 0.6868 | -0.9186 | |||
| IBM / International Business Machines Corporation | 0.12 | -7.31 | 28.84 | 4.85 | 0.5929 | -0.9903 | |||
| NTAP / NetApp, Inc. | 0.32 | 6.49 | 28.39 | -19.38 | 1.6666 | -0.3604 | |||
| EOG / EOG Resources, Inc. | 0.22 | 22.94 | 27.81 | 28.62 | 0.5717 | -0.6728 | |||
| APH / Amphenol Corporation | 0.42 | -10.59 | 27.73 | -15.55 | 0.5701 | -1.3200 | |||
| CME / CME Group Inc. | 0.10 | 4.97 | 26.97 | 19.86 | 0.5545 | -0.7408 | |||
| HIG / The Hartford Insurance Group, Inc. | 0.21 | 2.74 | 26.21 | 16.20 | 0.5389 | -0.7596 | |||
| WM / Waste Management, Inc. | 0.11 | -13.67 | 25.12 | -0.93 | 1.4746 | 0.0150 | |||
| RY / Royal Bank of Canada | 0.21 | 48.68 | 23.71 | 39.00 | 0.4874 | -0.4943 | |||
| META / Meta Platforms, Inc. | 0.04 | 526.64 | 22.67 | 516.73 | 1.3305 | 1.1189 | |||
| CNQ / Canadian Natural Resources Limited | 0.69 | 19.30 | 21.33 | 19.15 | 0.4385 | -0.5919 | |||
| SLF / Sun Life Financial Inc. | 0.35 | 44.23 | 19.99 | 39.21 | 0.4110 | -0.4156 | |||
| JNJ / Johnson & Johnson | 0.12 | -56.96 | 19.23 | -50.64 | 1.1289 | -1.1139 | |||
| BKNG / Booking Holdings Inc. | 0.00 | 2,478.62 | 18.86 | 2,290.62 | 0.3878 | 0.3423 | |||
| PG / The Procter & Gamble Company | 0.11 | -57.10 | 18.85 | -56.39 | 0.3876 | -2.1010 | |||
| KMB / Kimberly-Clark Corporation | 0.13 | 8.17 | 18.15 | 17.41 | 0.3730 | -0.5166 | |||
| CBOE / Cboe Global Markets, Inc. | 0.08 | 33.15 | 17.00 | 53.96 | 0.9978 | 0.3623 | |||
| ORLY / O'Reilly Automotive, Inc. | 0.01 | -6.34 | 15.47 | 13.15 | 0.3181 | -0.4689 | |||
| NFLX / Netflix, Inc. | 0.02 | 15.26 | 0.3136 | 0.3136 | |||||
| GWW / W.W. Grainger, Inc. | 0.02 | 1,743.82 | 15.15 | 1,625.97 | 0.3116 | 0.2610 | |||
| PGR / The Progressive Corporation | 0.05 | 14.99 | 0.8798 | 0.8798 | |||||
| VZ / Verizon Communications Inc. | 0.33 | -58.52 | 14.78 | -52.95 | 0.3039 | -1.5044 | |||
| IT / Gartner, Inc. | 0.03 | -27.77 | 14.66 | -37.50 | 0.3015 | -1.0489 | |||
| HD / The Home Depot, Inc. | 0.04 | -31.37 | 13.82 | -35.35 | 0.2842 | -0.9466 | |||
| PKG / Packaging Corporation of America | 0.07 | 12.82 | 13.58 | -0.80 | 0.7974 | 0.0092 | |||
| CDW / CDW Corporation | 0.08 | -41.72 | 13.26 | -46.36 | 0.7785 | -0.6446 | |||
| VRSK / Verisk Analytics, Inc. | 0.04 | -55.48 | 13.20 | -51.92 | 0.2715 | -1.3091 | |||
| BRK.B / Berkshire Hathaway Inc. | 0.02 | -18.66 | 13.20 | -4.43 | 0.7747 | -0.0202 | |||
| NVDA / NVIDIA Corporation | 0.12 | 54.11 | 13.02 | 24.37 | 0.7645 | 0.1618 | |||
| COP / ConocoPhillips | 0.12 | -34.18 | 12.84 | -30.30 | 0.2640 | -0.7964 | |||
| ITW / Illinois Tool Works Inc. | 0.05 | -58.17 | 12.65 | -59.08 | 0.7423 | -1.0367 | |||
| COST / Costco Wholesale Corporation | 0.01 | 1,689.65 | 12.59 | 1,748.60 | 0.2588 | 0.2196 | |||
| CL / Colgate-Palmolive Company | 0.13 | -60.05 | 11.74 | -58.82 | 0.2413 | -1.3994 | |||
| AZO / AutoZone, Inc. | 0.00 | -48.71 | 11.42 | -38.92 | 0.2348 | -0.8417 | |||
| MCD / McDonald's Corporation | 0.04 | -61.79 | 11.36 | -58.85 | 0.2336 | -1.3557 | |||
| WMT / Walmart Inc. | 0.13 | 120.49 | 11.26 | 114.25 | 0.6612 | 0.3586 | |||
| EBGEF / Enbridge Inc. - Preferred Stock | 0.25 | 0.82 | 11.25 | 5.16 | 0.2313 | -0.3845 | |||
| CHD / Church & Dwight Co., Inc. | 0.10 | -29.82 | 11.05 | -26.25 | 0.2271 | -0.6352 | |||
| CAH / Cardinal Health, Inc. | 0.08 | 69.74 | 10.88 | 97.75 | 0.2236 | -0.0930 | |||
| CTSH / Cognizant Technology Solutions Corporation | 0.14 | 1,636.95 | 10.76 | 1,629.90 | 0.6316 | 0.5958 | |||
| ED / Consolidated Edison, Inc. | 0.09 | -64.45 | 10.43 | -55.94 | 0.2144 | -1.1481 | |||
| MFC / Manulife Financial Corporation | 0.33 | 78.40 | 10.32 | 81.21 | 0.6057 | 0.2779 | |||
| T / AT&T Inc. | 0.36 | 10.20 | 0.2097 | 0.2097 | |||||
| SRE / Sempra | 0.14 | -57.10 | 10.17 | -65.12 | 0.5969 | -1.0812 | |||
| CMCSA / Comcast Corporation | 0.24 | 13.42 | 8.75 | 11.52 | 0.5137 | 0.0620 | |||
| GOOGL / Alphabet Inc. | 0.06 | -37.73 | 8.62 | -49.13 | 0.1772 | -0.7980 | |||
| AMZN / Amazon.com, Inc. | 0.04 | 102.50 | 8.21 | 75.60 | 0.4822 | 0.2129 | |||
| SSNC / SS&C Technologies Holdings, Inc. | 0.10 | 861.68 | 7.96 | 960.32 | 0.1637 | 0.1205 | |||
| CTAS / Cintas Corporation | 0.04 | -12.37 | 7.86 | -1.42 | 0.1616 | -0.2973 | |||
| GDDY / GoDaddy Inc. | 0.04 | 7.56 | 0.1554 | 0.1554 | |||||
| PEP / PepsiCo, Inc. | 0.05 | -62.38 | 7.39 | -62.91 | 0.4338 | -0.7129 | |||
| NVR / NVR, Inc. | 0.00 | -8.29 | 7.30 | -18.76 | 0.4282 | -0.0887 | |||
| BNS / The Bank of Nova Scotia | 0.14 | -11.76 | 6.63 | -21.97 | 0.1364 | -0.3530 | |||
| EBAY / eBay Inc. | 0.09 | 44.62 | 5.88 | 58.08 | 0.3450 | 0.1310 | |||
| SPG / Simon Property Group, Inc. | 0.03 | -10.26 | 5.63 | -13.44 | 0.1158 | -0.2588 | |||
| GIB / CGI Inc. | 0.05 | 48.72 | 5.49 | 35.90 | 0.1129 | -0.1197 | |||
| BR / Broadridge Financial Solutions, Inc. | 0.02 | -0.91 | 5.48 | 6.28 | 0.1127 | -0.1842 | |||
| QCOM / QUALCOMM Incorporated | 0.03 | -54.91 | 5.34 | -54.92 | 0.3137 | -0.3687 | |||
| AMGN / Amgen Inc. | 0.02 | -9.01 | 5.32 | 8.75 | 0.1094 | -0.1722 | |||
| MCO / Moody's Corporation | 0.01 | 53.74 | 5.22 | 51.27 | 0.1074 | -0.0914 | |||
| CNI / Canadian National Railway Company | 0.05 | -63.27 | 5.22 | -64.72 | 0.1072 | -0.7437 | |||
| ABBV / AbbVie Inc. | 0.02 | -55.60 | 5.18 | -47.65 | 0.1066 | -0.4634 | |||
| CM / Canadian Imperial Bank of Commerce | 0.09 | 0.55 | 5.10 | -10.40 | 0.2994 | -0.0283 | |||
| MDLZ / Mondelez International, Inc. | 0.07 | -10.81 | 5.06 | 1.32 | 0.1041 | -0.1835 | |||
| MRK / Merck & Co., Inc. | 0.05 | 127.09 | 4.94 | 104.90 | 0.1015 | -0.0372 | |||
| EXPD / Expeditors International of Washington, Inc. | 0.04 | -51.88 | 4.72 | -47.77 | 0.0969 | -0.4227 | |||
| MCK / McKesson Corporation | 0.01 | -52.62 | 4.71 | -44.06 | 0.2765 | -0.2081 | |||
| FFIV / F5, Inc. | 0.02 | 605.32 | 4.56 | 647.21 | 0.2676 | 0.2324 | |||
| KR / The Kroger Co. | 0.07 | 30.62 | 4.50 | 44.63 | 0.0924 | -0.0865 | |||
| KDP / Keurig Dr Pepper Inc. | 0.13 | 40.10 | 4.41 | 49.27 | 0.0908 | -0.0795 | |||
| AVY / Avery Dennison Corporation | 0.02 | -41.44 | 4.40 | -44.31 | 0.2585 | -0.1967 | |||
| GOOG / Alphabet Inc. | 0.03 | 446.44 | 4.38 | 348.36 | 0.0900 | 0.0338 | |||
| GILD / Gilead Sciences, Inc. | 0.04 | 4.32 | 0.2539 | 0.2539 | |||||
| AMP / Ameriprise Financial, Inc. | 0.01 | 151.66 | 4.17 | 128.80 | 0.2449 | 0.1399 | |||
| AVGO / Broadcom Inc. | 0.02 | 45.53 | 4.09 | 5.08 | 0.2403 | 0.0161 | |||
| SHW / The Sherwin-Williams Company | 0.01 | 357.00 | 3.83 | 369.82 | 0.0787 | 0.0318 | |||
| PH / Parker-Hannifin Corporation | 0.01 | 146.60 | 3.68 | 135.64 | 0.0756 | -0.0142 | |||
| LRCX / Lam Research Corporation | 0.05 | 3.56 | 0.2088 | 0.2088 | |||||
| AOS / A. O. Smith Corporation | 0.05 | -50.28 | 3.51 | -52.36 | 0.2060 | -0.2179 | |||
| PFG / Principal Financial Group, Inc. | 0.04 | -9.60 | 3.47 | -1.48 | 0.0714 | -0.1315 | |||
| SNA / Snap-on Incorporated | 0.01 | -69.94 | 3.33 | -70.16 | 0.1955 | -0.4468 | |||
| LLY / Eli Lilly and Company | 0.00 | 158.34 | 3.31 | 176.54 | 0.0681 | -0.0009 | |||
| INTU / Intuit Inc. | 0.00 | 101.15 | 3.00 | 96.59 | 0.1762 | 0.0883 | |||
| TSLA / Tesla, Inc. | 0.01 | 141.72 | 2.94 | 55.14 | 0.1728 | 0.0635 | |||
| OC / Owens Corning | 0.02 | 2.92 | 0.0600 | 0.0600 | |||||
| HPQ / HP Inc. | 0.10 | 2.77 | 0.1625 | 0.1625 | |||||
| REG / Regency Centers Corporation | 0.04 | 118.06 | 2.68 | 117.64 | 0.1571 | 0.0863 | |||
| UTHR / United Therapeutics Corporation | 0.01 | 2.67 | 0.0549 | 0.0549 | |||||
| ADSK / Autodesk, Inc. | 0.01 | 2.59 | 0.0533 | 0.0533 | |||||
| MAA / Mid-America Apartment Communities, Inc. | 0.02 | 90.23 | 2.56 | 106.28 | 0.0527 | -0.0189 | |||
| FAST / Fastenal Company | 0.03 | 404.14 | 2.54 | 444.11 | 0.0522 | 0.0253 | |||
| GEN / Gen Digital Inc. | 0.09 | -79.85 | 2.41 | -80.48 | 0.1416 | -0.5695 | |||
| OKE / ONEOK, Inc. | 0.02 | 132.89 | 2.33 | 130.27 | 0.0479 | -0.0104 | |||
| ORCL / Oracle Corporation | 0.02 | 81.21 | 2.32 | 52.00 | 0.0477 | -0.0401 | |||
| KIM / Kimco Realty Corporation | 0.11 | 211.97 | 2.29 | 182.86 | 0.1347 | 0.0880 | |||
| TDG / TransDigm Group Incorporated | 0.00 | 46.88 | 2.28 | 60.32 | 0.1336 | 0.0519 | |||
| PRU / Prudential Financial, Inc. | 0.02 | -22.20 | 2.21 | -26.72 | 0.1300 | -0.0439 | |||
| KMI / Kinder Morgan, Inc. | 0.08 | -17.05 | 2.21 | -13.64 | 0.1297 | -0.0175 | |||
| WRB / W. R. Berkley Corporation | 0.03 | 113.66 | 2.11 | 159.85 | 0.1239 | 0.0771 | |||
| INVH / Invitation Homes Inc. | 0.06 | 98.10 | 1.93 | 115.98 | 0.1135 | 0.0619 | |||
| MET / MetLife, Inc. | 0.02 | 0.70 | 1.90 | -1.25 | 0.1115 | 0.0008 | |||
| AMAT / Applied Materials, Inc. | 0.01 | 83.99 | 1.86 | 64.16 | 0.0382 | -0.0269 | |||
| ADBE / Adobe Inc. | 0.00 | -79.59 | 1.84 | -82.39 | 0.0378 | -0.5638 | |||
| FTXP / Foothills Exploration, Inc. | 0.00 | 24.11 | 1.83 | 33.87 | 0.0376 | -0.0410 | |||
| ATO / Atmos Energy Corporation | 0.01 | 1.80 | 0.1058 | 0.1058 | |||||
| PPG / PPG Industries, Inc. | 0.02 | 1.79 | 0.0367 | 0.0367 | |||||
| SYF / Synchrony Financial | 0.03 | 81.99 | 1.76 | 48.31 | 0.0361 | -0.0321 | |||
| HLT / Hilton Worldwide Holdings Inc. | 0.01 | 304.32 | 1.75 | 272.71 | 0.1026 | 0.0756 | |||
| FTS / Fortis Inc. | 0.04 | -38.85 | 1.74 | -32.86 | 0.0357 | -0.1131 | |||
| LII / Lennox International Inc. | 0.00 | 116.40 | 1.72 | 99.31 | 0.0355 | -0.0144 | |||
| AME / AMETEK, Inc. | 0.01 | 89.54 | 1.72 | 80.97 | 0.0354 | -0.0194 | |||
| GIL / Gildan Activewear Inc. | 0.04 | 1.70 | 0.0350 | 0.0350 | |||||
| SYK / Stryker Corporation | 0.00 | 182.43 | 1.69 | 192.37 | 0.0991 | 0.0658 | |||
| ALL / The Allstate Corporation | 0.01 | 1.57 | 0.0323 | 0.0323 | |||||
| UDR / UDR, Inc. | 0.03 | 98.72 | 1.57 | 106.86 | 0.0322 | -0.0114 | |||
| ESS / Essex Property Trust, Inc. | 0.01 | 113.99 | 1.55 | 129.93 | 0.0319 | -0.0070 | |||
| MAR / Marriott International, Inc. | 0.01 | 1.53 | 0.0314 | 0.0314 | |||||
| EQH / Equitable Holdings, Inc. | 0.03 | 68.96 | 1.47 | 86.66 | 0.0862 | 0.0409 | |||
| FLT / Corpay, Inc. | 0.00 | 63.32 | 1.42 | 68.20 | 0.0836 | 0.0349 | |||
| HUBB / Hubbell Incorporated | 0.00 | 111.09 | 1.40 | 66.94 | 0.0824 | 0.0340 | |||
| DOV / Dover Corporation | 0.01 | 0.00 | 1.38 | -6.33 | 0.0283 | -0.0563 | |||
| FTNT / Fortinet, Inc. | 0.01 | 1.33 | 0.0780 | 0.0780 | |||||
| BRO / Brown & Brown, Inc. | 0.01 | 146.52 | 1.30 | 200.93 | 0.0267 | 0.0018 | |||
| SNPS / Synopsys, Inc. | 0.00 | 1.29 | 0.0264 | 0.0264 | |||||
| AJG / Arthur J. Gallagher & Co. | 0.00 | -36.35 | 1.23 | -22.59 | 0.0253 | -0.0662 | |||
| DRI / Darden Restaurants, Inc. | 0.01 | 101.03 | 1.21 | 123.84 | 0.0249 | -0.0063 | |||
| RF / Regions Financial Corporation | 0.05 | 107.14 | 1.17 | 91.49 | 0.0687 | 0.0335 | |||
| GE / General Electric Company | 0.01 | 1.15 | 0.0677 | 0.0677 | |||||
| CDNS / Cadence Design Systems, Inc. | 0.00 | 107.87 | 1.15 | 76.07 | 0.0674 | 0.0299 | |||
| XPRO / Expro Group Holdings N.V. | 0.01 | 1.15 | 0.0236 | 0.0236 | |||||
| SU / Suncor Energy Inc. | 0.03 | 1.15 | 0.0236 | 0.0236 | |||||
| FNF / Fidelity National Financial, Inc. | 0.02 | 1.08 | 0.0222 | 0.0222 | |||||
| SYY / Sysco Corporation | 0.01 | 45.70 | 1.05 | 42.99 | 0.0216 | -0.0207 | |||
| TRV / The Travelers Companies, Inc. | 0.00 | 121.39 | 1.03 | 143.26 | 0.0212 | -0.0032 | |||
| ELS / Equity LifeStyle Properties, Inc. | 0.02 | 106.43 | 1.02 | 106.91 | 0.0209 | -0.0074 | |||
| CRM / Salesforce, Inc. | 0.00 | 0.97 | 0.0572 | 0.0572 | |||||
| GIS / General Mills, Inc. | 0.02 | -88.82 | 0.96 | -89.52 | 0.0197 | -0.5061 | |||
| NOW / ServiceNow, Inc. | 0.00 | 0.92 | 0.0190 | 0.0190 | |||||
| AVB / AvalonBay Communities, Inc. | 0.00 | 66.11 | 0.91 | 62.06 | 0.0188 | -0.0137 | |||
| SPGI / S&P Global Inc. | 0.00 | 0.88 | 0.0182 | 0.0182 | |||||
| CPT / Camden Property Trust | 0.01 | 65.70 | 0.87 | 74.90 | 0.0179 | -0.0108 | |||
| UNP / Union Pacific Corporation | 0.00 | -93.22 | 0.86 | -92.98 | 0.0177 | -0.6876 | |||
| GPC / Genuine Parts Company | 0.01 | 0.86 | 0.0502 | 0.0502 | |||||
| ANET / Arista Networks Inc | 0.01 | 0.83 | 0.0487 | 0.0487 | |||||
| CINF / Cincinnati Financial Corporation | 0.01 | 0.82 | 0.0169 | 0.0169 | |||||
| HEI / HEICO Corporation | 0.00 | -4.48 | 0.80 | 7.36 | 0.0165 | -0.0265 | |||
| FOXA / Fox Corporation | 0.01 | -14.15 | 0.58 | 0.00 | 0.0120 | -0.0216 | |||
| BAP / Credicorp Ltd. | 0.00 | 0.21 | 0.0044 | 0.0044 | |||||
| AFG / American Financial Group, Inc. | 0.00 | -100.00 | 0.00 | 0.0000 | |||||
| YUMC / Yum China Holdings, Inc. | 0.00 | -100.00 | 0.00 | 0.0000 | |||||
| JPM / JPMorgan Chase & Co. | 0.00 | -100.00 | 0.00 | 0.0000 | |||||
| IQV / IQVIA Holdings Inc. | 0.00 | -100.00 | 0.00 | 0.0000 | |||||
| ROP / Roper Technologies, Inc. | 0.00 | -100.00 | 0.00 | 0.0000 | |||||
| EQR / Equity Residential | 0.00 | -100.00 | 0.00 | 0.0000 | |||||
| BCE / BCE Inc. | 0.00 | -100.00 | 0.00 | 0.0000 | |||||
| HCA / HCA Healthcare, Inc. | 0.00 | -100.00 | 0.00 | 0.0000 | |||||
| A / Agilent Technologies, Inc. | 0.00 | -100.00 | 0.00 | 0.0000 | |||||
| GGG / Graco Inc. | 0.00 | -100.00 | 0.00 | 0.0000 | |||||
| NTRS / Northern Trust Corporation | 0.00 | -100.00 | 0.00 | 0.0000 | |||||
| TME / Tencent Music Entertainment Group - Depositary Receipt (Common Stock) | 0.00 | -100.00 | 0.00 | 0.0000 | |||||
| PSX / Phillips 66 | 0.00 | -100.00 | 0.00 | 0.0000 | |||||
| EA / Electronic Arts Inc. | 0.00 | -100.00 | 0.00 | 0.0000 | |||||
| VLO / Valero Energy Corporation | 0.00 | -100.00 | 0.00 | 0.0000 | |||||
| UNH / UnitedHealth Group Incorporated | 0.00 | -100.00 | 0.00 | 0.0000 | |||||
| AFL / Aflac Incorporated | 0.00 | -100.00 | 0.00 | 0.0000 | |||||
| ELV / Elevance Health, Inc. | 0.00 | -100.00 | 0.00 | 0.0000 | |||||
| CLX / The Clorox Company | 0.00 | -100.00 | 0.00 | 0.0000 | |||||
| FANG / Diamondback Energy, Inc. | 0.00 | -100.00 | 0.00 | 0.0000 |