Mga Batayang Estadistika
| Nilai Portofolio | $ 587,584,653 |
| Posisi Saat Ini | 57 |
Kepemilikan Terbaru, Kinerja, AUM (dari 13F, 13D)
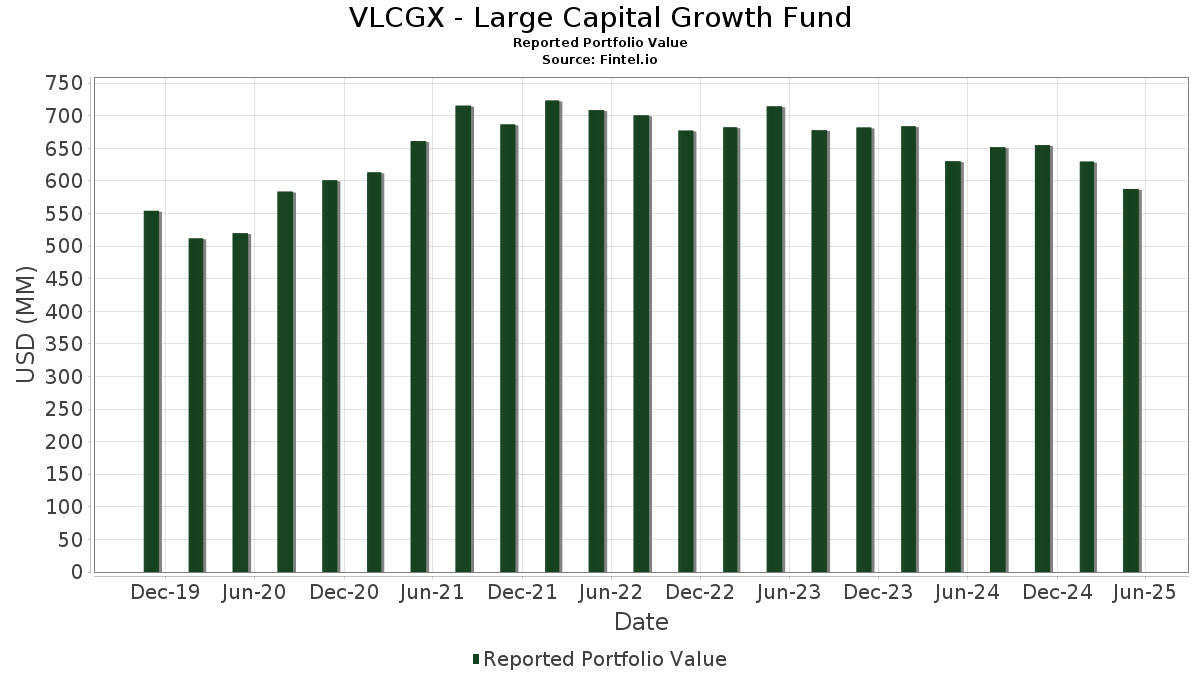
VLCGX - Large Capital Growth Fund telah mengungkapkan total kepemilikan 57 dalam pengajuan SEC terbaru mereka. Nilai portofolio terbaru dihitung sebesar $ 587,584,653 USD. Aset yang Dikelola (AUM) sebenarnya adalah nilai ini ditambah kas (yang tidak diungkapkan). Aset-aset utama VLCGX - Large Capital Growth Fund adalah Microsoft Corporation (US:MSFT) , NVIDIA Corporation (US:NVDA) , Apple Inc. (US:AAPL) , Visa Inc. (US:V) , and Accenture plc (US:ACN) . Posisi baru VLCGX - Large Capital Growth Fund meliputi: Pool Corporation (US:POOL) , Federal Home Loan Bank (FHLB) (US:US313385GJ96) , .
Peningkatan Tertinggi Kuartal Ini
Kami menggunakan perubahan dalam alokasi portofolio karena ini adalah metrik yang paling bermakna. Perubahan dapat disebabkan oleh perdagangan atau perubahan harga saham.
| Keamanan | Saham (MM) |
Nilai (Juta Dolar AS) |
Portfolio % | ΔPorsyento ng Portfolio |
|---|---|---|---|---|
| 0.18 | 85.09 | 14.4754 | 1.9384 | |
| 0.02 | 5.31 | 0.9040 | 0.9040 | |
| 0.16 | 13.73 | 2.3364 | 0.6406 | |
| 0.06 | 13.69 | 2.3288 | 0.5803 | |
| 0.03 | 12.86 | 2.1872 | 0.5439 | |
| 0.24 | 32.72 | 5.5670 | 0.5058 | |
| 0.01 | 5.89 | 1.0017 | 0.3901 | |
| 0.14 | 12.54 | 2.1334 | 0.3508 | |
| 1.85 | 0.3155 | 0.3155 | ||
| 0.04 | 8.26 | 1.4045 | 0.3038 |
Penurunan Tertinggi Kuartal Ini
Kami menggunakan perubahan dalam alokasi portofolio karena ini adalah metrik yang paling bermakna. Perubahan dapat disebabkan oleh perdagangan atau perubahan harga saham.
| Keamanan | Saham (MM) |
Nilai (Juta Dolar AS) |
Portfolio % | ΔPorsyento ng Portfolio |
|---|---|---|---|---|
| 0.14 | 27.65 | 4.7047 | -0.8664 | |
| 0.08 | 5.14 | 0.8736 | -0.7515 | |
| 0.07 | 25.06 | 4.2638 | -0.7153 | |
| 0.06 | 6.18 | 1.0521 | -0.5498 | |
| 0.01 | 3.67 | 0.6236 | -0.5182 | |
| 0.04 | 7.07 | 1.2030 | -0.5100 | |
| 0.06 | 4.02 | 0.6844 | -0.4130 | |
| 0.04 | 14.28 | 2.4297 | -0.3527 | |
| 0.03 | 2.41 | 0.4104 | -0.3516 | |
| 0.02 | 3.77 | 0.6421 | -0.3391 |
Pengajuan 13F dan Dana
Formulir ini diajukan pada 2025-07-28 untuk periode pelaporan 2025-05-31. Klik ikon tautan untuk melihat riwayat transaksi selengkapnya.
Tingkatkan ke versi premium untuk membuka data premium dan ekspor ke Excel. ![]() .
.
| Keamanan | Ketik | Harga Saham Rata-rata | Saham (MM) |
ΔSaham (%) |
ΔSaham (%) |
Nilai ($MM) |
Portpolyo (%) |
ΔPortofolio (%) |
|
|---|---|---|---|---|---|---|---|---|---|
| MSFT / Microsoft Corporation | 0.18 | -7.06 | 85.09 | 7.78 | 14.4754 | 1.9384 | |||
| NVDA / NVIDIA Corporation | 0.24 | -5.08 | 32.72 | 2.68 | 5.5670 | 0.5058 | |||
| AAPL / Apple Inc. | 0.14 | -5.08 | 27.65 | -21.17 | 4.7047 | -0.8664 | |||
| V / Visa Inc. | 0.07 | -20.61 | 25.06 | -20.06 | 4.2638 | -0.7153 | |||
| ACN / Accenture plc | 0.06 | -5.08 | 18.99 | -13.71 | 3.2304 | -0.2641 | |||
| AON / Aon plc | 0.04 | -10.37 | 14.28 | -18.49 | 2.4297 | -0.3527 | |||
| CRM / Salesforce, Inc. | 0.05 | 13.83 | 13.77 | 1.42 | 2.3428 | 0.1864 | |||
| TRU / TransUnion | 0.16 | 38.83 | 13.73 | 28.62 | 2.3364 | 0.6406 | |||
| STE / STERIS plc | 0.06 | 11.17 | 13.69 | 24.33 | 2.3288 | 0.5803 | |||
| CHD / Church & Dwight Co., Inc. | 0.14 | -5.08 | 13.41 | -16.08 | 2.2817 | -0.2564 | |||
| GOOGL / Alphabet Inc. | 0.08 | -19.38 | 13.38 | -18.69 | 2.2756 | -0.3370 | |||
| HUBB / Hubbell Incorporated | 0.03 | 18.50 | 12.86 | 24.25 | 2.1872 | 0.5439 | |||
| APH / Amphenol Corporation | 0.14 | -17.26 | 12.54 | 11.72 | 2.1334 | 0.3508 | |||
| CMS / CMS Energy Corporation | 0.18 | -5.08 | 12.42 | -8.75 | 2.1126 | -0.0484 | |||
| ETN / Eaton Corporation plc | 0.04 | -5.08 | 12.42 | 3.62 | 2.1123 | 0.2094 | |||
| AMT / American Tower Corporation | 0.06 | -5.08 | 11.94 | -0.91 | 2.0305 | 0.1176 | |||
| A / Agilent Technologies, Inc. | 0.10 | -5.08 | 10.73 | -16.95 | 1.8260 | -0.2265 | |||
| TSM / Taiwan Semiconductor Manufacturing Company Limited - Depositary Receipt (Common Stock) | 0.05 | -5.08 | 10.47 | 1.64 | 1.7808 | 0.1454 | |||
| NNND / Tencent Holdings Limited | 0.16 | -5.07 | 10.35 | -2.13 | 1.7608 | 0.0813 | |||
| PEP / PepsiCo, Inc. | 0.07 | -5.08 | 9.30 | -18.71 | 1.5830 | -0.2346 | |||
| BDX / Becton, Dickinson and Company | 0.05 | 17.20 | 9.23 | -10.31 | 1.5703 | -0.0640 | |||
| MA / Mastercard Incorporated | 0.02 | -5.08 | 8.82 | -3.55 | 1.5003 | 0.0482 | |||
| DHR / Danaher Corporation | 0.04 | 30.31 | 8.26 | 19.10 | 1.4045 | 0.3038 | |||
| ROST / Ross Stores, Inc. | 0.06 | -5.08 | 8.03 | -5.24 | 1.3658 | 0.0204 | |||
| TE Connectivity PLC / EC (IE000IVNQZ81) | 0.05 | -5.08 | 8.01 | -1.35 | 1.3633 | 0.0732 | |||
| MCO / Moody's Corporation | 0.02 | -5.08 | 7.73 | -9.72 | 1.3150 | -0.0446 | |||
| MMC / Marsh & McLennan Companies, Inc. | 0.03 | -5.08 | 7.46 | -6.75 | 1.2699 | -0.0013 | |||
| SCHW / The Charles Schwab Corporation | 0.08 | -5.08 | 7.32 | 5.43 | 1.2446 | 0.1427 | |||
| DIS / The Walt Disney Company | 0.06 | -5.08 | 7.22 | -5.72 | 1.2289 | 0.0122 | |||
| MKC / McCormick & Company, Incorporated | 0.10 | -5.08 | 7.12 | -16.44 | 1.2115 | -0.1418 | |||
| HLT / Hilton Worldwide Holdings Inc. | 0.03 | -5.08 | 7.10 | -11.00 | 1.2083 | -0.0590 | |||
| SHW / The Sherwin-Williams Company | 0.02 | -5.08 | 7.10 | -5.99 | 1.2078 | 0.0085 | |||
| FI / Fiserv, Inc. | 0.04 | -5.08 | 7.07 | -34.44 | 1.2030 | -0.5100 | |||
| OTIS / Otis Worldwide Corporation | 0.07 | -5.08 | 6.58 | -9.30 | 1.1188 | -0.0326 | |||
| TJX / The TJX Companies, Inc. | 0.05 | -5.08 | 6.44 | -3.45 | 1.0950 | 0.0363 | |||
| BAM / Brookfield Asset Management Ltd. | 0.11 | -5.08 | 6.41 | -5.49 | 1.0904 | 0.0134 | |||
| EL / The Estée Lauder Companies Inc. | 0.09 | -5.08 | 6.35 | -11.65 | 1.0802 | -0.0610 | |||
| MTD / Mettler-Toledo International Inc. | 0.01 | -5.08 | 6.19 | -13.83 | 1.0539 | -0.0877 | |||
| BSX / Boston Scientific Corporation | 0.06 | -39.55 | 6.18 | -38.69 | 1.0521 | -0.5498 | |||
| MC / LVMH Moët Hennessy - Louis Vuitton, Société Européenne | 0.01 | -5.09 | 5.99 | -29.07 | 1.0196 | -0.3222 | |||
| LRLCY / L'Oréal S.A. - Depositary Receipt (Common Stock) | 0.01 | 18.82 | 5.89 | 76.29 | 1.0017 | 0.3901 | |||
| POOL / Pool Corporation | 0.02 | 5.31 | 0.9040 | 0.9040 | |||||
| CP / Canadian Pacific Kansas City Limited | 0.06 | -22.50 | 5.30 | -18.79 | 0.9014 | -0.1347 | |||
| SBGSY / Schneider Electric S.E. - Depositary Receipt (Common Stock) | 0.02 | -5.08 | 5.29 | -3.40 | 0.9002 | 0.0302 | |||
| NKE / NIKE, Inc. | 0.08 | -34.22 | 5.14 | -49.82 | 0.8736 | -0.7515 | |||
| CME / CME Group Inc. | 0.02 | -5.08 | 5.06 | 8.10 | 0.8603 | 0.1174 | |||
| GGG / Graco Inc. | 0.05 | -5.08 | 4.04 | -7.70 | 0.6873 | -0.0078 | |||
| Aptiv PLC / EC (JE00BTDN8H13) | 0.06 | -43.26 | 4.02 | -41.79 | 0.6844 | -0.4130 | |||
| ADI / Analog Devices, Inc. | 0.02 | -34.32 | 3.77 | -38.91 | 0.6421 | -0.3391 | |||
| TXN / Texas Instruments Incorporated | 0.02 | -5.08 | 3.75 | -11.46 | 0.6378 | -0.0345 | |||
| IT / Gartner, Inc. | 0.01 | -41.79 | 3.67 | -49.02 | 0.6236 | -0.5182 | |||
| ICLR / ICON Public Limited Company | 0.03 | -5.08 | 3.63 | -34.93 | 0.6179 | -0.2684 | |||
| VEEV / Veeva Systems Inc. | 0.01 | -5.07 | 3.25 | 18.47 | 0.5521 | 0.1170 | |||
| TMO / Thermo Fisher Scientific Inc. | 0.01 | -5.08 | 3.18 | -27.71 | 0.5405 | -0.1575 | |||
| SYK / Stryker Corporation | 0.01 | -5.08 | 2.62 | -5.96 | 0.4453 | 0.0033 | |||
| SBUX / Starbucks Corporation | 0.03 | -30.65 | 2.41 | -49.72 | 0.4104 | -0.3516 | |||
| US313385GJ96 / Federal Home Loan Bank (FHLB) | 1.85 | 0.3155 | 0.3155 |