Mga Batayang Estadistika
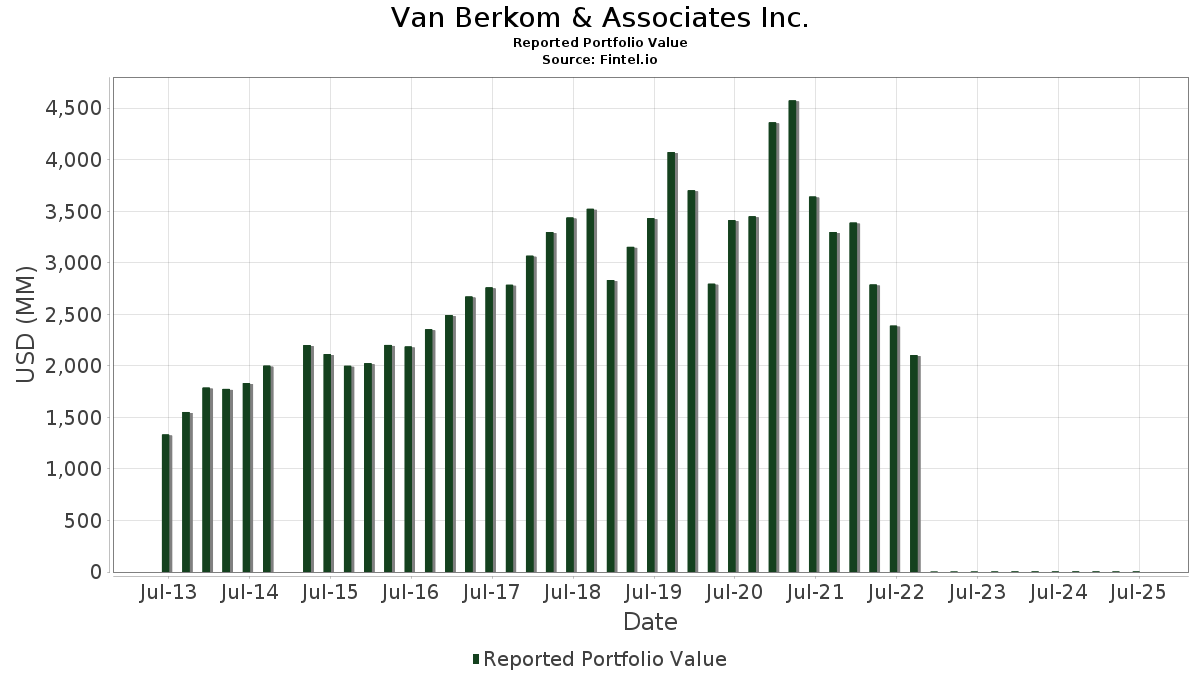
| Nilai Portofolio | $ 3,359,957 |
| Posisi Saat Ini | 63 |
Kepemilikan Terbaru, Kinerja, AUM (dari 13F, 13D)
Van Berkom & Associates Inc. telah mengungkapkan total kepemilikan 63 dalam pengajuan SEC terbaru mereka. Nilai portofolio terbaru dihitung sebesar $ 3,359,957 USD. Aset yang Dikelola (AUM) sebenarnya adalah nilai ini ditambah kas (yang tidak diungkapkan). Aset-aset utama Van Berkom & Associates Inc. adalah Laureate Education, Inc. (US:LAUR) , The Ensign Group, Inc. (US:ENSG) , Victory Capital Holdings, Inc. (US:VCTR) , StoneX Group Inc. (US:SNEX) , and Euronet Worldwide, Inc. (US:EEFT) . Posisi baru Van Berkom & Associates Inc. meliputi: RadNet, Inc. (US:RDNT) , . Industri unggulan Van Berkom & Associates Inc. adalah "Apparel And Other Finished Products Made From Fabrics And Similar Materials" (sic 23) , "Leather And Leather Products" (sic 31) , and "Wholesale Trade-durable Goods" (sic 50) .
Peningkatan Tertinggi Kuartal Ini
Kami menggunakan perubahan dalam alokasi portofolio karena ini adalah metrik yang paling bermakna. Perubahan dapat disebabkan oleh perdagangan atau perubahan harga saham.
| Keamanan | Saham (MM) |
Nilai (Juta Dolar AS) |
Portfolio % | ΔPorsyento ng Portfolio |
|---|---|---|---|---|
| 0.91 | 0.05 | 1.3866 | 1.3502 | |
| 2.06 | 0.07 | 2.2077 | 1.1539 | |
| 0.56 | 0.07 | 1.9979 | 0.7558 | |
| 0.44 | 0.07 | 2.1884 | 0.6664 | |
| 2.90 | 0.07 | 1.9860 | 0.5342 | |
| 0.77 | 0.06 | 1.7321 | 0.4520 | |
| 0.63 | 0.09 | 2.6367 | 0.4124 | |
| 2.85 | 0.08 | 2.2422 | 0.3757 | |
| 0.98 | 0.08 | 2.2755 | 0.3273 | |
| 0.42 | 0.07 | 2.0361 | 0.2990 |
Penurunan Tertinggi Kuartal Ini
Kami menggunakan perubahan dalam alokasi portofolio karena ini adalah metrik yang paling bermakna. Perubahan dapat disebabkan oleh perdagangan atau perubahan harga saham.
| Keamanan | Saham (MM) |
Nilai (Juta Dolar AS) |
Portfolio % | ΔPorsyento ng Portfolio |
|---|---|---|---|---|
| 0.01 | 0.00 | 0.0165 | -1.6638 | |
| 3.21 | 0.04 | 1.1879 | -0.5848 | |
| 0.45 | 0.08 | 2.4469 | -0.5053 | |
| 1.07 | 0.08 | 2.3072 | -0.4667 | |
| 0.44 | 0.05 | 1.3807 | -0.4641 | |
| 1.28 | 0.08 | 2.2558 | -0.3733 | |
| 0.51 | 0.10 | 2.8579 | -0.3519 | |
| 1.03 | 0.10 | 3.1175 | -0.3460 | |
| 1.04 | 0.09 | 2.5976 | -0.3114 | |
| 0.13 | 0.06 | 1.8611 | -0.2727 |
Pengajuan 13D/G
Ini adalah daftar pengajuan 13D dan 13G yang dibuat dalam setahun terakhir (jika ada). Klik ikon tautan untuk melihat riwayat transaksi lengkap. Baris berwarna hijau menunjukkan posisi baru. Baris berwarna merah menunjukkan posisi yang sudah ditutup.
| Tanggal File | Formulir | Keamanan | Sebelumnya Saham |
Saat ini Saham |
ΔPersentase Saham | % Kepemilikan |
% ΔKepemilikan | |
|---|---|---|---|---|---|---|---|---|
| 2025-02-10 | PNTG / The Pennant Group, Inc. | 2,186,754 | 6.40 | |||||
| 2025-02-06 | CRNC / Cerence Inc. | 3,936,930 | 0 | -100.00 | 0.00 | -100.00 |
Pengajuan 13F dan Dana
Formulir ini diajukan pada 2025-08-12 untuk periode pelaporan 2025-06-30. Klik ikon tautan untuk melihat riwayat transaksi selengkapnya.
Tingkatkan ke versi premium untuk membuka data premium dan ekspor ke Excel. ![]() .
.
| Keamanan | Ketik | Harga Saham Rata-rata | Saham (MM) |
ΔSaham (%) |
ΔSaham (%) |
Nilai ($MM) |
Portpolyo (%) |
ΔPortofolio (%) |
|
|---|---|---|---|---|---|---|---|---|---|
| LAUR / Laureate Education, Inc. | 4.96 | -2.57 | 0.12 | 11.54 | 3.4544 | 0.1081 | |||
| ENSG / The Ensign Group, Inc. | 0.75 | -6.12 | 0.12 | 11.65 | 3.4486 | 0.1238 | |||
| VCTR / Victory Capital Holdings, Inc. | 1.78 | -0.94 | 0.11 | 8.65 | 3.3807 | 0.0338 | |||
| SNEX / StoneX Group Inc. | 1.20 | -15.03 | 0.11 | 1.87 | 3.2468 | -0.2083 | |||
| EEFT / Euronet Worldwide, Inc. | 1.03 | 2.36 | 0.10 | -2.80 | 3.1175 | -0.3460 | |||
| HLNE / Hamilton Lane Incorporated | 0.68 | 3.32 | 0.10 | -2.04 | 2.8808 | -0.2665 | |||
| LOPE / Grand Canyon Education, Inc. | 0.51 | -12.05 | 0.10 | -3.03 | 2.8579 | -0.3519 | |||
| AWI / Armstrong World Industries, Inc. | 0.55 | -9.08 | 0.09 | 4.71 | 2.6753 | -0.0783 | |||
| FSS / Federal Signal Corporation | 0.84 | -19.96 | 0.09 | 17.11 | 2.6506 | 0.1811 | |||
| MMS / Maximus, Inc. | 1.27 | -0.77 | 0.09 | 2.33 | 2.6442 | -0.1486 | |||
| SHAK / Shake Shack Inc. | 0.63 | -19.79 | 0.09 | 27.54 | 2.6367 | 0.4124 | |||
| ORA / Ormat Technologies, Inc. | 1.04 | -18.60 | 0.09 | -3.33 | 2.5976 | -0.3114 | |||
| IRDM / Iridium Communications Inc. | 2.86 | -0.77 | 0.09 | 10.26 | 2.5709 | 0.0395 | |||
| OZK / Bank OZK | 1.81 | -1.26 | 0.08 | 6.33 | 2.5291 | -0.0225 | |||
| PNTG / The Pennant Group, Inc. | 2.83 | -0.76 | 0.08 | 18.31 | 2.5124 | 0.2109 | |||
| CCCS / CCC Intelligent Solutions Holdings Inc. | 8.74 | 12.79 | 0.08 | 17.14 | 2.4487 | 0.2007 | |||
| PCTY / Paylocity Holding Corporation | 0.45 | -7.53 | 0.08 | -9.89 | 2.4469 | -0.5053 | |||
| PLNT / Planet Fitness, Inc. | 0.74 | -0.66 | 0.08 | 12.50 | 2.4140 | 0.0911 | |||
| NMIH / NMI Holdings, Inc. | 1.90 | -9.49 | 0.08 | 6.67 | 2.3879 | -0.0445 | |||
| IBP / Installed Building Products, Inc. | 0.44 | 3.28 | 0.08 | 8.22 | 2.3804 | 0.0157 | |||
| RLI / RLI Corp. | 1.07 | -0.18 | 0.08 | -10.47 | 2.3072 | -0.4667 | |||
| PRIM / Primoris Services Corporation | 0.98 | -7.17 | 0.08 | 26.67 | 2.2755 | 0.3273 | |||
| GMED / Globus Medical, Inc. | 1.28 | 14.82 | 0.08 | -7.41 | 2.2558 | -0.3733 | |||
| SGI / Somnigroup International Inc. | 1.11 | -4.12 | 0.08 | 8.70 | 2.2513 | 0.0219 | |||
| FIVN / Five9, Inc. | 2.85 | 32.90 | 0.08 | 29.31 | 2.2422 | 0.3757 | |||
| TTEK / Tetra Tech, Inc. | 2.06 | 83.86 | 0.07 | 131.25 | 2.2077 | 1.1539 | |||
| CRL / Charles River Laboratories International, Inc. | 0.49 | 8.92 | 0.07 | 8.96 | 2.1990 | 0.0379 | |||
| SPXC / SPX Technologies, Inc. | 0.44 | 19.15 | 0.07 | 55.32 | 2.1884 | 0.6664 | |||
| HLI / Houlihan Lokey, Inc. | 0.40 | -1.35 | 0.07 | 10.94 | 2.1230 | 0.0390 | |||
| GTLS / Chart Industries, Inc. | 0.42 | 10.88 | 0.07 | 25.93 | 2.0361 | 0.2990 | |||
| FCN / FTI Consulting, Inc. | 0.42 | -3.40 | 0.07 | -4.29 | 2.0006 | -0.2698 | |||
| ESAB / ESAB Corporation | 0.56 | 67.72 | 0.07 | 76.32 | 1.9979 | 0.7558 | |||
| PRVA / Privia Health Group, Inc. | 2.90 | 44.08 | 0.07 | 46.67 | 1.9860 | 0.5342 | |||
| WSC / WillScot Holdings Corporation | 2.41 | 20.96 | 0.07 | 20.00 | 1.9648 | 0.1865 | |||
| CHE / Chemed Corporation | 0.13 | 18.92 | 0.06 | -6.06 | 1.8611 | -0.2727 | |||
| FND / Floor & Decor Holdings, Inc. | 0.77 | 54.67 | 0.06 | 48.72 | 1.7321 | 0.4520 | |||
| YETI / YETI Holdings, Inc. | 1.80 | -0.79 | 0.06 | -6.67 | 1.6917 | -0.2404 | |||
| DV / DoubleVerify Holdings, Inc. | 3.64 | 4.52 | 0.05 | 17.39 | 1.6235 | 0.1266 | |||
| APG / APi Group Corporation | 0.91 | 2,785.76 | 0.05 | 4,500.00 | 1.3866 | 1.3502 | |||
| HQY / HealthEquity, Inc. | 0.44 | -31.88 | 0.05 | -19.30 | 1.3807 | -0.4641 | |||
| BLKB / Blackbaud, Inc. | 0.67 | 28.28 | 0.04 | 31.25 | 1.2796 | 0.2395 | |||
| GO / Grocery Outlet Holding Corp. | 3.21 | -18.62 | 0.04 | -29.09 | 1.1879 | -0.5848 | |||
| DOCN / DigitalOcean Holdings, Inc. | 1.18 | 20.93 | 0.03 | 3.13 | 0.9995 | -0.0431 | |||
| SLAB / Silicon Laboratories Inc. | 0.18 | -37.99 | 0.03 | -18.18 | 0.8073 | -0.2658 | |||
| ATS / ATS Corporation | 0.27 | 16.17 | 0.01 | 60.00 | 0.2551 | 0.0694 | |||
| ATAT / Atour Lifestyle Holdings Limited - Depositary Receipt (Common Stock) | 0.06 | 19.38 | 0.00 | 100.00 | 0.0596 | 0.0126 | |||
| PTC / PTC Inc. | 0.01 | 9.43 | 0.00 | 0.00 | 0.0469 | 0.0053 | |||
| ROAD / Construction Partners, Inc. | 0.01 | 1.45 | 0.00 | 0.0443 | 0.0124 | ||||
| EPAM / EPAM Systems, Inc. | 0.01 | 46.52 | 0.00 | 0.0431 | 0.0128 | ||||
| FA / First Advantage Corporation | 0.09 | -7.95 | 0.00 | 0.00 | 0.0421 | 0.0002 | |||
| DT / Dynatrace, Inc. | 0.02 | 0.00 | 0.00 | 0.00 | 0.0354 | 0.0028 | |||
| GLOB / Globant S.A. | 0.01 | 81.89 | 0.00 | 0.0337 | 0.0078 | ||||
| TECH / Bio-Techne Corporation | 0.02 | 36.46 | 0.00 | 0.0327 | 0.0032 | ||||
| YUMC / Yum China Holdings, Inc. | 0.02 | 6.72 | 0.00 | -100.00 | 0.0286 | -0.0050 | |||
| ENTG / Entegris, Inc. | 0.01 | 0.00 | 0.00 | 0.0257 | -0.0044 | ||||
| KLIC / Kulicke and Soffa Industries, Inc. | 0.02 | 17.99 | 0.00 | 0.0237 | 0.0030 | ||||
| VIPS / Vipshop Holdings Limited - Depositary Receipt (Common Stock) | 0.04 | 31.28 | 0.00 | 0.0175 | 0.0025 | ||||
| BC / Brunswick Corporation | 0.01 | -98.97 | 0.00 | -100.00 | 0.0165 | -1.6638 | |||
| GRAB / Grab Holdings Limited | 0.10 | -29.09 | 0.00 | 0.0149 | -0.0055 | ||||
| RDNT / RadNet, Inc. | 0.01 | 0.00 | 0.0098 | 0.0098 | |||||
| STVN / Stevanato Group S.p.A. | 0.00 | 0.00 | 0.00 | 0.0018 | 0.0002 | ||||
| SMIN / iShares Trust - iShares MSCI India Small-Cap ETF | 0.00 | 12.99 | 0.00 | 0.0009 | 0.0002 | ||||
| SCJ / iShares, Inc. - iShares MSCI Japan Small-Cap ETF | 0.00 | 0.00 | 0.0007 | 0.0007 | |||||
| THRM / Gentherm Incorporated | 0.00 | -100.00 | 0.00 | 0.0000 | |||||
| MCHI / iShares Trust - iShares MSCI China ETF | 0.00 | -100.00 | 0.00 | 0.0000 | -0.0009 |