Mga Batayang Estadistika
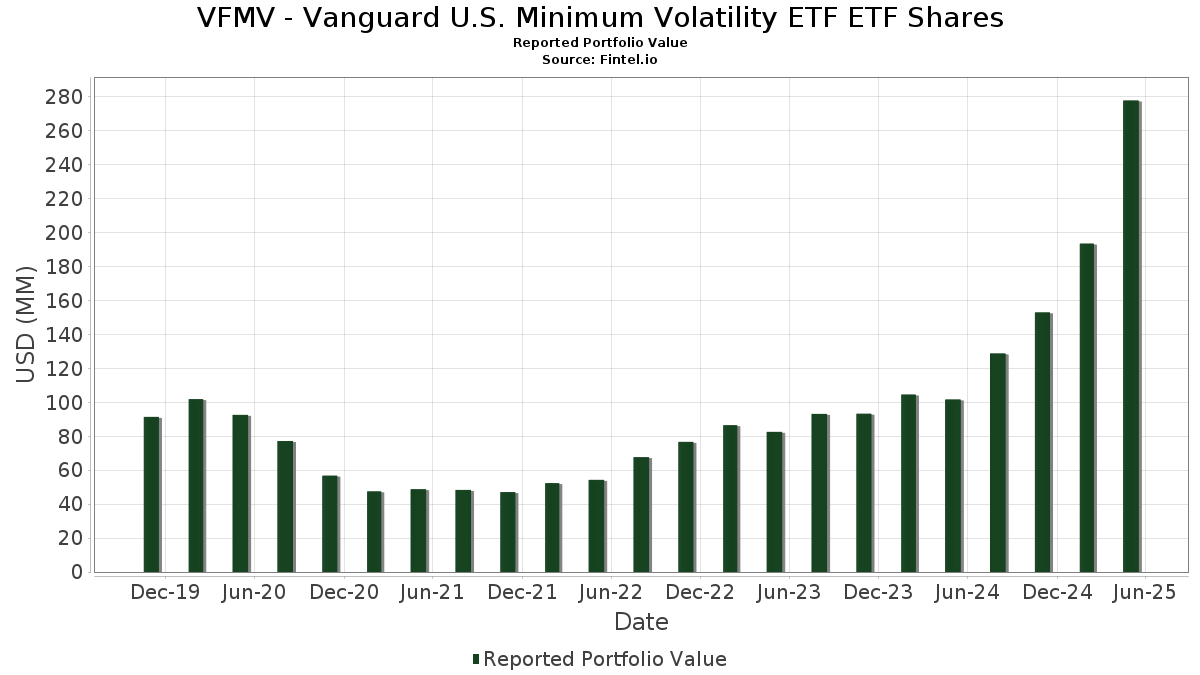
| Nilai Portofolio | $ 277,823,534 |
| Posisi Saat Ini | 187 |
Kepemilikan Terbaru, Kinerja, AUM (dari 13F, 13D)
VFMV - Vanguard U.S. Minimum Volatility ETF ETF Shares telah mengungkapkan total kepemilikan 187 dalam pengajuan SEC terbaru mereka. Nilai portofolio terbaru dihitung sebesar $ 277,823,534 USD. Aset yang Dikelola (AUM) sebenarnya adalah nilai ini ditambah kas (yang tidak diungkapkan). Aset-aset utama VFMV - Vanguard U.S. Minimum Volatility ETF ETF Shares adalah Box, Inc. (US:BOX) , Fresh Del Monte Produce Inc. (US:FDP) , Church & Dwight Co., Inc. (US:CHD) , Texas Instruments Incorporated (US:TXN) , and Verizon Communications Inc. (US:VZ) . Posisi baru VFMV - Vanguard U.S. Minimum Volatility ETF ETF Shares meliputi: LTC Properties, Inc. (US:LTC) , Four Corners Property Trust, Inc. (US:FCPT) , Yext, Inc. (US:YEXT) , STERIS plc (US:STE) , and The York Water Company (US:YORW) .
Peningkatan Tertinggi Kuartal Ini
Kami menggunakan perubahan dalam alokasi portofolio karena ini adalah metrik yang paling bermakna. Perubahan dapat disebabkan oleh perdagangan atau perubahan harga saham.
| Keamanan | Saham (MM) |
Nilai (Juta Dolar AS) |
Portfolio % | ΔPorsyento ng Portfolio |
|---|---|---|---|---|
| 0.12 | 4.14 | 1.4880 | 1.4880 | |
| 0.12 | 4.33 | 1.5574 | 1.1242 | |
| 0.11 | 3.07 | 1.1022 | 1.1022 | |
| 0.20 | 3.83 | 1.3764 | 1.0713 | |
| 0.05 | 3.00 | 1.0787 | 0.9984 | |
| 0.01 | 3.71 | 1.3347 | 0.9978 | |
| 0.11 | 3.13 | 1.1246 | 0.9039 | |
| 0.03 | 2.49 | 0.8947 | 0.8945 | |
| 0.03 | 2.75 | 0.9875 | 0.8345 | |
| 0.05 | 3.88 | 1.3948 | 0.8008 |
Penurunan Tertinggi Kuartal Ini
Kami menggunakan perubahan dalam alokasi portofolio karena ini adalah metrik yang paling bermakna. Perubahan dapat disebabkan oleh perdagangan atau perubahan harga saham.
| Keamanan | Saham (MM) |
Nilai (Juta Dolar AS) |
Portfolio % | ΔPorsyento ng Portfolio |
|---|---|---|---|---|
| 0.01 | 1.44 | 0.5178 | -1.0759 | |
| 0.01 | 0.29 | 0.1043 | -1.0424 | |
| 0.02 | 1.48 | 0.5330 | -1.0194 | |
| 0.01 | 2.14 | 0.7700 | -0.5367 | |
| 0.01 | 1.75 | 0.6280 | -0.5009 | |
| 0.00 | 0.49 | 0.1753 | -0.4762 | |
| 0.05 | 2.91 | 1.0456 | -0.4735 | |
| 0.01 | 1.70 | 0.6091 | -0.4146 | |
| 0.01 | 1.23 | 0.4425 | -0.4126 | |
| 0.03 | 2.98 | 1.0710 | -0.4047 |
Pengajuan 13F dan Dana
Formulir ini diajukan pada 2025-07-29 untuk periode pelaporan 2025-05-31. Klik ikon tautan untuk melihat riwayat transaksi selengkapnya.
Tingkatkan ke versi premium untuk membuka data premium dan ekspor ke Excel. ![]() .
.
| Keamanan | Ketik | Harga Saham Rata-rata | Saham (MM) |
ΔSaham (%) |
ΔSaham (%) |
Nilai ($MM) |
Portpolyo (%) |
ΔPortofolio (%) |
|
|---|---|---|---|---|---|---|---|---|---|
| BOX / Box, Inc. | 0.13 | 48.68 | 4.98 | 71.96 | 1.7895 | 0.2952 | |||
| FDP / Fresh Del Monte Produce Inc. | 0.12 | 345.62 | 4.33 | 416.57 | 1.5574 | 1.1242 | |||
| CHD / Church & Dwight Co., Inc. | 0.04 | 64.35 | 4.26 | 45.28 | 1.5323 | 0.0180 | |||
| TXN / Texas Instruments Incorporated | 0.02 | 53.05 | 4.23 | 42.81 | 1.5210 | -0.0086 | |||
| VZ / Verizon Communications Inc. | 0.09 | 86.30 | 4.17 | 90.02 | 1.4987 | 0.3661 | |||
| CME / CME Group Inc. | 0.01 | 24.02 | 4.17 | 41.25 | 1.4972 | -0.0249 | |||
| LTC / LTC Properties, Inc. | 0.12 | 4.14 | 1.4880 | 1.4880 | |||||
| TYL / Tyler Technologies, Inc. | 0.01 | 53.39 | 4.14 | 45.48 | 1.4872 | 0.0191 | |||
| T / AT&T Inc. | 0.15 | 28.29 | 4.04 | 30.14 | 1.4523 | -0.1504 | |||
| YELP / Yelp Inc. | 0.11 | 110.23 | 4.02 | 133.84 | 1.4429 | 0.5570 | |||
| ROP / Roper Technologies, Inc. | 0.01 | 40.45 | 4.02 | 37.03 | 1.4426 | -0.0690 | |||
| DOX / Amdocs Limited | 0.04 | 40.05 | 3.96 | 47.31 | 1.4243 | 0.0357 | |||
| O / Realty Income Corporation | 0.07 | 44.46 | 3.90 | 43.44 | 1.4014 | -0.0016 | |||
| DLB / Dolby Laboratories, Inc. | 0.05 | 270.57 | 3.88 | 237.27 | 1.3948 | 0.8008 | |||
| CBOE / Cboe Global Markets, Inc. | 0.02 | 20.37 | 3.87 | 30.84 | 1.3915 | -0.1357 | |||
| INVA / Innoviva, Inc. | 0.20 | 493.30 | 3.83 | 548.05 | 1.3764 | 1.0713 | |||
| COR / Cencora, Inc. | 0.01 | 44.42 | 3.82 | 65.87 | 1.3728 | 0.1845 | |||
| JNJ / Johnson & Johnson | 0.02 | 37.83 | 3.76 | 29.67 | 1.3520 | -0.1455 | |||
| PG / The Procter & Gamble Company | 0.02 | 31.56 | 3.74 | 28.56 | 1.3426 | -0.1569 | |||
| ABT / Abbott Laboratories | 0.03 | 26.57 | 3.72 | 22.49 | 1.3350 | -0.2297 | |||
| ADP / Automatic Data Processing, Inc. | 0.01 | 450.77 | 3.71 | 468.76 | 1.3347 | 0.9978 | |||
| CSCO / Cisco Systems, Inc. | 0.06 | 81.72 | 3.65 | 78.65 | 1.3110 | 0.2574 | |||
| EBAY / eBay Inc. | 0.05 | 78.96 | 3.63 | 102.29 | 1.3033 | 0.3781 | |||
| RSG / Republic Services, Inc. | 0.01 | 66.94 | 3.55 | 81.24 | 1.2739 | 0.2645 | |||
| ADI / Analog Devices, Inc. | 0.02 | 23.18 | 3.51 | 14.56 | 1.2608 | -0.3194 | |||
| MCK / McKesson Corporation | 0.00 | 35.43 | 3.50 | 52.22 | 1.2590 | 0.0711 | |||
| RPRX / Royalty Pharma plc | 0.10 | 21.09 | 3.44 | 18.35 | 1.2356 | -0.2635 | |||
| AAPL / Apple Inc. | 0.02 | 44.51 | 3.33 | 20.02 | 1.1977 | -0.2353 | |||
| MRK / Merck & Co., Inc. | 0.04 | 42.27 | 3.22 | 18.54 | 1.1580 | -0.2451 | |||
| XOM / Exxon Mobil Corporation | 0.03 | 18.34 | 3.19 | 8.73 | 1.1457 | -0.3672 | |||
| TMUS / T-Mobile US, Inc. | 0.01 | 21.94 | 3.14 | 9.51 | 1.1294 | -0.3515 | |||
| TJX / The TJX Companies, Inc. | 0.02 | 48.43 | 3.14 | 51.01 | 1.1288 | 0.0552 | |||
| GTY / Getty Realty Corp. | 0.11 | 685.16 | 3.13 | 633.02 | 1.1246 | 0.9039 | |||
| FCPT / Four Corners Property Trust, Inc. | 0.11 | 3.07 | 1.1022 | 1.1022 | |||||
| CVX / Chevron Corporation | 0.02 | 40.56 | 3.01 | 21.14 | 1.0829 | -0.2008 | |||
| MO / Altria Group, Inc. | 0.05 | 1,679.20 | 3.00 | 1,836.77 | 1.0787 | 0.9984 | |||
| SO / The Southern Company | 0.03 | 3.97 | 2.98 | 4.20 | 1.0710 | -0.4047 | |||
| GIS / General Mills, Inc. | 0.05 | 10.42 | 2.91 | -1.15 | 1.0456 | -0.4735 | |||
| AEP / American Electric Power Company, Inc. | 0.03 | 849.86 | 2.75 | 828.38 | 0.9875 | 0.8345 | |||
| JKHY / Jack Henry & Associates, Inc. | 0.02 | 443.48 | 2.75 | 467.56 | 0.9870 | 0.7371 | |||
| WTW / Willis Towers Watson Public Limited Company | 0.01 | 70.86 | 2.73 | 59.25 | 0.9804 | 0.0963 | |||
| ED / Consolidated Edison, Inc. | 0.03 | 11.05 | 2.68 | 14.29 | 0.9627 | -0.2468 | |||
| HPQ / HP Inc. | 0.11 | 112.79 | 2.63 | 71.72 | 0.9447 | 0.1544 | |||
| FOX / Fox Corporation | 0.05 | 11.91 | 2.58 | 4.07 | 0.9285 | -0.3527 | |||
| AWR / American States Water Company | 0.03 | 1,578,650.00 | 2.49 | 0.8947 | 0.8945 | ||||
| IBM / International Business Machines Corporation | 0.01 | 0.00 | 2.46 | 2.63 | 0.8827 | -0.3524 | |||
| SWKS / Skyworks Solutions, Inc. | 0.03 | 45.35 | 2.39 | 50.54 | 0.8587 | 0.0395 | |||
| CAH / Cardinal Health, Inc. | 0.02 | 61.65 | 2.39 | 92.82 | 0.8586 | 0.2192 | |||
| PGR / The Progressive Corporation | 0.01 | 0.00 | 2.29 | 1.01 | 0.8238 | -0.3469 | |||
| ADC / Agree Realty Corporation | 0.03 | 3.01 | 2.27 | 5.10 | 0.8150 | -0.2984 | |||
| IDCC / InterDigital, Inc. | 0.01 | 0.00 | 2.25 | 1.67 | 0.8073 | -0.3326 | |||
| IDT / IDT Corporation | 0.04 | 1.26 | 2.20 | 28.42 | 0.7892 | -0.0932 | |||
| MMC / Marsh & McLennan Companies, Inc. | 0.01 | -13.87 | 2.14 | -15.36 | 0.7700 | -0.5367 | |||
| NOC / Northrop Grumman Corporation | 0.00 | 35.58 | 2.13 | 42.34 | 0.7646 | -0.0067 | |||
| BDX / Becton, Dickinson and Company | 0.01 | 106.50 | 2.12 | 58.00 | 0.7625 | 0.0696 | |||
| CPNG / Coupang, Inc. | 0.08 | 153.90 | 2.10 | 200.57 | 0.7562 | 0.3948 | |||
| AMSF / AMERISAFE, Inc. | 0.04 | 610.97 | 2.02 | 574.67 | 0.7274 | 0.4933 | |||
| MATX / Matson, Inc. | 0.02 | 300.60 | 1.97 | 214.01 | 0.7087 | 0.3844 | |||
| ORLY / O'Reilly Automotive, Inc. | 0.00 | 0.00 | 1.85 | -0.43 | 0.6653 | -0.2943 | |||
| LRN / Stride, Inc. | 0.01 | -11.92 | 1.76 | -2.54 | 0.6340 | -0.2999 | |||
| RTX / RTX Corporation | 0.01 | -22.17 | 1.75 | -20.16 | 0.6280 | -0.5009 | |||
| YEXT / Yext, Inc. | 0.26 | 1.73 | 0.6224 | 0.6224 | |||||
| DUK / Duke Energy Corporation | 0.01 | -14.73 | 1.70 | -14.57 | 0.6091 | -0.4146 | |||
| WMT / Walmart Inc. | 0.02 | -3.63 | 1.67 | -3.57 | 0.6018 | -0.2939 | |||
| HCKT / The Hackett Group, Inc. | 0.07 | 793.31 | 1.65 | 623.25 | 0.5927 | 0.4746 | |||
| MSI / Motorola Solutions, Inc. | 0.00 | 60.20 | 1.62 | 51.07 | 0.5838 | 0.0292 | |||
| MDLZ / Mondelez International, Inc. | 0.02 | 166.17 | 1.62 | 179.66 | 0.5830 | 0.2837 | |||
| SPOT / Spotify Technology S.A. | 0.00 | -3.99 | 1.60 | 5.05 | 0.5755 | -0.2113 | |||
| STE / STERIS plc | 0.01 | 1.59 | 0.5709 | 0.5709 | |||||
| TKO / TKO Group Holdings, Inc. | 0.01 | -3.71 | 1.58 | 0.89 | 0.5682 | -0.2406 | |||
| ROL / Rollins, Inc. | 0.03 | 798.00 | 1.54 | 921.85 | 0.5545 | 0.4559 | |||
| CCCS / CCC Intelligent Solutions Holdings Inc. | 0.17 | 274.77 | 1.51 | 223.34 | 0.5429 | 0.3015 | |||
| FSLR / First Solar, Inc. | 0.01 | 74.01 | 1.50 | 102.02 | 0.5396 | 0.1560 | |||
| KO / The Coca-Cola Company | 0.02 | -51.30 | 1.48 | -50.71 | 0.5330 | -1.0194 | |||
| WM / Waste Management, Inc. | 0.01 | -13.80 | 1.47 | -10.75 | 0.5283 | -0.3218 | |||
| EXPD / Expeditors International of Washington, Inc. | 0.01 | 107.01 | 1.44 | 91.88 | 0.5178 | -1.0759 | |||
| EOG / EOG Resources, Inc. | 0.01 | 65.16 | 1.43 | 41.29 | 0.5130 | -0.0085 | |||
| MUSA / Murphy USA Inc. | 0.00 | 0.00 | 1.36 | -9.05 | 0.4876 | -0.2822 | |||
| NABL / N-able, Inc. | 0.16 | 66.01 | 1.27 | 28.96 | 0.4563 | -0.0519 | |||
| DIS / The Walt Disney Company | 0.01 | 5.77 | 1.27 | 5.06 | 0.4554 | -0.1670 | |||
| CRUS / Cirrus Logic, Inc. | 0.01 | 78.10 | 1.24 | 68.02 | 0.4458 | 0.0650 | |||
| CVLT / Commvault Systems, Inc. | 0.01 | -23.11 | 1.24 | -17.46 | 0.4454 | -0.3293 | |||
| BSX / Boston Scientific Corporation | 0.01 | -26.73 | 1.23 | -25.71 | 0.4425 | -0.4126 | |||
| MGEE / MGE Energy, Inc. | 0.01 | 0.00 | 1.22 | -1.53 | 0.4387 | -0.2014 | |||
| GILD / Gilead Sciences, Inc. | 0.01 | -19.61 | 1.21 | -22.58 | 0.4348 | -0.3717 | |||
| LMT / Lockheed Martin Corporation | 0.00 | -26.63 | 1.21 | -21.40 | 0.4331 | -0.3583 | |||
| BATRK / Atlanta Braves Holdings, Inc. | 0.03 | 516.54 | 1.18 | 521.05 | 0.4242 | 0.3260 | |||
| CMS / CMS Energy Corporation | 0.02 | 118.96 | 1.17 | 110.81 | 0.4204 | 0.1336 | |||
| YORW / The York Water Company | 0.04 | 1.15 | 0.4119 | 0.4119 | |||||
| PLAB / Photronics, Inc. | 0.07 | 1.14 | 0.4092 | 0.4092 | |||||
| FIZZ / National Beverage Corp. | 0.03 | 1.14 | 0.4088 | 0.4088 | |||||
| BRK.B / Berkshire Hathaway Inc. | 0.00 | 13.06 | 1.13 | 10.85 | 0.4076 | -0.1202 | |||
| MCD / McDonald's Corporation | 0.00 | -28.16 | 1.13 | -26.91 | 0.4053 | -0.3906 | |||
| AVGO / Broadcom Inc. | 0.00 | 0.00 | 1.13 | 21.36 | 0.4044 | -0.0740 | |||
| WEC / WEC Energy Group, Inc. | 0.01 | 4.53 | 1.09 | 5.22 | 0.3912 | -0.1424 | |||
| NTAP / NetApp, Inc. | 0.01 | -29.80 | 0.99 | -30.28 | 0.3552 | -0.3761 | |||
| CL / Colgate-Palmolive Company | 0.01 | -27.40 | 0.94 | -25.98 | 0.3390 | -0.3187 | |||
| CBSH / Commerce Bancshares, Inc. | 0.01 | 0.00 | 0.93 | -3.23 | 0.3338 | -0.1610 | |||
| SPNS / Sapiens International Corporation N.V. | 0.03 | 492.43 | 0.91 | 518.37 | 0.3268 | 0.2507 | |||
| ABBV / AbbVie Inc. | 0.00 | -6.28 | 0.91 | -16.59 | 0.3254 | -0.2345 | |||
| GOOGL / Alphabet Inc. | 0.01 | -9.48 | 0.89 | -8.72 | 0.3200 | -0.1833 | |||
| MCS / The Marcus Corporation | 0.05 | 0.00 | 0.88 | 0.80 | 0.3155 | -0.1341 | |||
| LHX / L3Harris Technologies, Inc. | 0.00 | 0.87 | 0.3139 | 0.3139 | |||||
| COP / ConocoPhillips | 0.01 | 0.86 | 0.3075 | 0.3075 | |||||
| SPOK / Spok Holdings, Inc. | 0.05 | 274.30 | 0.82 | 261.23 | 0.2946 | 0.1771 | |||
| NVEC / NVE Corporation | 0.01 | 18.80 | 0.81 | 22.76 | 0.2909 | -0.0493 | |||
| PM / Philip Morris International Inc. | 0.00 | 0.00 | 0.81 | 16.26 | 0.2906 | -0.0682 | |||
| HSTM / HealthStream, Inc. | 0.03 | -13.62 | 0.81 | -28.36 | 0.2899 | -0.2909 | |||
| EA / Electronic Arts Inc. | 0.01 | -35.34 | 0.81 | -28.00 | 0.2893 | -0.2877 | |||
| WTM / White Mountains Insurance Group, Ltd. | 0.00 | 0.00 | 0.78 | -3.58 | 0.2809 | -0.1371 | |||
| CB / Chubb Limited | 0.00 | 654.76 | 0.78 | 685.86 | 0.2797 | 0.2286 | |||
| MTSI / MACOM Technology Solutions Holdings, Inc. | 0.01 | 0.00 | 0.78 | 5.14 | 0.2796 | -0.1023 | |||
| MLNK / MeridianLink, Inc. | 0.04 | 0.74 | 0.2659 | 0.2659 | |||||
| GDDY / GoDaddy Inc. | 0.00 | 0.00 | 0.74 | 1.38 | 0.2647 | -0.1099 | |||
| GOOG / Alphabet Inc. | 0.00 | -24.62 | 0.73 | -24.35 | 0.2615 | -0.2348 | |||
| META / Meta Platforms, Inc. | 0.00 | -2.29 | 0.72 | -5.40 | 0.2582 | -0.1334 | |||
| BMRN / BioMarin Pharmaceutical Inc. | 0.01 | 0.72 | 0.2577 | 0.2577 | |||||
| BMY / Bristol-Myers Squibb Company | 0.01 | 35.98 | 0.68 | 10.10 | 0.2431 | -0.0739 | |||
| EBF / Ennis, Inc. | 0.04 | 209.20 | 0.67 | 141.37 | 0.2414 | 0.0247 | |||
| V / Visa Inc. | 0.00 | 0.00 | 0.64 | 0.63 | 0.2303 | -0.0981 | |||
| CHE / Chemed Corporation | 0.00 | -26.27 | 0.62 | -29.41 | 0.2243 | -0.2323 | |||
| PBH / Prestige Consumer Healthcare Inc. | 0.01 | -8.87 | 0.62 | -7.89 | 0.2227 | -0.1244 | |||
| TRV / The Travelers Companies, Inc. | 0.00 | 0.00 | 0.61 | 6.61 | 0.2204 | -0.0763 | |||
| IIIV / i3 Verticals, Inc. | 0.02 | 0.61 | 0.2182 | 0.2182 | |||||
| WMB / The Williams Companies, Inc. | 0.01 | -9.78 | 0.61 | -6.20 | 0.2175 | -0.1153 | |||
| AJG / Arthur J. Gallagher & Co. | 0.00 | 0.00 | 0.60 | 2.90 | 0.2170 | -0.0859 | |||
| PSTL / Postal Realty Trust, Inc. | 0.04 | 0.56 | 0.2023 | 0.2023 | |||||
| AZO / AutoZone, Inc. | 0.00 | 0.00 | 0.56 | 6.88 | 0.2012 | -0.0691 | |||
| EVRG / Evergy, Inc. | 0.01 | 0.54 | 0.1932 | 0.1932 | |||||
| CSV / Carriage Services, Inc. | 0.01 | 122.50 | 0.51 | 358.56 | 0.1830 | 0.0733 | |||
| MSFT / Microsoft Corporation | 0.00 | -66.68 | 0.49 | -61.41 | 0.1753 | -0.4762 | |||
| BLKB / Blackbaud, Inc. | 0.01 | -14.78 | 0.48 | -19.87 | 0.1728 | -0.1365 | |||
| Vanguard Market Liquidity Fund / STIV (N/A) | 0.47 | 0.47 | 0.1703 | 0.1703 | |||||
| QRVO / Qorvo, Inc. | 0.01 | 99.04 | 0.46 | 108.18 | 0.1649 | 0.0511 | |||
| ENPH / Enphase Energy, Inc. | 0.01 | 0.46 | 0.1639 | 0.1639 | |||||
| RLI / RLI Corp. | 0.01 | 0.00 | 0.41 | 0.98 | 0.1485 | -0.0626 | |||
| MA / Mastercard Incorporated | 0.00 | 165.28 | 0.41 | 170.39 | 0.1479 | 0.0691 | |||
| EXEL / Exelixis, Inc. | 0.01 | -15.27 | 0.40 | -5.66 | 0.1438 | -0.0753 | |||
| UVV / Universal Corporation | 0.01 | 47.11 | 0.39 | 100.52 | 0.1398 | -0.0448 | |||
| KLAC / KLA Corporation | 0.00 | 90.79 | 0.35 | 104.14 | 0.1240 | 0.0366 | |||
| DGICA / Donegal Group Inc. | 0.02 | 266.81 | 0.34 | 325.00 | 0.1223 | 0.0809 | |||
| JJSF / J&J Snack Foods Corp. | 0.00 | 168.25 | 0.33 | 77.42 | 0.1189 | -0.0026 | |||
| FWONA / Formula One Group | 0.00 | -50.41 | 0.32 | -50.99 | 0.1163 | -0.2242 | |||
| LOPE / Grand Canyon Education, Inc. | 0.00 | 0.00 | 0.32 | 9.90 | 0.1159 | -0.0354 | |||
| PPC / Pilgrim's Pride Corporation | 0.01 | 0.00 | 0.32 | -9.60 | 0.1153 | -0.0679 | |||
| DGX / Quest Diagnostics Incorporated | 0.00 | 0.31 | 0.1125 | 0.1125 | |||||
| AEE / Ameren Corporation | 0.00 | 0.00 | 0.30 | -4.82 | 0.1067 | -0.0539 | |||
| KMI / Kinder Morgan, Inc. | 0.01 | -87.38 | 0.29 | -86.95 | 0.1043 | -1.0424 | |||
| SFD / Smithfield Foods, Inc. | 0.01 | 0.29 | 0.1032 | 0.1032 | |||||
| DTM / DT Midstream, Inc. | 0.00 | -65.72 | 0.26 | -62.72 | 0.0919 | -0.2614 | |||
| AWK / American Water Works Company, Inc. | 0.00 | 0.25 | 0.0908 | 0.0908 | |||||
| SAFT / Safety Insurance Group, Inc. | 0.00 | -16.42 | 0.25 | -10.07 | 0.0902 | -0.0534 | |||
| ACN / Accenture plc | 0.00 | 0.00 | 0.25 | -9.12 | 0.0898 | -0.0520 | |||
| ORRF / Orrstown Financial Services, Inc. | 0.01 | 100.72 | 0.24 | 80.00 | 0.0876 | 0.0178 | |||
| DBD / Diebold Nixdorf, Incorporated | 0.00 | 0.24 | 0.0847 | 0.0847 | |||||
| MTCH / Match Group, Inc. | 0.01 | -38.66 | 0.23 | -42.31 | 0.0812 | -0.1201 | |||
| QCOM / QUALCOMM Incorporated | 0.00 | 0.00 | 0.22 | -7.85 | 0.0803 | -0.0445 | |||
| EIG / Employers Holdings, Inc. | 0.00 | 396.53 | 0.22 | 372.34 | 0.0800 | 0.0554 | |||
| TSN / Tyson Foods, Inc. | 0.00 | 0.21 | 0.0770 | 0.0770 | |||||
| TW / Tradeweb Markets Inc. | 0.00 | 0.00 | 0.20 | 6.88 | 0.0728 | -0.0252 | |||
| BATRA / Atlanta Braves Holdings, Inc. | 0.00 | 90.17 | 0.20 | 88.68 | 0.0719 | 0.0168 | |||
| LAUR / Laureate Education, Inc. | 0.01 | 0.00 | 0.20 | 13.07 | 0.0715 | -0.0195 | |||
| QNST / QuinStreet, Inc. | 0.01 | 0.00 | 0.18 | -22.41 | 0.0650 | -0.0547 | |||
| GNK / Genco Shipping & Trading Limited | 0.01 | 0.18 | 0.0642 | 0.0642 | |||||
| GRND / Grindr Inc. | 0.01 | 0.00 | 0.17 | 32.82 | 0.0627 | -0.0050 | |||
| IDA / IDACORP, Inc. | 0.00 | 0.17 | 0.0618 | 0.0618 | |||||
| GABC / German American Bancorp, Inc. | 0.00 | 0.16 | 0.0576 | 0.0576 | |||||
| OLLI / Ollie's Bargain Outlet Holdings, Inc. | 0.00 | 0.00 | 0.14 | 7.81 | 0.0497 | -0.0166 | |||
| TFSL / TFS Financial Corporation | 0.01 | 85.43 | 0.13 | 86.96 | 0.0464 | 0.0105 | |||
| THFF / First Financial Corporation | 0.00 | 0.00 | 0.13 | 0.79 | 0.0457 | -0.0198 | |||
| NVR / NVR, Inc. | 0.00 | 0.12 | 0.0435 | 0.0435 | |||||
| UNM / Unum Group | 0.00 | 0.00 | 0.11 | -0.94 | 0.0379 | -0.0169 | |||
| JPM / JPMorgan Chase & Co. | 0.00 | 0.00 | 0.08 | 0.00 | 0.0295 | -0.0130 | |||
| VECO / Veeco Instruments Inc. | 0.00 | 0.00 | 0.07 | -13.25 | 0.0262 | -0.0171 | |||
| AME / AMETEK, Inc. | 0.00 | 0.07 | 0.0247 | 0.0247 | |||||
| MKTX / MarketAxess Holdings Inc. | 0.00 | 0.07 | 0.0246 | 0.0246 | |||||
| BRO / Brown & Brown, Inc. | 0.00 | 0.06 | 0.0220 | 0.0220 | |||||
| GD / General Dynamics Corporation | 0.00 | 0.00 | 0.06 | 9.09 | 0.0218 | -0.0066 | |||
| PEBK / Peoples Bancorp of North Carolina, Inc. | 0.00 | 0.00 | 0.06 | 5.36 | 0.0212 | -0.0080 | |||
| MKC / McCormick & Company, Incorporated | 0.00 | 0.06 | 0.0207 | 0.0207 | |||||
| CNA / CNA Financial Corporation | 0.00 | 0.00 | 0.05 | -2.00 | 0.0176 | -0.0082 | |||
| BCAL / California BanCorp. | 0.00 | 0.00 | 0.04 | -6.67 | 0.0153 | -0.0082 | |||
| S&P500 EMINI FUT Jun25 / DE (N/A) | 0.04 | 0.0147 | 0.0147 | ||||||
| UNH / UnitedHealth Group Incorporated | 0.00 | 0.00 | 0.02 | -36.84 | 0.0089 | -0.0112 | |||
| SP500 MIC EMIN FUTJun25 / DE (N/A) | 0.02 | 0.0065 | 0.0065 | ||||||
| FFNW / First Financial Northwest, Inc. | 0.00 | 0.00 | 0.00 | -100.00 | 0.0003 | -0.0151 | |||
| Vanguard Market Liquidity Fund / STIV (N/A) | 0.00 | 0.00 | 0.0001 | 0.0001 | |||||
| PRGS / Progress Software Corporation | 0.00 | -100.00 | 0.00 | -100.00 | -0.0598 | ||||
| FOXA / Fox Corporation | 0.00 | -100.00 | 0.00 | -100.00 | -0.0577 | ||||
| FWONK / Formula One Group | 0.00 | -100.00 | 0.00 | -100.00 | -0.0890 |