Mga Batayang Estadistika
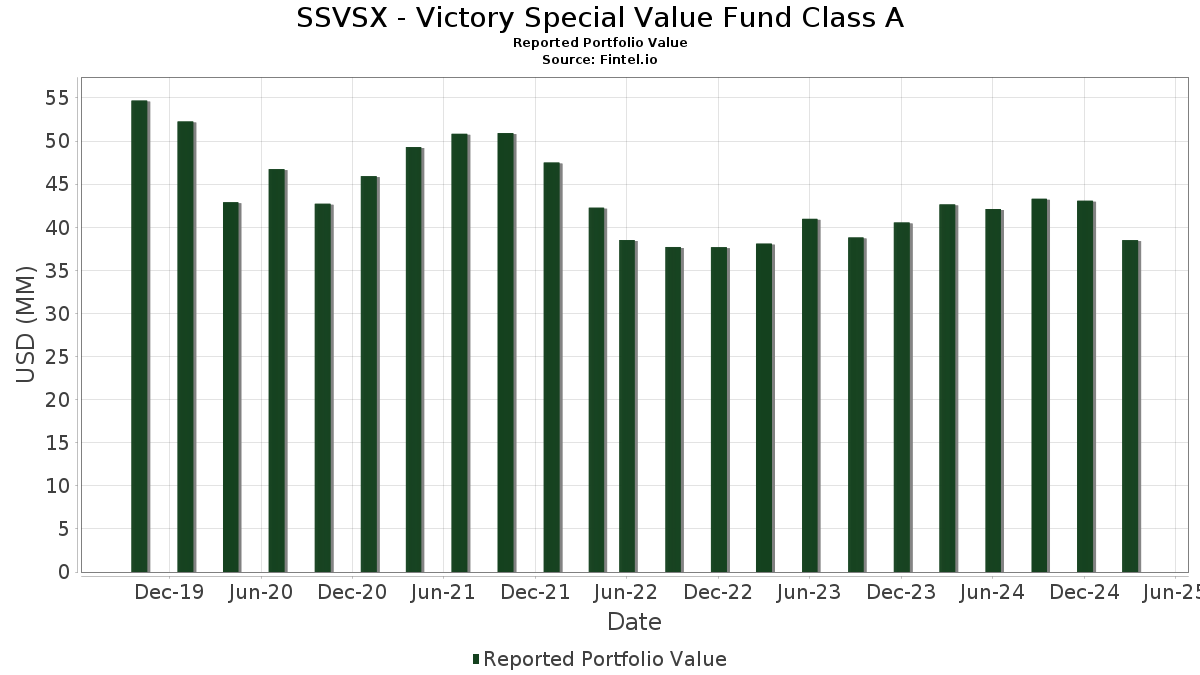
| Nilai Portofolio | $ 38,504,503 |
| Posisi Saat Ini | 74 |
Kepemilikan Terbaru, Kinerja, AUM (dari 13F, 13D)
SSVSX - Victory Special Value Fund Class A telah mengungkapkan total kepemilikan 74 dalam pengajuan SEC terbaru mereka. Nilai portofolio terbaru dihitung sebesar $ 38,504,503 USD. Aset yang Dikelola (AUM) sebenarnya adalah nilai ini ditambah kas (yang tidak diungkapkan). Aset-aset utama SSVSX - Victory Special Value Fund Class A adalah Apple Inc. (US:AAPL) , Microsoft Corporation (US:MSFT) , NVIDIA Corporation (US:NVDA) , Alphabet Inc. (US:GOOG) , and Amazon.com, Inc. (US:AMZN) . Posisi baru SSVSX - Victory Special Value Fund Class A meliputi: Raymond James Financial, Inc. (US:RJF) , Tencent Music Entertainment Group - Depositary Receipt (Common Stock) (US:TME) , Ingredion Incorporated (US:INGR) , eBay Inc. (US:EBAY) , and Expedia Group, Inc. (US:EXPE) .
Peningkatan Tertinggi Kuartal Ini
Kami menggunakan perubahan dalam alokasi portofolio karena ini adalah metrik yang paling bermakna. Perubahan dapat disebabkan oleh perdagangan atau perubahan harga saham.
| Keamanan | Saham (MM) |
Nilai (Juta Dolar AS) |
Portfolio % | ΔPorsyento ng Portfolio |
|---|---|---|---|---|
| 0.01 | 0.55 | 1.4074 | 1.4074 | |
| 0.00 | 0.51 | 1.3160 | 1.3160 | |
| 0.03 | 0.47 | 1.2091 | 1.2091 | |
| 0.00 | 0.66 | 1.7045 | 1.1191 | |
| 0.00 | 0.43 | 1.1165 | 1.1165 | |
| 0.01 | 0.42 | 1.0888 | 1.0888 | |
| 0.00 | 0.69 | 1.7584 | 1.0649 | |
| 0.00 | 0.40 | 1.0390 | 1.0390 | |
| 0.01 | 0.63 | 1.6233 | 1.0209 | |
| 0.00 | 1.08 | 2.7750 | 1.0205 |
Penurunan Tertinggi Kuartal Ini
Kami menggunakan perubahan dalam alokasi portofolio karena ini adalah metrik yang paling bermakna. Perubahan dapat disebabkan oleh perdagangan atau perubahan harga saham.
| Keamanan | Saham (MM) |
Nilai (Juta Dolar AS) |
Portfolio % | ΔPorsyento ng Portfolio |
|---|---|---|---|---|
| 0.02 | 1.73 | 4.4357 | -1.2598 | |
| 0.00 | 0.96 | 2.4602 | -1.2133 | |
| 0.01 | 1.28 | 3.2939 | -1.1044 | |
| 0.00 | 0.25 | 0.6463 | -1.0300 | |
| 0.00 | 0.51 | 1.2980 | -0.6873 | |
| 0.00 | 0.25 | 0.6485 | -0.6770 | |
| 0.01 | 1.32 | 3.3977 | -0.6347 | |
| 0.01 | 2.89 | 7.4188 | -0.5759 | |
| 0.00 | 0.61 | 1.5591 | -0.5426 | |
| 0.00 | 0.34 | 0.8739 | -0.4618 |
Pengajuan 13F dan Dana
Formulir ini diajukan pada 2025-05-29 untuk periode pelaporan 2025-03-31. Klik ikon tautan untuk melihat riwayat transaksi selengkapnya.
Tingkatkan ke versi premium untuk membuka data premium dan ekspor ke Excel. ![]() .
.
| Keamanan | Ketik | Harga Saham Rata-rata | Saham (MM) |
ΔSaham (%) |
ΔSaham (%) |
Nilai ($MM) |
Portpolyo (%) |
ΔPortofolio (%) |
|
|---|---|---|---|---|---|---|---|---|---|
| AAPL / Apple Inc. | 0.01 | -7.65 | 2.89 | -18.08 | 7.4188 | -0.5759 | |||
| MSFT / Microsoft Corporation | 0.01 | -6.58 | 2.17 | -16.79 | 5.5712 | -0.3396 | |||
| NVDA / NVIDIA Corporation | 0.02 | -14.81 | 1.73 | -31.24 | 4.4357 | -1.2598 | |||
| GOOG / Alphabet Inc. | 0.01 | -9.33 | 1.32 | -25.63 | 3.3977 | -0.6347 | |||
| AMZN / Amazon.com, Inc. | 0.01 | -23.77 | 1.28 | -33.90 | 3.2939 | -1.1044 | |||
| LLY / Eli Lilly and Company | 0.00 | 30.51 | 1.08 | 39.66 | 2.7750 | 1.0205 | |||
| META / Meta Platforms, Inc. | 0.00 | -39.94 | 0.96 | -40.90 | 2.4602 | -1.2133 | |||
| V / Visa Inc. | 0.00 | -9.32 | 0.81 | 0.62 | 2.0744 | 0.2533 | |||
| VRTX / Vertex Pharmaceuticals Incorporated | 0.00 | 85.92 | 0.69 | 123.86 | 1.7584 | 1.0649 | |||
| COR / Cencora, Inc. | 0.00 | 107.65 | 0.66 | 157.36 | 1.7045 | 1.1191 | |||
| BRO / Brown & Brown, Inc. | 0.01 | 95.09 | 0.63 | 138.49 | 1.6233 | 1.0209 | |||
| NVS / Novartis AG - Depositary Receipt (Common Stock) | 0.01 | 21.98 | 0.61 | 39.55 | 1.5784 | 0.5813 | |||
| WRB / W. R. Berkley Corporation | 0.01 | -19.40 | 0.61 | -1.92 | 1.5735 | 0.1564 | |||
| AVGO / Broadcom Inc. | 0.00 | -9.32 | 0.61 | -34.52 | 1.5591 | -0.5426 | |||
| JPM / JPMorgan Chase & Co. | 0.00 | -9.33 | 0.60 | -7.26 | 1.5413 | 0.0749 | |||
| HALO / Halozyme Therapeutics, Inc. | 0.01 | -27.76 | 0.60 | -3.55 | 1.5355 | 0.1296 | |||
| CASY / Casey's General Stores, Inc. | 0.00 | -9.29 | 0.59 | -0.67 | 1.5229 | 0.1700 | |||
| CACI / CACI International Inc | 0.00 | 182.60 | 0.59 | 157.64 | 1.5144 | 0.9935 | |||
| AZN / AstraZeneca PLC - Depositary Receipt (Common Stock) | 0.01 | 19.67 | 0.59 | 34.32 | 1.5081 | 0.5164 | |||
| CPAY / Corpay, Inc. | 0.00 | 27.55 | 0.55 | 31.35 | 1.4214 | 0.4667 | |||
| JD / JD.com, Inc. - Depositary Receipt (Common Stock) | 0.01 | 0.55 | 1.4074 | 1.4074 | |||||
| TT / Trane Technologies plc | 0.00 | 52.37 | 0.54 | 38.97 | 1.3915 | 0.5077 | |||
| BGC / BGC Group, Inc. | 0.06 | 22.60 | 0.52 | 23.99 | 1.3421 | 0.3873 | |||
| APH / Amphenol Corporation | 0.01 | -9.32 | 0.51 | -14.36 | 1.3182 | -0.0406 | |||
| RJF / Raymond James Financial, Inc. | 0.00 | 0.51 | 1.3160 | 1.3160 | |||||
| PWR / Quanta Services, Inc. | 0.00 | 48.92 | 0.51 | 19.86 | 1.3029 | 0.3426 | |||
| SPY / SPDR S&P 500 ETF | 0.00 | -39.53 | 0.51 | -42.35 | 1.2980 | -0.6873 | |||
| TXRH / Texas Roadhouse, Inc. | 0.00 | -9.33 | 0.50 | -16.31 | 1.2921 | -0.0701 | |||
| DIS / The Walt Disney Company | 0.01 | 28.46 | 0.50 | 13.73 | 1.2773 | 0.2871 | |||
| HCA / HCA Healthcare, Inc. | 0.00 | -9.36 | 0.48 | 4.56 | 1.2373 | 0.1906 | |||
| TME / Tencent Music Entertainment Group - Depositary Receipt (Common Stock) | 0.03 | 0.47 | 1.2091 | 1.2091 | |||||
| BRBR / BellRing Brands, Inc. | 0.01 | 2.83 | 0.45 | 1.81 | 1.1582 | 0.1522 | |||
| KEX / Kirby Corporation | 0.00 | -9.34 | 0.44 | -13.31 | 1.1372 | -0.0226 | |||
| US21871X1090 / Corebridge Financial, Inc. | 0.01 | -9.34 | 0.44 | -4.40 | 1.1186 | 0.0860 | |||
| ENSG / The Ensign Group, Inc. | 0.00 | -9.35 | 0.44 | -11.59 | 1.1170 | 0.0001 | |||
| INGR / Ingredion Incorporated | 0.00 | 0.43 | 1.1165 | 1.1165 | |||||
| FSS / Federal Signal Corporation | 0.01 | -9.32 | 0.43 | -27.92 | 1.0953 | -0.2440 | |||
| EBAY / eBay Inc. | 0.01 | 0.42 | 1.0888 | 1.0888 | |||||
| FI / Fiserv, Inc. | 0.00 | -9.34 | 0.42 | -2.57 | 1.0724 | 0.1010 | |||
| FN / Fabrinet | 0.00 | 111.01 | 0.41 | 89.77 | 1.0494 | 0.5607 | |||
| EXPE / Expedia Group, Inc. | 0.00 | 0.40 | 1.0390 | 1.0390 | |||||
| AMG / Affiliated Managers Group, Inc. | 0.00 | 4.50 | 0.40 | -4.98 | 1.0308 | 0.0726 | |||
| IBKR / Interactive Brokers Group, Inc. | 0.00 | 45.97 | 0.39 | 36.93 | 1.0094 | 0.3582 | |||
| FTXP / Foothills Exploration, Inc. | 0.00 | 0.39 | 1.0016 | 1.0016 | |||||
| RMD / ResMed Inc. | 0.00 | -29.83 | 0.39 | -31.26 | 0.9934 | -0.2833 | |||
| YOU / Clear Secure, Inc. | 0.01 | -9.34 | 0.38 | -11.95 | 0.9847 | -0.0011 | |||
| AMP / Ameriprise Financial, Inc. | 0.00 | -29.47 | 0.37 | -35.85 | 0.9605 | -0.3617 | |||
| GS / The Goldman Sachs Group, Inc. | 0.00 | 51.24 | 0.37 | 44.49 | 0.9437 | 0.3663 | |||
| GM / General Motors Company | 0.01 | -9.35 | 0.35 | -20.00 | 0.8955 | -0.0922 | |||
| TSM / Taiwan Semiconductor Manufacturing Company Limited - Depositary Receipt (Common Stock) | 0.00 | -31.29 | 0.34 | -42.28 | 0.8739 | -0.4618 | |||
| BAH / Booz Allen Hamilton Holding Corporation | 0.00 | -9.34 | 0.31 | -26.48 | 0.7999 | -0.1586 | |||
| BKR / Baker Hughes Company | 0.01 | -9.35 | 0.30 | -2.96 | 0.7591 | 0.0692 | |||
| TSLA / Tesla, Inc. | 0.00 | -9.35 | 0.28 | -41.89 | 0.7284 | -0.3770 | |||
| CDNS / Cadence Design Systems, Inc. | 0.00 | -9.34 | 0.26 | -23.35 | 0.6593 | -0.0991 | |||
| MCK / McKesson Corporation | 0.00 | -15.18 | 0.26 | -2.30 | 0.6564 | 0.0404 | |||
| OSIS / OSI Systems, Inc. | 0.00 | -62.79 | 0.25 | -56.92 | 0.6485 | -0.6770 | |||
| FANG / Diamondback Energy, Inc. | 0.00 | -9.35 | 0.25 | -11.58 | 0.6484 | 0.0014 | |||
| NFLX / Netflix, Inc. | 0.00 | -67.47 | 0.25 | -66.04 | 0.6463 | -1.0300 | |||
| AROC / Archrock, Inc. | 0.01 | 0.25 | 0.6456 | 0.6456 | |||||
| GEN / Gen Digital Inc. | 0.01 | 0.25 | 0.6413 | 0.6413 | |||||
| EOG / EOG Resources, Inc. | 0.00 | -35.13 | 0.24 | -32.11 | 0.6195 | -0.1863 | |||
| OKE / ONEOK, Inc. | 0.00 | -9.34 | 0.24 | -10.49 | 0.6155 | 0.0091 | |||
| AVY / Avery Dennison Corporation | 0.00 | -38.52 | 0.23 | -46.94 | 0.6030 | -0.3060 | |||
| JBL / Jabil Inc. | 0.00 | 0.23 | 0.6011 | 0.6011 | |||||
| PFGC / Performance Food Group Company | 0.00 | 0.23 | 0.6002 | 0.6002 | |||||
| CBRE / CBRE Group, Inc. | 0.00 | -9.36 | 0.23 | -9.92 | 0.5851 | 0.0130 | |||
| LIN / Linde plc | 0.00 | -9.32 | 0.22 | 0.93 | 0.5582 | 0.0696 | |||
| RGLD / Royal Gold, Inc. | 0.00 | 0.20 | 0.5204 | 0.5204 | |||||
| VICI / VICI Properties Inc. | 0.01 | -38.56 | 0.20 | -31.49 | 0.5095 | -0.1460 | |||
| ADBE / Adobe Inc. | 0.00 | -31.70 | 0.20 | -41.07 | 0.5089 | -0.2538 | |||
| ADUS / Addus HomeCare Corporation | 0.00 | -9.35 | 0.20 | -28.57 | 0.5018 | -0.1176 | |||
| NU / Nu Holdings Ltd. | 0.02 | -38.43 | 0.19 | -39.23 | 0.4873 | -0.2195 | |||
| NVO / Novo Nordisk A/S - Depositary Receipt (Common Stock) | 0.00 | -9.34 | 0.19 | -27.06 | 0.4795 | -0.0988 | |||
| TBBK / The Bancorp, Inc. | 0.00 | -9.37 | 0.18 | -9.09 | 0.4633 | 0.0139 |