Mga Batayang Estadistika
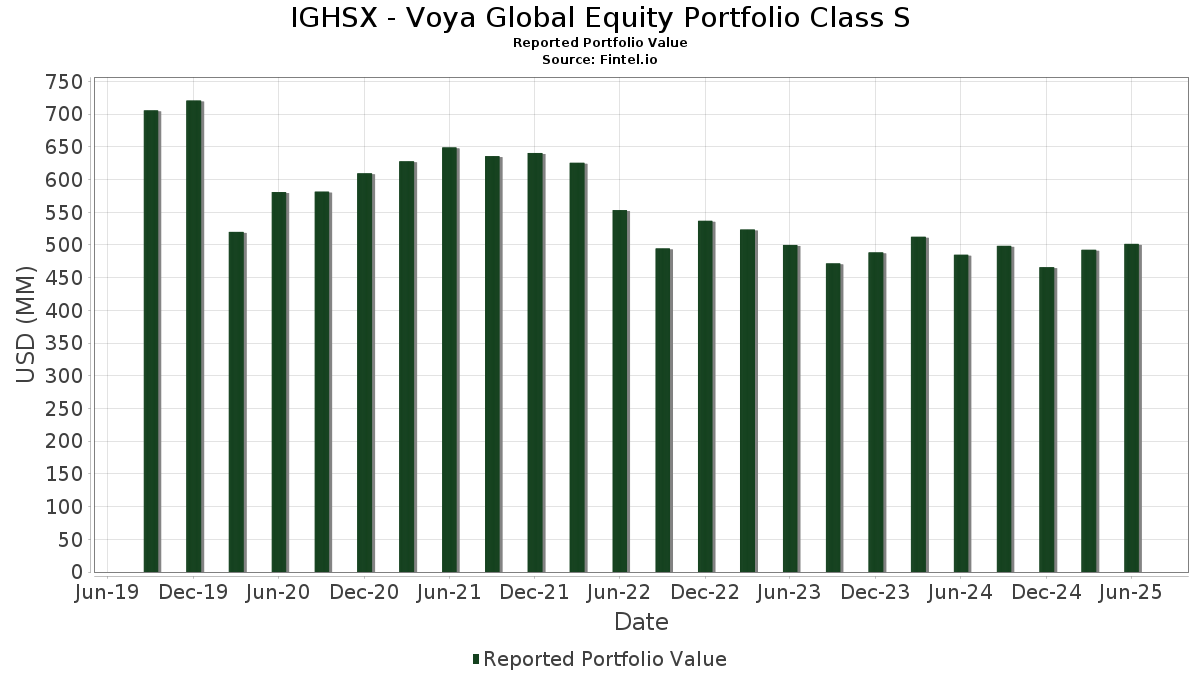
| Nilai Portofolio | $ 501,623,280 |
| Posisi Saat Ini | 239 |
Kepemilikan Terbaru, Kinerja, AUM (dari 13F, 13D)
IGHSX - Voya Global Equity Portfolio Class S telah mengungkapkan total kepemilikan 239 dalam pengajuan SEC terbaru mereka. Nilai portofolio terbaru dihitung sebesar $ 501,623,280 USD. Aset yang Dikelola (AUM) sebenarnya adalah nilai ini ditambah kas (yang tidak diungkapkan). Aset-aset utama IGHSX - Voya Global Equity Portfolio Class S adalah Meta Platforms, Inc. (US:META) , Johnson & Johnson (US:JNJ) , The Procter & Gamble Company (US:PG) , Cisco Systems, Inc. (US:CSCO) , and AbbVie Inc. (US:ABBV) . Posisi baru IGHSX - Voya Global Equity Portfolio Class S meliputi: Meta Platforms, Inc. (US:META) , VeriSign, Inc. (US:VRSN) , Paycom Software, Inc. (US:PAYC) , CNA Financial Corporation (US:CNA) , and Eastman Chemical Company (US:EMN) .
Peningkatan Tertinggi Kuartal Ini
Kami menggunakan perubahan dalam alokasi portofolio karena ini adalah metrik yang paling bermakna. Perubahan dapat disebabkan oleh perdagangan atau perubahan harga saham.
| Keamanan | Saham (MM) |
Nilai (Juta Dolar AS) |
Portfolio % | ΔPorsyento ng Portfolio |
|---|---|---|---|---|
| 0.02 | 11.18 | 2.2693 | 2.2693 | |
| 0.19 | 4.56 | 0.9265 | 0.8307 | |
| 0.03 | 5.25 | 1.0654 | 0.6910 | |
| 0.01 | 2.92 | 0.5919 | 0.5919 | |
| 0.04 | 2.85 | 0.5785 | 0.5785 | |
| 2.71 | 0.5495 | 0.5495 | ||
| 2.71 | 0.5495 | 0.5495 | ||
| 2.57 | 0.5221 | 0.5221 | ||
| 0.01 | 2.36 | 0.4784 | 0.4784 | |
| 0.05 | 2.55 | 0.5184 | 0.4143 |
Penurunan Tertinggi Kuartal Ini
Kami menggunakan perubahan dalam alokasi portofolio karena ini adalah metrik yang paling bermakna. Perubahan dapat disebabkan oleh perdagangan atau perubahan harga saham.
| Keamanan | Saham (MM) |
Nilai (Juta Dolar AS) |
Portfolio % | ΔPorsyento ng Portfolio |
|---|---|---|---|---|
| 0.00 | 0.00 | -0.4416 | ||
| 0.01 | 1.06 | 0.2144 | -0.3946 | |
| 0.06 | 1.51 | 0.3066 | -0.3927 | |
| 0.02 | 2.53 | 0.5138 | -0.3827 | |
| 0.02 | 1.56 | 0.3169 | -0.3690 | |
| 0.01 | 0.96 | 0.1945 | -0.3283 | |
| 0.00 | 0.65 | 0.1327 | -0.3259 | |
| 0.01 | 0.82 | 0.1657 | -0.3132 | |
| 0.01 | 1.16 | 0.2361 | -0.3102 | |
| 0.00 | 2.68 | 0.5435 | -0.2903 |
Pengajuan 13F dan Dana
Formulir ini diajukan pada 2025-08-26 untuk periode pelaporan 2025-06-30. Klik ikon tautan untuk melihat riwayat transaksi selengkapnya.
Tingkatkan ke versi premium untuk membuka data premium dan ekspor ke Excel. ![]() .
.
| Keamanan | Ketik | Harga Saham Rata-rata | Saham (MM) |
ΔSaham (%) |
ΔSaham (%) |
Nilai ($MM) |
Portpolyo (%) |
ΔPortofolio (%) |
|
|---|---|---|---|---|---|---|---|---|---|
| META / Meta Platforms, Inc. | 0.02 | 11.18 | 2.2693 | 2.2693 | |||||
| JNJ / Johnson & Johnson | 0.05 | 1.57 | 7.60 | -6.46 | 1.5433 | -0.1302 | |||
| PG / The Procter & Gamble Company | 0.05 | -0.25 | 7.55 | -6.76 | 1.5323 | -0.1346 | |||
| CSCO / Cisco Systems, Inc. | 0.10 | 1.43 | 6.77 | 14.04 | 1.3740 | 0.1518 | |||
| ABBV / AbbVie Inc. | 0.04 | -3.23 | 6.69 | -14.27 | 1.3578 | -0.2487 | |||
| WFC / Wells Fargo & Company | 0.08 | -3.23 | 6.11 | 8.01 | 1.2393 | 0.0753 | |||
| RTX / RTX Corporation | 0.04 | -3.22 | 5.58 | 6.69 | 1.1326 | 0.0556 | |||
| T / AT&T Inc. | 0.19 | -12.29 | 5.37 | -10.25 | 1.0896 | -0.1419 | |||
| IWD / iShares Trust - iShares Russell 1000 Value ETF | 0.03 | 179.64 | 5.25 | 188.67 | 1.0654 | 0.6910 | |||
| VZ / Verizon Communications Inc. | 0.12 | -3.23 | 5.12 | -7.68 | 1.0401 | -0.1029 | |||
| PEP / PepsiCo, Inc. | 0.04 | 16.26 | 5.07 | 2.38 | 1.0296 | 0.0094 | |||
| PFE / Pfizer Inc. | 0.19 | 925.56 | 4.56 | 881.51 | 0.9265 | 0.8307 | |||
| BATS / British American Tobacco p.l.c. | 0.09 | -3.23 | 4.15 | 12.16 | 0.8428 | 0.0805 | |||
| ISP / Intesa Sanpaolo S.p.A. | 0.71 | -5.87 | 4.07 | 5.22 | 0.8264 | 0.0296 | |||
| ZURN / Zurich Insurance Group AG | 0.01 | -3.22 | 4.04 | -2.98 | 0.8200 | -0.0374 | |||
| MDT / Medtronic plc | 0.05 | -3.23 | 3.99 | -6.12 | 0.8102 | -0.0653 | |||
| MO / Altria Group, Inc. | 0.07 | -0.47 | 3.91 | -2.78 | 0.7944 | -0.0344 | |||
| CME / CME Group Inc. | 0.01 | -14.16 | 3.91 | -10.83 | 0.7942 | -0.1092 | |||
| MMC / Marsh & McLennan Companies, Inc. | 0.02 | -3.23 | 3.85 | -13.30 | 0.7810 | -0.1328 | |||
| WMB / The Williams Companies, Inc. | 0.06 | -3.23 | 3.81 | 1.74 | 0.7734 | 0.0021 | |||
| BMY / Bristol-Myers Squibb Company | 0.08 | 16.94 | 3.80 | -11.23 | 0.7718 | -0.1104 | |||
| BNS / The Bank of Nova Scotia | 0.07 | -3.23 | 3.79 | 12.86 | 0.7694 | 0.0779 | |||
| DUK / Duke Energy Corporation | 0.03 | -3.22 | 3.77 | -6.39 | 0.7648 | -0.0639 | |||
| CI / The Cigna Group | 0.01 | -3.23 | 3.74 | -2.79 | 0.7583 | -0.0328 | |||
| ROG / Roche Holding AG | 0.01 | 100.11 | 3.58 | 98.56 | 0.7271 | 0.3555 | |||
| ELV / Elevance Health, Inc. | 0.01 | -3.23 | 3.58 | -13.47 | 0.7262 | -0.1251 | |||
| MRK / Merck & Co., Inc. | 0.04 | -3.22 | 3.55 | -14.65 | 0.7214 | -0.1360 | |||
| KMI / Kinder Morgan, Inc. | 0.12 | -3.23 | 3.53 | -0.28 | 0.7157 | -0.0123 | |||
| CL / Colgate-Palmolive Company | 0.04 | -3.23 | 3.45 | -6.12 | 0.7011 | -0.0565 | |||
| HIG / The Hartford Insurance Group, Inc. | 0.03 | -3.23 | 3.43 | -0.78 | 0.6953 | -0.0155 | |||
| CAH / Cardinal Health, Inc. | 0.02 | -19.05 | 3.39 | -1.31 | 0.6889 | -0.0190 | |||
| CBOE / Cboe Global Markets, Inc. | 0.01 | -3.23 | 3.38 | -0.27 | 0.6852 | -0.0118 | |||
| D1NC / DNB Bank ASA | 0.12 | -3.23 | 3.37 | 1.72 | 0.6848 | 0.0018 | |||
| ADP / Automatic Data Processing, Inc. | 0.01 | -27.57 | 3.33 | -26.90 | 0.6765 | -0.2621 | |||
| BNP / BNP Paribas SA | 0.04 | -3.23 | 3.31 | 3.86 | 0.6713 | 0.0157 | |||
| COR / Cencora, Inc. | 0.01 | -16.44 | 3.27 | -9.88 | 0.6628 | -0.0834 | |||
| GILD / Gilead Sciences, Inc. | 0.03 | -26.28 | 3.26 | -27.05 | 0.6612 | -0.2583 | |||
| RSG / Republic Services, Inc. | 0.01 | -3.22 | 3.22 | -1.44 | 0.6530 | -0.0191 | |||
| LMT / Lockheed Martin Corporation | 0.01 | -3.23 | 3.20 | 0.35 | 0.6488 | -0.0072 | |||
| DSN / Danske Bank A/S | 0.08 | -20.07 | 3.17 | -0.25 | 0.6430 | -0.0110 | |||
| L / Loews Corporation | 0.03 | -3.23 | 3.14 | -3.48 | 0.6364 | -0.0325 | |||
| C / Citigroup Inc. | 0.04 | 6.05 | 3.10 | 27.13 | 0.6298 | 0.1274 | |||
| EXC / Exelon Corporation | 0.07 | -3.23 | 3.08 | -8.81 | 0.6260 | -0.0704 | |||
| ORA / Orange S.A. | 0.20 | -3.23 | 3.08 | 13.77 | 0.6254 | 0.0677 | |||
| SSNC / SS&C Technologies Holdings, Inc. | 0.04 | -3.23 | 3.07 | -4.06 | 0.6232 | -0.0358 | |||
| NN / NN Group N.V. | 0.05 | -17.73 | 3.04 | -1.62 | 0.6164 | -0.0192 | |||
| KPN / Koninklijke KPN N.V. | 0.62 | -3.23 | 3.04 | 11.45 | 0.6163 | 0.0553 | |||
| DTM / DT Midstream, Inc. | 0.03 | -3.23 | 3.02 | 10.23 | 0.6124 | 0.0489 | |||
| MTG / MGIC Investment Corporation | 0.11 | -3.23 | 2.97 | 8.73 | 0.6020 | 0.0403 | |||
| KMB / Kimberly-Clark Corporation | 0.02 | -3.23 | 2.94 | -12.28 | 0.5974 | -0.0934 | |||
| NI / NiSource Inc. | 0.07 | -3.23 | 2.94 | -2.65 | 0.5971 | -0.0249 | |||
| UCG / UniCredit S.p.A. | 0.04 | -25.49 | 2.94 | -10.96 | 0.5971 | -0.0832 | |||
| 9201 / Japan Airlines Co., Ltd. | 0.14 | -3.23 | 2.93 | 15.22 | 0.5949 | 0.0711 | |||
| VRSN / VeriSign, Inc. | 0.01 | 2.92 | 0.5919 | 0.5919 | |||||
| V / Visa Inc. | 0.01 | -3.23 | 2.91 | -1.96 | 0.5898 | -0.0205 | |||
| VTRS / Viatris Inc. | 0.32 | 9.91 | 2.89 | 12.70 | 0.5857 | 0.0585 | |||
| COP / ConocoPhillips | 0.03 | -3.23 | 2.88 | -17.33 | 0.5840 | -0.1324 | |||
| TLS / Telstra Group Limited | 0.90 | 1.19 | 2.87 | 22.13 | 0.5828 | 0.0987 | |||
| OKE / ONEOK, Inc. | 0.04 | -3.23 | 2.87 | -20.39 | 0.5819 | -0.1595 | |||
| TNL / Travel + Leisure Co. | 0.06 | 80.54 | 2.86 | 101.27 | 0.5798 | 0.2876 | |||
| JAP / Central Japan Railway Company | 0.13 | 0.31 | 2.85 | 17.57 | 0.5785 | 0.0794 | |||
| CTSH / Cognizant Technology Solutions Corporation | 0.04 | 2.85 | 0.5785 | 0.5785 | |||||
| MSFT / Microsoft Corporation | 0.01 | -37.81 | 2.82 | 0.36 | 0.5733 | 0.1060 | |||
| MET / MetLife, Inc. | 0.03 | 7.63 | 2.81 | 7.78 | 0.5712 | 0.0337 | |||
| GLPI / Gaming and Leisure Properties, Inc. | 0.06 | 10.57 | 2.81 | 1.41 | 0.5696 | -0.0002 | |||
| NTAP / NetApp, Inc. | 0.03 | 16.77 | 2.78 | 41.65 | 0.5633 | 0.1599 | |||
| AXV / AXIS Capital Holdings Limited | 0.03 | -3.23 | 2.74 | 0.26 | 0.5570 | -0.0067 | |||
| AVT / Avnet, Inc. | 0.05 | 9.36 | 2.73 | 20.71 | 0.5539 | 0.0884 | |||
| SNA / Snap-on Incorporated | 0.01 | -3.23 | 2.71 | -10.64 | 0.5510 | -0.0745 | |||
| NNN / NNN REIT, Inc. | 0.06 | 5.51 | 2.71 | 6.82 | 0.5500 | 0.0277 | |||
| DAIWA CAPITAL MARKETS AMERICA INC / RA (000000000) | 2.71 | 0.5495 | 0.5495 | ||||||
| CANTOR FITZGERALD SECURITIES / RA (000000000) | 2.71 | 0.5495 | 0.5495 | ||||||
| ATR / AptarGroup, Inc. | 0.02 | -3.23 | 2.70 | 2.04 | 0.5475 | 0.0031 | |||
| UNM / Unum Group | 0.03 | -3.23 | 2.68 | -4.04 | 0.5442 | -0.0312 | |||
| MCK / McKesson Corporation | 0.00 | -39.27 | 2.68 | -33.88 | 0.5435 | -0.2903 | |||
| BA. / BAE Systems plc | 0.10 | -21.25 | 2.66 | 1.22 | 0.5405 | -0.0012 | |||
| ORI / Old Republic International Corporation | 0.07 | -0.35 | 2.66 | -2.35 | 0.5405 | -0.0209 | |||
| TRI / Thomson Reuters Corporation | 0.01 | -3.23 | 2.65 | 12.80 | 0.5386 | 0.0541 | |||
| OGE / OGE Energy Corp. | 0.06 | -3.23 | 2.64 | -6.55 | 0.5360 | -0.0459 | |||
| G / Genpact Limited | 0.06 | 5.75 | 2.64 | -7.60 | 0.5353 | -0.0525 | |||
| HRB / H&R Block, Inc. | 0.05 | -3.23 | 2.64 | -3.27 | 0.5349 | -0.0260 | |||
| 9735 / SECOM CO., LTD. | 0.07 | 18.48 | 2.63 | 24.99 | 0.5331 | 0.1003 | |||
| MSI / Motorola Solutions, Inc. | 0.01 | 17.32 | 2.62 | 12.66 | 0.5312 | 0.0530 | |||
| 2503 / Kirin Holdings Company, Limited | 0.19 | 71.97 | 2.61 | 74.01 | 0.5288 | 0.2204 | |||
| STATE OF WISCONSIN INVESTMENT BOARD / RA (000000000) | 2.57 | 0.5221 | 0.5221 | ||||||
| IMB / Imperial Brands PLC | 0.06 | 16.59 | 2.56 | 80.00 | 0.5189 | 0.2194 | |||
| NFG / National Fuel Gas Company | 0.03 | -3.22 | 2.56 | 3.52 | 0.5189 | 0.0104 | |||
| CS / AXA SA | 0.05 | 339.62 | 2.55 | 405.74 | 0.5184 | 0.4143 | |||
| THG / The Hanover Insurance Group, Inc. | 0.02 | 12.15 | 2.55 | 9.50 | 0.5173 | 0.0381 | |||
| TJX / The TJX Companies, Inc. | 0.02 | -42.66 | 2.53 | -41.86 | 0.5138 | -0.3827 | |||
| EG0 / Essent Group Ltd. | 0.04 | -10.10 | 2.53 | -5.43 | 0.5130 | -0.0372 | |||
| PM / Philip Morris International Inc. | 0.01 | -3.22 | 2.49 | 11.05 | 0.5061 | 0.0438 | |||
| SGE / Société Générale Société anonyme | 0.14 | 85.40 | 2.49 | 102.94 | 0.5051 | 0.2524 | |||
| KEY / Keyera Corp. | 0.07 | -22.36 | 2.45 | -18.31 | 0.4972 | -0.1202 | |||
| USB / U.S. Bancorp | 0.05 | -24.77 | 2.41 | 3.04 | 0.4889 | 0.0162 | |||
| AIZ / Assurant, Inc. | 0.01 | -3.23 | 2.40 | -8.89 | 0.4871 | -0.0552 | |||
| SU / Suncor Energy Inc. | 0.06 | 9.89 | 2.38 | 6.29 | 0.4834 | 0.0221 | |||
| GZF / Engie SA | 0.10 | 180.21 | 2.37 | 238.03 | 0.4818 | 0.3372 | |||
| INGR / Ingredion Incorporated | 0.02 | -3.23 | 2.37 | -2.95 | 0.4814 | -0.0217 | |||
| WM / Waste Management, Inc. | 0.01 | -67.44 | 2.36 | -50.13 | 0.4794 | -0.2893 | |||
| AENA / Aena S.M.E., S.A. | 0.09 | 867.75 | 2.36 | 10.12 | 0.4793 | 0.0377 | |||
| PAYC / Paycom Software, Inc. | 0.01 | 2.36 | 0.4784 | 0.4784 | |||||
| EIX / Edison International | 0.05 | 20.55 | 2.36 | 5.56 | 0.4781 | 0.0187 | |||
| AME / AMETEK, Inc. | 0.01 | -3.23 | 2.34 | 1.74 | 0.4750 | 0.0014 | |||
| REP / Repsol, S.A. | 0.16 | -3.23 | 2.29 | 6.62 | 0.4645 | 0.0225 | |||
| BK / The Bank of New York Mellon Corporation | 0.02 | -3.23 | 2.23 | 5.13 | 0.4531 | 0.0159 | |||
| BRX / Brixmor Property Group Inc. | 0.09 | -3.23 | 2.22 | -5.09 | 0.4504 | -0.0310 | |||
| 4689 / LY Corporation | 0.60 | -14.57 | 2.21 | -7.11 | 0.4483 | -0.0412 | |||
| QCOM / QUALCOMM Incorporated | 0.01 | -6.00 | 2.20 | -11.95 | 0.4457 | -0.0570 | |||
| 1925 / Daiwa House Industry Co., Ltd. | 0.06 | 2.27 | 2.17 | 6.27 | 0.4401 | 0.0199 | |||
| EFV / iShares Trust - iShares MSCI EAFE Value ETF | 0.03 | 168.50 | 2.15 | 189.23 | 0.4363 | 0.2833 | |||
| SPG / Simon Property Group, Inc. | 0.01 | 120.04 | 2.11 | 113.03 | 0.4282 | 0.2242 | |||
| SYF / Synchrony Financial | 0.03 | -15.32 | 2.05 | 6.72 | 0.4159 | 0.0207 | |||
| CTAS / Cintas Corporation | 0.01 | -3.23 | 2.04 | 4.89 | 0.4137 | 0.0138 | |||
| 1 / CK Hutchison Holdings Limited | 0.33 | 30.16 | 2.02 | 42.18 | 0.4100 | 0.1175 | |||
| NWE / NorthWestern Energy Group, Inc. | 0.04 | 13.09 | 1.99 | 0.25 | 0.4040 | -0.0048 | |||
| RYSD / NatWest Group plc | 0.28 | 11.39 | 1.95 | 32.47 | 0.3960 | 0.0928 | |||
| ALL / The Allstate Corporation | 0.01 | -3.23 | 1.90 | -5.91 | 0.3849 | -0.0301 | |||
| HSBC SECURITIES (USA) INC / RA (000000000) | 1.89 | 0.3834 | 0.3834 | ||||||
| PST / Poste Italiane S.p.A. | 0.09 | -17.84 | 1.88 | -1.05 | 0.3823 | -0.0096 | |||
| GOOGL / Alphabet Inc. | 0.01 | 37.32 | 1.84 | 56.51 | 0.3733 | 0.1313 | |||
| ADT / ADT Inc. | 0.22 | 100.07 | 1.83 | 108.17 | 0.3724 | 0.1909 | |||
| BPOP / Popular, Inc. | 0.02 | 233.04 | 1.83 | 297.83 | 0.3723 | 0.2773 | |||
| FRE / Frendy Energy S.p.A. | 0.04 | -3.23 | 1.81 | 14.11 | 0.3678 | 0.0407 | |||
| PSON N / Pearson plc | 0.12 | 8.79 | 1.78 | 1.31 | 0.3611 | -0.0005 | |||
| AMP / Ameriprise Financial, Inc. | 0.00 | 39.48 | 1.76 | 53.80 | 0.3575 | 0.1217 | |||
| CVE / Cenovus Energy Inc. | 0.13 | 36.69 | 1.76 | 33.82 | 0.3568 | 0.0864 | |||
| ACM / AECOM | 0.02 | -3.22 | 1.74 | 17.79 | 0.3522 | 0.0489 | |||
| NYT / The New York Times Company | 0.03 | -3.22 | 1.70 | 9.20 | 0.3448 | 0.0246 | |||
| AMCR / Amcor plc | 0.18 | 10.60 | 1.69 | 5.43 | 0.3430 | 0.0137 | |||
| RITM / Rithm Capital Corp. | 0.15 | 102.19 | 1.67 | 99.52 | 0.3395 | 0.1667 | |||
| BKH / Black Hills Corporation | 0.03 | 36.06 | 1.63 | 25.87 | 0.3309 | 0.0642 | |||
| MPL / Medibank Private Limited | 0.48 | -3.23 | 1.60 | 14.99 | 0.3240 | 0.0382 | |||
| FGR / FirstGroup plc | 0.01 | -3.22 | 1.57 | 16.78 | 0.3194 | 0.0420 | |||
| QS2A / Smiths Group plc | 0.05 | -3.22 | 1.57 | 19.01 | 0.3177 | 0.0468 | |||
| GL / Globe Life Inc. | 0.01 | 73.56 | 1.56 | 63.84 | 0.3173 | 0.1207 | |||
| EVRG / Evergy, Inc. | 0.02 | -53.12 | 1.56 | -53.14 | 0.3169 | -0.3690 | |||
| 4D7 / Daito Trust Construction Co.,Ltd. | 0.01 | -2.76 | 1.54 | 3.51 | 0.3117 | 0.0062 | |||
| EQH / Equitable Holdings, Inc. | 0.03 | -21.99 | 1.53 | -16.00 | 0.3113 | -0.0645 | |||
| M3C / Mitsubishi Chemical Group Corporation | 0.29 | -6.95 | 1.53 | -1.04 | 0.3101 | -0.0077 | |||
| AOS / Amdocs Limited | 0.02 | -41.99 | 1.53 | -42.18 | 0.3101 | -0.2337 | |||
| G24 / Scout24 SE | 0.01 | -5.15 | 1.52 | 25.04 | 0.3093 | 0.0584 | |||
| CDNAF / Canadian Tire Corporation, Limited | 0.01 | 37.37 | 1.51 | 80.10 | 0.3069 | 0.1340 | |||
| CTRA / Coterra Energy Inc. | 0.06 | -49.35 | 1.51 | -55.54 | 0.3066 | -0.3927 | |||
| WTKWY / Wolters Kluwer N.V. - Depositary Receipt (Common Stock) | 0.01 | -15.26 | 1.49 | -9.02 | 0.3032 | -0.0347 | |||
| 8750 / Dai-ichi Life Holdings, Inc. | 0.19 | 320.74 | 1.47 | 23.32 | 0.2974 | 0.0578 | |||
| PND / Mowi ASA | 0.08 | -41.29 | 1.46 | -50.91 | 0.2958 | -0.1289 | |||
| DTE / Deutsche Telekom AG | 0.04 | -25.07 | 1.45 | -25.74 | 0.2947 | -0.1077 | |||
| LUMI / Bank Leumi le-Israel B.M. | 0.08 | 55.03 | 1.43 | 114.20 | 0.2910 | 0.1532 | |||
| JKHY / Jack Henry & Associates, Inc. | 0.01 | -48.53 | 1.40 | -49.22 | 0.2849 | -0.2842 | |||
| SOU / Singapore Exchange Limited | 0.12 | 99.83 | 1.40 | 136.26 | 0.2845 | 0.1624 | |||
| DLR / Digital Realty Trust, Inc. | 0.01 | -3.22 | 1.38 | 17.79 | 0.2810 | 0.0389 | |||
| SGSN / SGS SA | 0.01 | 199.98 | 1.38 | 205.76 | 0.2801 | 0.1871 | |||
| X / TMX Group Limited | 0.03 | 14.57 | 1.35 | 33.00 | 0.2734 | 0.0649 | |||
| EOG / EOG Resources, Inc. | 0.01 | -3.23 | 1.34 | -9.74 | 0.2730 | -0.0338 | |||
| WEN / The Wendy's Company | 0.11 | -13.68 | 1.31 | -32.61 | 0.2663 | -0.1346 | |||
| HWC / Hancock Whitney Corporation | 0.02 | 79.70 | 1.29 | 96.64 | 0.2611 | 0.1264 | |||
| ESS / Essex Property Trust, Inc. | 0.00 | -3.23 | 1.28 | -10.54 | 0.2603 | -0.0349 | |||
| CNA / CNA Financial Corporation | 0.03 | 1.26 | 0.2561 | 0.2561 | |||||
| ACS / Athens Medical C.S.A. | 0.02 | -43.54 | 1.24 | -31.47 | 0.2508 | -0.1203 | |||
| BKR / Baker Hughes Company | 0.03 | -33.57 | 1.19 | -42.05 | 0.2412 | -0.1810 | |||
| EMN / Eastman Chemical Company | 0.02 | 1.18 | 0.2388 | 0.2388 | |||||
| RPM / RPM International Inc. | 0.01 | -53.83 | 1.16 | -56.16 | 0.2361 | -0.3102 | |||
| 6823 / HKT Trust and HKT Limited - Debt/Equity Composite Units | 0.77 | 23.51 | 1.15 | 38.24 | 0.2328 | 0.0619 | |||
| BMO / Bank of Montreal | 0.01 | 1.14 | 0.2310 | 0.2310 | |||||
| CAG / Conagra Brands, Inc. | 0.05 | -3.23 | 1.12 | -25.76 | 0.2283 | -0.0835 | |||
| H4W / Jardine Matheson Holdings Limited | 0.02 | 56.38 | 1.12 | 77.50 | 0.2273 | 0.0973 | |||
| CCDBF / CCL Industries Inc. | 0.02 | 95.68 | 1.08 | 133.48 | 0.2196 | 0.1242 | |||
| AHKSF / Asahi Kasei Corporation | 0.15 | -3.26 | 1.08 | -1.73 | 0.2189 | -0.0071 | |||
| GM / General Motors Company | 0.02 | -21.99 | 1.08 | -17.36 | 0.2185 | -0.0562 | |||
| CHD / Church & Dwight Co., Inc. | 0.01 | -59.09 | 1.06 | -64.29 | 0.2144 | -0.3946 | |||
| 823 / Link Real Estate Investment Trust | 0.19 | 7.71 | 1.02 | 23.12 | 0.2065 | 0.0364 | |||
| SY1 / Symrise AG | 0.01 | -13.94 | 1.01 | -12.96 | 0.2059 | -0.0340 | |||
| FTV / Fortive Corporation | 0.02 | -3.23 | 0.99 | -31.07 | 0.2019 | -0.0952 | |||
| 5 / HSBC Holdings plc | 0.08 | 52.33 | 0.98 | 62.69 | 0.1991 | 0.0749 | |||
| HEN3 / Henkel AG & Co. KGaA - Preferred Stock | 0.01 | -50.31 | 0.96 | -50.95 | 0.1947 | -0.2077 | |||
| EMR / Emerson Electric Co. | 0.01 | -72.51 | 0.96 | -62.33 | 0.1945 | -0.3283 | |||
| TW / Tradeweb Markets Inc. | 0.01 | -3.23 | 0.95 | -4.62 | 0.1930 | -0.0122 | |||
| ETR / Entergy Corporation | 0.01 | -3.22 | 0.93 | -5.86 | 0.1890 | -0.0148 | |||
| NOKIA / Nokia Oyj | 0.18 | -3.23 | 0.93 | -4.62 | 0.1886 | -0.0121 | |||
| VW-V / Volkswagen AG - Preferred Stock | 0.01 | 0.93 | 0.1878 | 0.1878 | |||||
| 0WH / WH Group Limited | 0.96 | 0.92 | 0.1873 | 0.1873 | |||||
| BRO / Brown & Brown, Inc. | 0.01 | -3.22 | 0.91 | -13.71 | 0.1854 | -0.0326 | |||
| CNQ / Canadian Natural Resources Limited | 0.03 | 0.87 | 0.1758 | 0.1758 | |||||
| RGLD / Royal Gold, Inc. | 0.00 | -83.81 | 0.85 | -69.84 | 0.1734 | -0.2865 | |||
| CSX / CSX Corporation | 0.03 | 51.05 | 0.84 | 52.72 | 0.1712 | 0.0526 | |||
| REG / Regency Centers Corporation | 0.01 | -63.66 | 0.82 | -64.90 | 0.1657 | -0.3132 | |||
| AMS / Amadeus IT Group, S.A. | 0.01 | -3.23 | 0.79 | 6.78 | 0.1598 | 0.0079 | |||
| JAT / Japan Tobacco Inc. | 0.03 | 56.47 | 0.78 | 79.59 | 0.1591 | 0.0654 | |||
| ERCB / Telefonaktiebolaget LM Ericsson (publ) | 0.09 | -23.86 | 0.78 | -40.53 | 0.1582 | -0.0692 | |||
| CA / Carrefour SA | 0.05 | 52.33 | 0.78 | 50.49 | 0.1573 | 0.0511 | |||
| FLN / Admiral Group plc | 0.02 | 0.75 | 0.1517 | 0.1517 | |||||
| SCG / Scentre Group | 0.32 | 39.49 | 0.75 | 54.98 | 0.1517 | 0.0523 | |||
| 2UA / Auto Trader Group plc | 0.07 | -63.31 | 0.74 | -57.05 | 0.1510 | -0.2054 | |||
| BN / Danone S.A. | 0.01 | -3.23 | 0.72 | 3.59 | 0.1464 | 0.0029 | |||
| 19 / Swire Pacific Limited | 0.08 | -33.20 | 0.72 | -35.06 | 0.1453 | -0.0816 | |||
| HPE / Hewlett Packard Enterprise Company | 0.03 | 18.83 | 0.70 | 57.75 | 0.1425 | 0.0507 | |||
| FR / First Industrial Realty Trust, Inc. | 0.01 | 11.57 | 0.68 | -0.44 | 0.1383 | -0.0027 | |||
| 6 / Power Assets Holdings Limited | 0.10 | -34.48 | 0.67 | -29.74 | 0.1364 | -0.0603 | |||
| WTS / Watts Water Technologies, Inc. | 0.00 | 16.88 | 0.66 | 40.98 | 0.1348 | 0.0378 | |||
| LDOS / Leidos Holdings, Inc. | 0.00 | -3.22 | 0.66 | 13.23 | 0.1339 | 0.0138 | |||
| JPM / JPMorgan Chase & Co. | 0.00 | -82.81 | 0.65 | -70.73 | 0.1327 | -0.3259 | |||
| BARC / Barclays PLC | 0.14 | -76.59 | 0.64 | -41.31 | 0.1290 | -0.0259 | |||
| PB / Prosperity Bancshares, Inc. | 0.01 | -3.22 | 0.63 | -4.68 | 0.1281 | -0.0083 | |||
| FRYA / Swedbank AB (publ) | 0.02 | 18.25 | 0.63 | 37.55 | 0.1281 | 0.0336 | |||
| COH / Cochlear Limited | 0.00 | -3.22 | 0.62 | 16.20 | 0.1268 | 0.0161 | |||
| DEVL / DBS Group Holdings Ltd | 0.02 | 17.86 | 0.58 | 21.25 | 0.1182 | 0.0192 | |||
| MSADF / MS&AD Insurance Group Holdings, Inc. | 0.03 | 19.91 | 0.58 | 23.45 | 0.1175 | 0.0208 | |||
| SN. / Smith & Nephew plc | 0.04 | -37.42 | 0.56 | -53.87 | 0.1137 | -0.0871 | |||
| FPH / Fisher & Paykel Healthcare Corporation Limited | 0.03 | -3.22 | 0.55 | 11.34 | 0.1117 | 0.0100 | |||
| IRDM / Iridium Communications Inc. | 0.02 | -13.27 | 0.55 | -1.61 | 0.1116 | -0.0064 | |||
| IPN / Ipsen S.A. | 0.00 | -3.23 | 0.53 | 0.00 | 0.1085 | -0.0015 | |||
| IAG / iA Financial Corporation Inc. | 0.00 | -76.27 | 0.52 | -72.61 | 0.1058 | -0.2859 | |||
| JPHLF / Japan Post Holdings Co., Ltd. | 0.06 | 18.57 | 0.52 | 9.47 | 0.1057 | 0.0078 | |||
| ON4 / Ono Pharmaceutical Co., Ltd. | 0.05 | -3.33 | 0.50 | -2.71 | 0.1023 | -0.0043 | |||
| DD / DuPont de Nemours, Inc. | 0.01 | 0.50 | 0.1023 | 0.1023 | |||||
| HXL / Hexcel Corporation | 0.01 | 0.50 | 0.1020 | 0.1020 | |||||
| ASX / ASX Limited | 0.01 | 0.50 | 0.1017 | 0.1017 | |||||
| CDP / COPT Defense Properties | 0.02 | -3.23 | 0.50 | -2.15 | 0.1016 | -0.0037 | |||
| ABBN / ABB Ltd | 0.01 | -53.29 | 0.49 | -45.77 | 0.1004 | -0.0874 | |||
| ASRNL / ASR Nederland N.V. | 0.01 | 0.49 | 0.1001 | 0.1001 | |||||
| DSFIR N / DSM-Firmenich AG | 0.00 | 0.49 | 0.0998 | 0.0998 | |||||
| DOC / Healthpeak Properties, Inc. | 0.03 | 0.49 | 0.0996 | 0.0996 | |||||
| KMPR / Kemper Corporation | 0.01 | 0.49 | 0.0986 | 0.0986 | |||||
| SFD / Smithfield Foods, Inc. | 0.02 | 0.48 | 0.0970 | 0.0970 | |||||
| SBRA / Sabra Health Care REIT, Inc. | 0.03 | 0.48 | 0.0965 | 0.0965 | |||||
| HUM / Humana Inc. | 0.00 | -3.25 | 0.47 | -10.59 | 0.0960 | -0.0129 | |||
| KDP / Keurig Dr Pepper Inc. | 0.01 | 0.47 | 0.0950 | 0.0950 | |||||
| RL / Ralph Lauren Corporation | 0.00 | -54.39 | 0.47 | -43.39 | 0.0949 | -0.0750 | |||
| EQR / Equity Residential | 0.01 | -63.67 | 0.46 | -65.79 | 0.0927 | -0.1819 | |||
| OGS / ONE Gas, Inc. | 0.01 | -3.23 | 0.44 | -8.16 | 0.0893 | -0.0092 | |||
| BNP PARIBAS SA / RA (000000000) | 0.38 | 0.0778 | 0.0778 | ||||||
| PCG / PG&E Corporation | 0.03 | -5.63 | 0.37 | -34.93 | 0.0747 | -0.0466 | |||
| US61747C7074 / Morgan Stanley Institutional Liquidity Funds Government Portfolio, Institutional Class | 0.31 | -60.98 | 0.31 | -60.98 | 0.0631 | -0.1010 | |||
| RAL / Ralliant Corporation | 0.01 | 0.31 | 0.0626 | 0.0626 | |||||
| CANADIAN IMPERIAL BANK OF COMMERCE (TORONTO BRANCH) / DBT (000000000) | 0.27 | 0.0548 | 0.0548 | ||||||
| ROYAL BANK OF CANADA (TORONTO BRANCH) / DBT (000000000) | 0.27 | 0.0548 | 0.0548 | ||||||
| MIZUHO BANK LTD (NEW YORK BRANCH) / DBT (000000000) | 0.27 | 0.0548 | 0.0548 | ||||||
| LANDESBANK HESSEN THUERINGEN GIROZENTRALE(NEW YORK BRANCH) / DBT (000000000) | 0.26 | 0.0528 | 0.0528 | ||||||
| IBKR / Interactive Brokers Group, Inc. | 0.00 | -100.00 | 0.00 | -100.00 | -0.1369 | ||||
| PR / Permian Resources Corporation | 0.00 | -100.00 | 0.00 | -100.00 | -0.2005 | ||||
| OWL / Blue Owl Capital Inc. | 0.00 | -100.00 | 0.00 | -100.00 | -0.1957 | ||||
| IBKR / Interactive Brokers Group, Inc. | 0.00 | -100.00 | 0.00 | -100.00 | -0.1369 | ||||
| AENA / Aena S.M.E., S.A. | 0.00 | -100.00 | 0.00 | -100.00 | -0.4416 |