Mga Batayang Estadistika
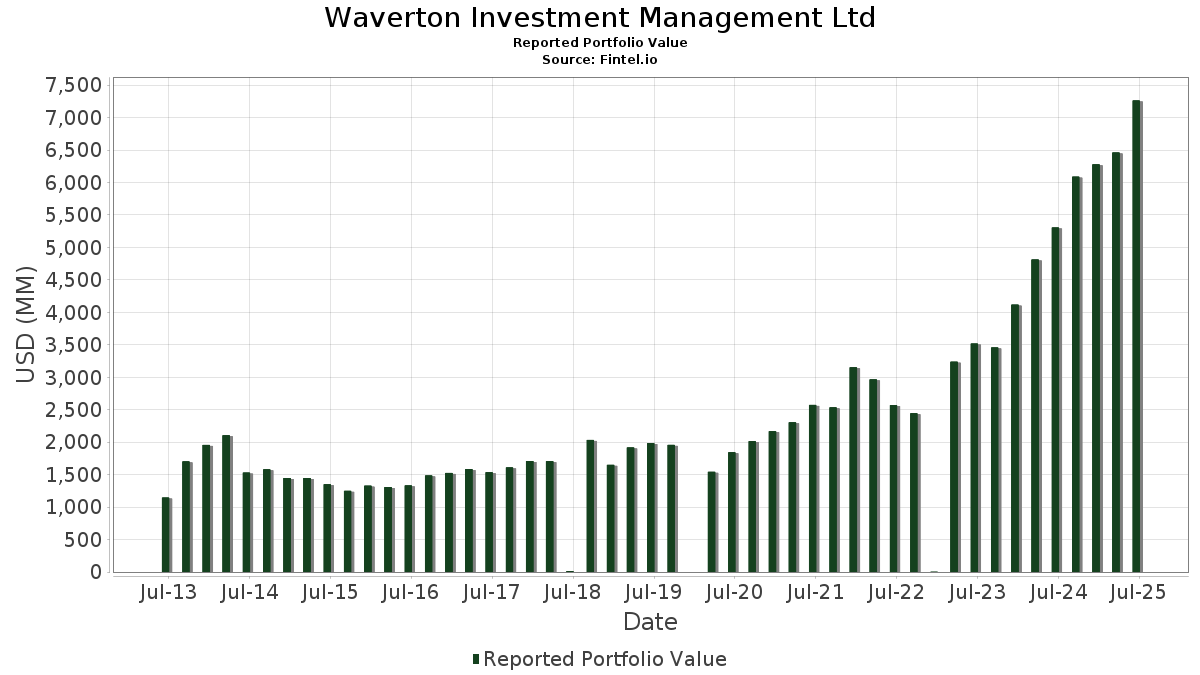
| Nilai Portofolio | $ 7,262,316,613 |
| Posisi Saat Ini | 105 |
Kepemilikan Terbaru, Kinerja, AUM (dari 13F, 13D)
Waverton Investment Management Ltd telah mengungkapkan total kepemilikan 105 dalam pengajuan SEC terbaru mereka. Nilai portofolio terbaru dihitung sebesar $ 7,262,316,613 USD. Aset yang Dikelola (AUM) sebenarnya adalah nilai ini ditambah kas (yang tidak diungkapkan). Aset-aset utama Waverton Investment Management Ltd adalah Microsoft Corporation (US:MSFT) , Amazon.com, Inc. (US:AMZN) , Alphabet Inc. (US:GOOGL) , Visa Inc. (US:V) , and Synopsys, Inc. (US:SNPS) . Posisi baru Waverton Investment Management Ltd meliputi: Lennar Corporation (US:LEN) , .
Peningkatan Tertinggi Kuartal Ini
Kami menggunakan perubahan dalam alokasi portofolio karena ini adalah metrik yang paling bermakna. Perubahan dapat disebabkan oleh perdagangan atau perubahan harga saham.
| Keamanan | Saham (MM) |
Nilai (Juta Dolar AS) |
Portfolio % | ΔPorsyento ng Portfolio |
|---|---|---|---|---|
| 4.44 | 246.09 | 3.3886 | 2.8822 | |
| 1.14 | 259.13 | 3.5681 | 1.4111 | |
| 1.11 | 552.81 | 7.6121 | 1.2968 | |
| 0.48 | 253.09 | 3.4850 | 1.1278 | |
| 1.81 | 257.15 | 3.5408 | 1.0754 | |
| 0.58 | 296.63 | 4.0845 | 0.7479 | |
| 1.12 | 244.00 | 3.3598 | 0.6509 | |
| 1.92 | 421.41 | 5.8027 | 0.4950 | |
| 1.05 | 270.59 | 3.7260 | 0.4471 | |
| 0.30 | 232.56 | 3.2022 | 0.4185 |
Penurunan Tertinggi Kuartal Ini
Kami menggunakan perubahan dalam alokasi portofolio karena ini adalah metrik yang paling bermakna. Perubahan dapat disebabkan oleh perdagangan atau perubahan harga saham.
| Keamanan | Saham (MM) |
Nilai (Juta Dolar AS) |
Portfolio % | ΔPorsyento ng Portfolio |
|---|---|---|---|---|
| 0.79 | 126.52 | 1.7422 | -2.0731 | |
| 0.18 | 42.75 | 0.5886 | -1.7574 | |
| 0.58 | 179.75 | 2.4750 | -1.4191 | |
| 0.05 | 24.45 | 0.3367 | -1.4031 | |
| 1.10 | 185.94 | 2.5603 | -0.9126 | |
| 0.67 | 269.52 | 3.7112 | -0.8699 | |
| 1.29 | 282.57 | 3.8909 | -0.6639 | |
| 4.31 | 192.78 | 2.6546 | -0.5673 | |
| 0.93 | 328.34 | 4.5212 | -0.3962 | |
| 2.46 | 83.11 | 1.1444 | -0.3726 |
Pengajuan 13F dan Dana
Formulir ini diajukan pada 2025-08-06 untuk periode pelaporan 2025-06-30. Klik ikon tautan untuk melihat riwayat transaksi selengkapnya.
Tingkatkan ke versi premium untuk membuka data premium dan ekspor ke Excel. ![]() .
.
| Keamanan | Ketik | Harga Saham Rata-rata | Saham (MM) |
ΔSaham (%) |
ΔSaham (%) |
Nilai ($MM) |
Portpolyo (%) |
ΔPortofolio (%) |
|
|---|---|---|---|---|---|---|---|---|---|
| MSFT / Microsoft Corporation | 1.11 | 2.15 | 552.81 | 35.49 | 7.6121 | 1.2968 | |||
| AMZN / Amazon.com, Inc. | 1.92 | 6.58 | 421.41 | 22.88 | 5.8027 | 0.4950 | |||
| GOOGL / Alphabet Inc. | 2.18 | 2.59 | 384.58 | 16.97 | 5.2955 | 0.2068 | |||
| V / Visa Inc. | 0.93 | 2.06 | 328.34 | 3.35 | 4.5212 | -0.3962 | |||
| SNPS / Synopsys, Inc. | 0.58 | 14.99 | 296.63 | 37.60 | 4.0845 | 0.7479 | |||
| CME / CME Group Inc. | 1.06 | -0.39 | 292.16 | 3.48 | 4.0230 | -0.3468 | |||
| IBM / International Business Machines Corporation | 0.96 | 0.06 | 283.32 | 18.51 | 3.9013 | 0.2010 | |||
| MMC / Marsh & McLennan Companies, Inc. | 1.29 | 7.15 | 282.57 | -3.98 | 3.8909 | -0.6639 | |||
| GE / General Electric Company | 1.05 | -0.57 | 270.59 | 27.73 | 3.7260 | 0.4471 | |||
| TMO / Thermo Fisher Scientific Inc. | 0.67 | 11.82 | 269.52 | -8.94 | 3.7112 | -0.8699 | |||
| TSM / Taiwan Semiconductor Manufacturing Company Limited - Depositary Receipt (Common Stock) | 1.14 | 36.29 | 259.13 | 85.94 | 3.5681 | 1.4111 | |||
| AMD / Advanced Micro Devices, Inc. | 1.81 | 16.88 | 257.15 | 61.43 | 3.5408 | 1.0754 | |||
| GEV / GE Vernova Inc. | 0.48 | -4.11 | 253.09 | 66.18 | 3.4850 | 1.1278 | |||
| AXP / American Express Company | 0.77 | -0.12 | 246.44 | 18.36 | 3.3933 | 0.1708 | |||
| IBKR / Interactive Brokers Group, Inc. | 4.44 | 2,148.26 | 246.09 | 652.27 | 3.3886 | 2.8822 | |||
| FERG / Ferguson Enterprises Inc. | 1.12 | 2.53 | 244.00 | 39.41 | 3.3598 | 0.6509 | |||
| INTU / Intuit Inc. | 0.30 | 0.80 | 232.56 | 29.30 | 3.2022 | 0.4185 | |||
| YUMC / Yum China Holdings, Inc. | 4.31 | 7.92 | 192.78 | -7.39 | 2.6546 | -0.5673 | |||
| TEL / TE Connectivity plc | 1.10 | -30.53 | 185.94 | -17.13 | 2.5603 | -0.9126 | |||
| UNH / UnitedHealth Group Incorporated | 0.58 | 19.99 | 179.75 | -28.56 | 2.4750 | -1.4191 | |||
| URI / United Rentals, Inc. | 0.23 | 3.02 | 175.19 | 23.92 | 2.4122 | 0.2242 | |||
| JPM / JPMorgan Chase & Co. | 0.48 | 14.82 | 140.09 | 35.66 | 1.9289 | 0.3307 | |||
| QCOM / QUALCOMM Incorporated | 0.79 | -50.49 | 126.52 | -48.67 | 1.7422 | -2.0731 | |||
| AAPL / Apple Inc. | 0.44 | -5.28 | 91.16 | -12.53 | 1.2553 | -0.3579 | |||
| SLB / Schlumberger Limited | 2.46 | 4.93 | 83.11 | -15.20 | 1.1444 | -0.3726 | |||
| GEHC / GE HealthCare Technologies Inc. | 1.06 | 51.03 | 78.26 | 38.65 | 1.0777 | 0.2040 | |||
| VMC / Vulcan Materials Company | 0.22 | 3.90 | 57.40 | 16.12 | 0.7904 | 0.0253 | |||
| MELI / MercadoLibre, Inc. | 0.02 | 1.56 | 55.76 | 35.96 | 0.7678 | 0.1331 | |||
| ZTS / Zoetis Inc. | 0.34 | 1.07 | 52.99 | -4.31 | 0.7296 | -0.1274 | |||
| AIG / American International Group, Inc. | 0.58 | 3.61 | 49.34 | 1.95 | 0.6794 | -0.0696 | |||
| PLD / Prologis, Inc. | 0.43 | 0.00 | 45.12 | -6.02 | 0.6212 | -0.1218 | |||
| HCA / HCA Healthcare, Inc. | 0.11 | 0.15 | 43.39 | 10.81 | 0.5974 | -0.0086 | |||
| ORLY / O'Reilly Automotive, Inc. | 0.48 | 1,416.97 | 43.07 | -4.54 | 0.5930 | -0.1053 | |||
| TMUS / T-Mobile US, Inc. | 0.18 | -68.45 | 42.75 | -71.80 | 0.5886 | -1.7574 | |||
| VAL / Valaris Limited | 0.96 | -15.18 | 40.41 | -9.11 | 0.5564 | -0.1317 | |||
| NEM / Newmont Corporation | 0.68 | 2.07 | 39.68 | 23.20 | 0.5464 | 0.0479 | |||
| AWK / American Water Works Company, Inc. | 0.28 | 0.00 | 38.87 | -5.76 | 0.5352 | -0.1032 | |||
| DHI / D.R. Horton, Inc. | 0.30 | 14.77 | 38.05 | 16.37 | 0.5240 | 0.0179 | |||
| LNG / Cheniere Energy, Inc. | 0.15 | 0.00 | 35.42 | 5.15 | 0.4877 | -0.0336 | |||
| BRK.A / Berkshire Hathaway Inc. | 0.07 | -6.37 | 31.87 | -14.82 | 0.4389 | -0.1402 | |||
| PEP / PepsiCo, Inc. | 0.21 | -24.54 | 28.36 | -33.56 | 0.3905 | -0.2701 | |||
| LIN / Linde plc | 0.05 | -78.41 | 24.45 | -78.25 | 0.3367 | -1.4031 | |||
| AL / Air Lease Corporation | 0.41 | 7.10 | 23.72 | 29.53 | 0.3266 | 0.0432 | |||
| PWR / Quanta Services, Inc. | 0.06 | 0.00 | 22.93 | 48.71 | 0.3158 | 0.0771 | |||
| GLD / SPDR Gold Trust | 0.07 | 1.46 | 22.01 | 7.31 | 0.3031 | -0.0144 | |||
| SGOL / abrdn Gold ETF Trust - abrdn Physical Gold Shares ETF | 0.62 | 2.07 | 19.71 | 8.00 | 0.2715 | -0.0111 | |||
| COF / Capital One Financial Corporation | 0.08 | 122.83 | 16.86 | 164.40 | 0.2321 | 0.1334 | |||
| COST / Costco Wholesale Corporation | 0.01 | 0.00 | 13.52 | 4.63 | 0.1861 | -0.0138 | |||
| EL / The Estée Lauder Companies Inc. | 0.15 | 50.15 | 12.25 | 83.74 | 0.1686 | 0.0655 | |||
| RNR / RenaissanceRe Holdings Ltd. | 0.05 | 5.50 | 11.01 | 6.84 | 0.1515 | -0.0079 | |||
| TPL / Texas Pacific Land Corporation | 0.01 | 0.00 | 7.74 | -20.22 | 0.1066 | -0.0436 | |||
| HTHT / H World Group Limited - Depositary Receipt (Common Stock) | 0.22 | 7.17 | 7.33 | -1.74 | 0.1010 | -0.0145 | |||
| GOOG / Alphabet Inc. | 0.04 | -3.47 | 6.74 | 9.66 | 0.0929 | -0.0023 | |||
| FPA / First Trust Exchange-Traded AlphaDEX Fund II - First Trust Asia Pacific Ex-Japan AlphaDEX Fund | 0.17 | 5.33 | 6.03 | 31.90 | 0.0830 | 0.0123 | |||
| FTGC / First Trust Exchange-Traded Fund VII - First Trust Global Tactical Commodity Strategy Fund | 0.21 | 3.28 | 5.30 | -0.13 | 0.0729 | -0.0092 | |||
| KO / The Coca-Cola Company | 0.07 | -39.89 | 4.72 | -40.65 | 0.0650 | -0.0581 | |||
| INFY / Infosys Limited - Depositary Receipt (Common Stock) | 0.21 | -12.53 | 3.92 | -11.28 | 0.0539 | -0.0144 | |||
| NVDA / NVIDIA Corporation | 0.02 | 7.11 | 3.03 | 55.46 | 0.0418 | 0.0116 | |||
| MA / Mastercard Incorporated | 0.00 | -1.19 | 2.34 | 1.25 | 0.0322 | -0.0035 | |||
| HDB / HDFC Bank Limited - Depositary Receipt (Common Stock) | 0.03 | -0.80 | 1.93 | 14.46 | 0.0266 | 0.0005 | |||
| BABA / Alibaba Group Holding Limited - Depositary Receipt (Common Stock) | 0.02 | 0.00 | 1.92 | -14.22 | 0.0265 | -0.0082 | |||
| XOM / Exxon Mobil Corporation | 0.02 | -15.00 | 1.82 | -23.01 | 0.0250 | -0.0115 | |||
| CVX / Chevron Corporation | 0.01 | -9.18 | 1.44 | -22.32 | 0.0199 | -0.0089 | |||
| WRB / W. R. Berkley Corporation | 0.02 | -22.42 | 1.23 | -19.92 | 0.0169 | -0.0068 | |||
| DAL / Delta Air Lines, Inc. | 0.02 | 1.11 | 0.0152 | 0.0152 | |||||
| LEN / Lennar Corporation | 0.01 | 1.05 | 0.0145 | 0.0145 | |||||
| DGRS / WisdomTree Trust - WisdomTree U.S. SmallCap Quality Dividend Growth Fund | 0.02 | 0.00 | 1.04 | 14.19 | 0.0143 | 0.0002 | |||
| LMT / Lockheed Martin Corporation | 0.00 | 0.00 | 0.99 | 3.76 | 0.0137 | -0.0011 | |||
| ICE / Intercontinental Exchange, Inc. | 0.01 | 0.00 | 0.97 | 6.39 | 0.0133 | -0.0008 | |||
| PG / The Procter & Gamble Company | 0.01 | 0.00 | 0.94 | -6.53 | 0.0130 | -0.0026 | |||
| WM / Waste Management, Inc. | 0.00 | 8.21 | 0.93 | 6.89 | 0.0128 | -0.0007 | |||
| UNP / Union Pacific Corporation | 0.00 | -16.05 | 0.92 | -18.22 | 0.0127 | -0.0048 | |||
| FNV / Franco-Nevada Corporation | 0.01 | 0.00 | 0.87 | 4.19 | 0.0120 | -0.0009 | |||
| VZ / Verizon Communications Inc. | 0.02 | -2.20 | 0.87 | -6.78 | 0.0119 | -0.0025 | |||
| BA / The Boeing Company | 0.00 | 0.85 | 0.0117 | 0.0117 | |||||
| CRM / Salesforce, Inc. | 0.00 | 0.00 | 0.84 | 1.58 | 0.0115 | -0.0012 | |||
| QQQ / Invesco QQQ Trust, Series 1 | 0.00 | 0.00 | 0.78 | 17.72 | 0.0108 | 0.0005 | |||
| MRK / Merck & Co., Inc. | 0.01 | 0.00 | 0.78 | -11.84 | 0.0108 | -0.0030 | |||
| BAP / Credicorp Ltd. | 0.00 | 0.00 | 0.72 | 20.34 | 0.0099 | 0.0006 | |||
| CRH / CRH plc | 0.01 | 0.00 | 0.71 | 4.28 | 0.0097 | -0.0008 | |||
| DXJ / WisdomTree Trust - WisdomTree Japan Hedged Equity Fund | 0.01 | 2.75 | 0.68 | 6.56 | 0.0094 | -0.0005 | |||
| HD / The Home Depot, Inc. | 0.00 | -5.25 | 0.66 | -5.30 | 0.0091 | -0.0017 | |||
| AVGO / Broadcom Inc. | 0.00 | 0.00 | 0.60 | 64.66 | 0.0083 | 0.0026 | |||
| DHR / Danaher Corporation | 0.00 | 12.88 | 0.55 | 8.76 | 0.0075 | -0.0003 | |||
| FKU / First Trust Exchange-Traded AlphaDEX Fund II - First Trust United Kingdom AlphaDEX Fund | 0.01 | 17.39 | 0.54 | 36.80 | 0.0074 | 0.0013 | |||
| SYK / Stryker Corporation | 0.00 | -1.81 | 0.54 | 4.27 | 0.0074 | -0.0006 | |||
| CP / Canadian Pacific Kansas City Limited | 0.01 | 11.69 | 0.53 | 26.24 | 0.0074 | 0.0008 | |||
| SPGI / S&P Global Inc. | 0.00 | 0.00 | 0.53 | 3.89 | 0.0074 | -0.0006 | |||
| IVV / iShares Trust - iShares Core S&P 500 ETF | 0.00 | 27.13 | 0.51 | 40.61 | 0.0070 | 0.0014 | |||
| IWF / iShares Trust - iShares Russell 1000 Growth ETF | 0.00 | 0.00 | 0.45 | 17.71 | 0.0062 | 0.0003 | |||
| DOV / Dover Corporation | 0.00 | 0.00 | 0.45 | 4.19 | 0.0062 | -0.0005 | |||
| NFLX / Netflix, Inc. | 0.00 | 0.42 | 0.0058 | 0.0058 | |||||
| CL / Colgate-Palmolive Company | 0.00 | -18.00 | 0.41 | -20.38 | 0.0057 | -0.0024 | |||
| AVY / Avery Dennison Corporation | 0.00 | -20.41 | 0.41 | -21.61 | 0.0056 | -0.0024 | |||
| HON / Honeywell International Inc. | 0.00 | 0.00 | 0.40 | 10.00 | 0.0055 | -0.0001 | |||
| ACN / Accenture plc | 0.00 | -0.43 | 0.34 | -4.72 | 0.0047 | -0.0009 | |||
| OXY / Occidental Petroleum Corporation | 0.01 | 0.32 | 0.0043 | 0.0043 | |||||
| BAC / Bank of America Corporation | 0.01 | 0.00 | 0.31 | 13.24 | 0.0043 | 0.0000 | |||
| TJX / The TJX Companies, Inc. | 0.00 | 0.00 | 0.30 | 1.36 | 0.0041 | -0.0004 | |||
| RTX / RTX Corporation | 0.00 | 0.00 | 0.29 | 10.00 | 0.0039 | -0.0001 | |||
| VIG / Vanguard Specialized Funds - Vanguard Dividend Appreciation ETF | 0.00 | 0.00 | 0.24 | 5.33 | 0.0033 | -0.0002 | |||
| GILD / Gilead Sciences, Inc. | 0.00 | 0.00 | 0.22 | -1.34 | 0.0031 | -0.0004 | |||
| CAT / Caterpillar Inc. | 0.00 | 0.22 | 0.0030 | 0.0030 | |||||
| DTD / WisdomTree Trust - WisdomTree U.S. Total Dividend Fund | 0.00 | 0.00 | 0.21 | 3.41 | 0.0029 | -0.0003 | |||
| MCD / McDonald's Corporation | 0.00 | 0.00 | 0.20 | -6.42 | 0.0028 | -0.0006 | |||
| C / Citigroup Inc. | 0.00 | -100.00 | 0.00 | 0.0000 | |||||
| AMGN / Amgen Inc. | 0.00 | -100.00 | 0.00 | 0.0000 | |||||
| EOG / EOG Resources, Inc. | 0.00 | -100.00 | 0.00 | 0.0000 |