Mga Batayang Estadistika
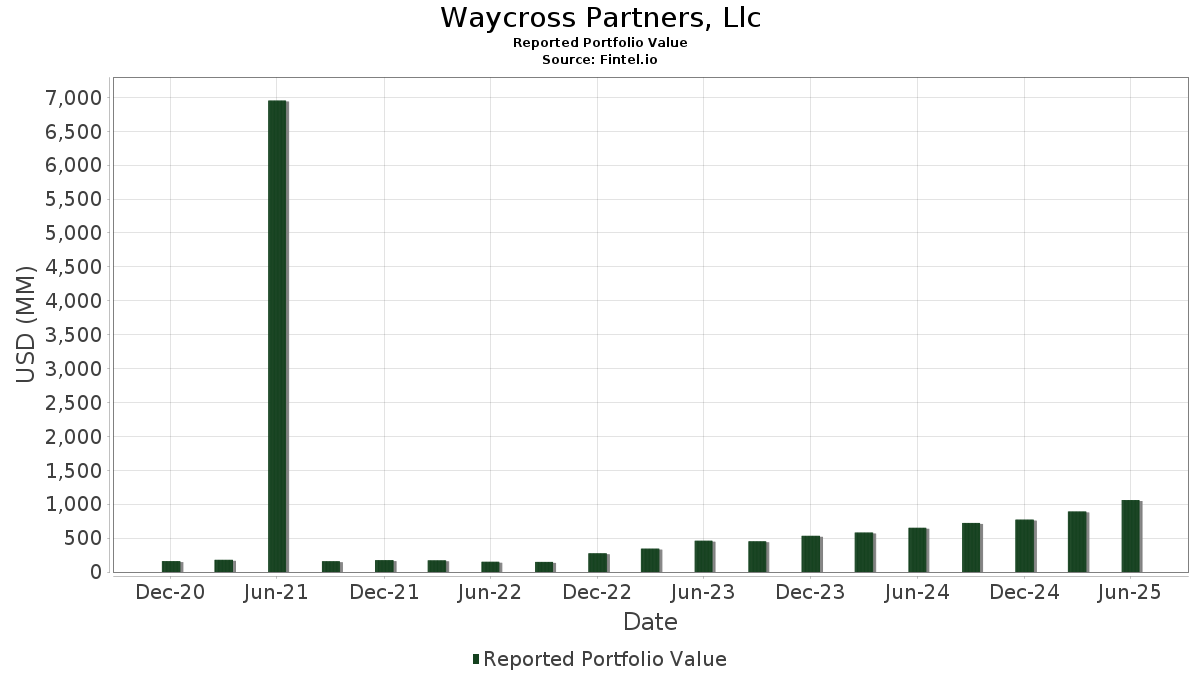
| Nilai Portofolio | $ 1,061,388,674 |
| Posisi Saat Ini | 93 |
Kepemilikan Terbaru, Kinerja, AUM (dari 13F, 13D)
Waycross Partners, Llc telah mengungkapkan total kepemilikan 93 dalam pengajuan SEC terbaru mereka. Nilai portofolio terbaru dihitung sebesar $ 1,061,388,674 USD. Aset yang Dikelola (AUM) sebenarnya adalah nilai ini ditambah kas (yang tidak diungkapkan). Aset-aset utama Waycross Partners, Llc adalah NVIDIA Corporation (US:NVDA) , Microsoft Corporation (US:MSFT) , Meta Platforms, Inc. (US:META) , Apple Inc. (US:AAPL) , and Alphabet Inc. (US:GOOGL) . Posisi baru Waycross Partners, Llc meliputi: NXP Semiconductors N.V. (US:NXPI) , The Southern Company (US:SO) , Uber Technologies, Inc. (US:UBER) , Exact Sciences Corporation (US:EXAS) , and Entergy Corporation (US:ETR) .
Peningkatan Tertinggi Kuartal Ini
Kami menggunakan perubahan dalam alokasi portofolio karena ini adalah metrik yang paling bermakna. Perubahan dapat disebabkan oleh perdagangan atau perubahan harga saham.
| Keamanan | Saham (MM) |
Nilai (Juta Dolar AS) |
Portfolio % | ΔPorsyento ng Portfolio |
|---|---|---|---|---|
| 0.11 | 24.04 | 2.2651 | 2.2651 | |
| 0.38 | 18.81 | 1.7723 | 1.7723 | |
| 0.50 | 79.60 | 7.4993 | 1.5787 | |
| 0.16 | 14.56 | 1.3718 | 1.3718 | |
| 0.14 | 38.17 | 3.5962 | 1.1288 | |
| 0.15 | 75.06 | 7.0717 | 0.9218 | |
| 0.09 | 64.01 | 6.0309 | 0.6038 | |
| 0.06 | 45.30 | 4.2684 | 0.4750 | |
| 0.04 | 3.27 | 0.3077 | 0.3077 | |
| 0.04 | 3.10 | 0.2925 | 0.2925 |
Penurunan Tertinggi Kuartal Ini
Kami menggunakan perubahan dalam alokasi portofolio karena ini adalah metrik yang paling bermakna. Perubahan dapat disebabkan oleh perdagangan atau perubahan harga saham.
| Keamanan | Saham (MM) |
Nilai (Juta Dolar AS) |
Portfolio % | ΔPorsyento ng Portfolio |
|---|---|---|---|---|
| 0.00 | 1.17 | 0.1102 | -1.9837 | |
| 0.01 | 1.56 | 0.1470 | -1.8372 | |
| 0.03 | 3.43 | 0.3233 | -1.6766 | |
| 0.25 | 50.64 | 4.7713 | -1.3085 | |
| 0.11 | 18.42 | 1.7354 | -1.0895 | |
| 0.17 | 31.43 | 2.9614 | -0.7328 | |
| 0.04 | 23.35 | 2.2002 | -0.5880 | |
| 0.11 | 23.78 | 2.2407 | -0.4589 | |
| 0.06 | 32.84 | 3.0936 | -0.3723 | |
| 0.17 | 17.02 | 1.6038 | -0.3568 |
Pengajuan 13F dan Dana
Formulir ini diajukan pada 2025-07-15 untuk periode pelaporan 2025-06-30. Klik ikon tautan untuk melihat riwayat transaksi selengkapnya.
Tingkatkan ke versi premium untuk membuka data premium dan ekspor ke Excel. ![]() .
.
| Keamanan | Ketik | Harga Saham Rata-rata | Saham (MM) |
ΔSaham (%) |
ΔSaham (%) |
Nilai ($MM) |
Portpolyo (%) |
ΔPortofolio (%) |
|
|---|---|---|---|---|---|---|---|---|---|
| NVDA / NVIDIA Corporation | 0.50 | 3.39 | 79.60 | 50.71 | 7.4993 | 1.5787 | |||
| MSFT / Microsoft Corporation | 0.15 | 3.25 | 75.06 | 36.82 | 7.0717 | 0.9218 | |||
| META / Meta Platforms, Inc. | 0.09 | 3.25 | 64.01 | 32.22 | 6.0309 | 0.6038 | |||
| AAPL / Apple Inc. | 0.25 | 1.09 | 50.64 | -6.62 | 4.7713 | -1.3085 | |||
| GOOGL / Alphabet Inc. | 0.27 | 5.44 | 46.99 | 20.16 | 4.4276 | 0.0435 | |||
| AMZN / Amazon.com, Inc. | 0.21 | 2.78 | 45.63 | 18.52 | 4.2987 | -0.0167 | |||
| GS / The Goldman Sachs Group, Inc. | 0.06 | 3.34 | 45.30 | 33.88 | 4.2684 | 0.4750 | |||
| BA / The Boeing Company | 0.19 | 3.43 | 39.25 | 27.07 | 3.6982 | 0.2354 | |||
| AVGO / Broadcom Inc. | 0.14 | 5.33 | 38.17 | 73.42 | 3.5962 | 1.1288 | |||
| WFC / Wells Fargo & Company | 0.47 | 3.27 | 37.61 | 15.26 | 3.5432 | -0.1146 | |||
| C / Citigroup Inc. | 0.40 | 5.17 | 34.42 | 26.10 | 3.2426 | 0.1831 | |||
| MA / Mastercard Incorporated | 0.06 | 3.59 | 32.84 | 6.20 | 3.0936 | -0.3723 | |||
| ABBV / AbbVie Inc. | 0.17 | 7.66 | 31.43 | -4.62 | 2.9614 | -0.7328 | |||
| HON / Honeywell International Inc. | 0.13 | 3.80 | 30.08 | 14.16 | 2.8341 | -0.1198 | |||
| ADI / Analog Devices, Inc. | 0.13 | 3.60 | 29.91 | 22.27 | 2.8181 | 0.0757 | |||
| CSX / CSX Corporation | 0.79 | 3.43 | 25.74 | 14.67 | 2.4251 | -0.0911 | |||
| CRM / Salesforce, Inc. | 0.09 | 3.80 | 24.20 | 5.48 | 2.2804 | -0.2920 | |||
| NXPI / NXP Semiconductors N.V. | 0.11 | 24.04 | 2.2651 | 2.2651 | |||||
| LOW / Lowe's Companies, Inc. | 0.11 | 3.81 | 23.78 | -1.25 | 2.2407 | -0.4589 | |||
| ISRG / Intuitive Surgical, Inc. | 0.04 | -14.43 | 23.35 | -6.11 | 2.2002 | -0.5880 | |||
| SYY / Sysco Corporation | 0.30 | 3.34 | 22.96 | 4.30 | 2.1632 | -0.3045 | |||
| IDXX / IDEXX Laboratories, Inc. | 0.04 | 3.80 | 22.80 | 32.57 | 2.1481 | 0.2202 | |||
| NOW / ServiceNow, Inc. | 0.02 | 3.17 | 18.95 | 33.23 | 1.7857 | 0.1910 | |||
| DAL / Delta Air Lines, Inc. | 0.38 | 18.81 | 1.7723 | 1.7723 | |||||
| BDX / Becton, Dickinson and Company | 0.11 | -2.80 | 18.42 | -26.91 | 1.7354 | -1.0895 | |||
| TGT / Target Corporation | 0.17 | 2.96 | 17.02 | -2.67 | 1.6038 | -0.3568 | |||
| ADBE / Adobe Inc. | 0.04 | 3.80 | 16.44 | 4.70 | 1.5487 | -0.2112 | |||
| EOG / EOG Resources, Inc. | 0.13 | 3.80 | 15.46 | -3.19 | 1.4565 | -0.3335 | |||
| SO / The Southern Company | 0.16 | 14.56 | 1.3718 | 1.3718 | |||||
| PYPL / PayPal Holdings, Inc. | 0.19 | 2.97 | 13.81 | 17.28 | 1.3010 | -0.0189 | |||
| COR / Cencora, Inc. | 0.01 | 0.00 | 4.50 | 7.82 | 0.4238 | -0.0439 | |||
| DIS / The Walt Disney Company | 0.04 | 0.00 | 4.34 | 25.65 | 0.4089 | 0.0217 | |||
| TJX / The TJX Companies, Inc. | 0.03 | 0.00 | 3.70 | 1.37 | 0.3490 | -0.0606 | |||
| AGG / iShares Trust - iShares Core U.S. Aggregate Bond ETF | 0.04 | 0.00 | 3.68 | 0.30 | 0.3468 | -0.0647 | |||
| DG / Dollar General Corporation | 0.03 | -85.21 | 3.43 | -80.77 | 0.3233 | -1.6766 | |||
| UBER / Uber Technologies, Inc. | 0.04 | 3.27 | 0.3077 | 0.3077 | |||||
| V / Visa Inc. | 0.01 | 0.00 | 3.20 | 1.30 | 0.3011 | -0.0525 | |||
| LLY / Eli Lilly and Company | 0.00 | 0.00 | 3.12 | -5.60 | 0.2938 | -0.0766 | |||
| CVS / CVS Health Corporation | 0.04 | 3.10 | 0.2925 | 0.2925 | |||||
| ADSK / Autodesk, Inc. | 0.01 | 0.00 | 3.10 | 18.22 | 0.2917 | -0.0018 | |||
| COST / Costco Wholesale Corporation | 0.00 | 0.00 | 2.97 | 4.65 | 0.2798 | -0.0383 | |||
| AMD / Advanced Micro Devices, Inc. | 0.02 | 0.00 | 2.84 | 38.17 | 0.2674 | 0.0370 | |||
| CCL / Carnival Corporation & plc | 0.10 | 0.00 | 2.81 | 43.98 | 0.2649 | 0.0460 | |||
| CMG / Chipotle Mexican Grill, Inc. | 0.05 | 0.00 | 2.81 | 11.83 | 0.2645 | -0.0169 | |||
| ORLY / O'Reilly Automotive, Inc. | 0.03 | 1,400.00 | 2.70 | -5.65 | 0.2548 | -0.0664 | |||
| DASH / DoorDash, Inc. | 0.01 | 0.00 | 2.47 | 34.92 | 0.2323 | 0.0274 | |||
| BAC / Bank of America Corporation | 0.05 | 0.00 | 2.37 | 13.42 | 0.2229 | -0.0110 | |||
| KMX / CarMax, Inc. | 0.03 | 0.00 | 2.02 | -13.74 | 0.1900 | -0.0721 | |||
| DXCM / DexCom, Inc. | 0.02 | 0.00 | 1.75 | 27.84 | 0.1645 | 0.0114 | |||
| UNH / UnitedHealth Group Incorporated | 0.01 | -85.20 | 1.56 | -91.19 | 0.1470 | -1.8372 | |||
| EXAS / Exact Sciences Corporation | 0.03 | 1.33 | 0.1252 | 0.1252 | |||||
| MCD / McDonald's Corporation | 0.00 | -93.30 | 1.17 | -93.74 | 0.1102 | -1.9837 | |||
| CAT / Caterpillar Inc. | 0.00 | 0.00 | 1.05 | 17.75 | 0.0988 | -0.0011 | |||
| DE / Deere & Company | 0.00 | 0.00 | 0.70 | 8.35 | 0.0661 | -0.0065 | |||
| PG / The Procter & Gamble Company | 0.00 | 0.00 | 0.69 | -6.54 | 0.0647 | -0.0176 | |||
| LMT / Lockheed Martin Corporation | 0.00 | 0.00 | 0.67 | 3.71 | 0.0633 | -0.0093 | |||
| JPM / JPMorgan Chase & Co. | 0.00 | 0.65 | 0.0614 | 0.0614 | |||||
| XOM / Exxon Mobil Corporation | 0.01 | 186.99 | 0.65 | 160.48 | 0.0609 | 0.0331 | |||
| DHR / Danaher Corporation | 0.00 | 0.00 | 0.64 | -3.60 | 0.0605 | -0.0142 | |||
| GILD / Gilead Sciences, Inc. | 0.01 | 0.64 | 0.0599 | 0.0599 | |||||
| AMGN / Amgen Inc. | 0.00 | 0.00 | 0.63 | -10.29 | 0.0592 | -0.0194 | |||
| PEP / PepsiCo, Inc. | 0.00 | 0.00 | 0.59 | -11.90 | 0.0551 | -0.0194 | |||
| CL / Colgate-Palmolive Company | 0.01 | 0.00 | 0.55 | -3.02 | 0.0514 | -0.0116 | |||
| ETR / Entergy Corporation | 0.01 | 0.48 | 0.0456 | 0.0456 | |||||
| RTX / RTX Corporation | 0.00 | 0.00 | 0.46 | 10.31 | 0.0433 | -0.0034 | |||
| NKE / NIKE, Inc. | 0.01 | 0.00 | 0.44 | 11.96 | 0.0415 | -0.0026 | |||
| AEP / American Electric Power Company, Inc. | 0.00 | 0.43 | 0.0409 | 0.0409 | |||||
| CSCO / Cisco Systems, Inc. | 0.01 | 0.42 | 0.0397 | 0.0397 | |||||
| TFC / Truist Financial Corporation | 0.01 | 0.41 | 0.0386 | 0.0386 | |||||
| KEY / KeyCorp | 0.02 | 0.40 | 0.0373 | 0.0373 | |||||
| WMT / Walmart Inc. | 0.00 | 0.00 | 0.39 | 11.40 | 0.0368 | -0.0025 | |||
| XEL / Xcel Energy Inc. | 0.01 | 0.38 | 0.0356 | 0.0356 | |||||
| NEE / NextEra Energy, Inc. | 0.01 | 0.37 | 0.0353 | 0.0353 | |||||
| ORCL / Oracle Corporation | 0.00 | 0.37 | 0.0350 | 0.0350 | |||||
| CME / CME Group Inc. | 0.00 | 0.37 | 0.0349 | 0.0349 | |||||
| ED / Consolidated Edison, Inc. | 0.00 | 0.36 | 0.0341 | 0.0341 | |||||
| DUK / Duke Energy Corporation | 0.00 | 0.36 | 0.0340 | 0.0340 | |||||
| KMB / Kimberly-Clark Corporation | 0.00 | 0.36 | 0.0336 | 0.0336 | |||||
| MRK / Merck & Co., Inc. | 0.00 | -83.64 | 0.36 | -85.58 | 0.0336 | -0.2431 | |||
| PSX / Phillips 66 | 0.00 | 0.35 | 0.0333 | 0.0333 | |||||
| FITB / Fifth Third Bancorp | 0.01 | 0.35 | 0.0332 | 0.0332 | |||||
| EIX / Edison International | 0.01 | 0.35 | 0.0329 | 0.0329 | |||||
| ABT / Abbott Laboratories | 0.00 | -41.97 | 0.34 | -40.49 | 0.0319 | -0.0319 | |||
| USB / U.S. Bancorp | 0.01 | 0.32 | 0.0299 | 0.0299 | |||||
| FE / FirstEnergy Corp. | 0.01 | 0.30 | 0.0283 | 0.0283 | |||||
| PRU / Prudential Financial, Inc. | 0.00 | 0.30 | 0.0279 | 0.0279 | |||||
| PM / Philip Morris International Inc. | 0.00 | 0.00 | 0.29 | 14.84 | 0.0278 | -0.0010 | |||
| CVX / Chevron Corporation | 0.00 | 0.28 | 0.0265 | 0.0265 | |||||
| VZ / Verizon Communications Inc. | 0.01 | 0.28 | 0.0265 | 0.0265 | |||||
| JNJ / Johnson & Johnson | 0.00 | 0.00 | 0.26 | -7.83 | 0.0245 | -0.0071 | |||
| KHC / The Kraft Heinz Company | 0.01 | 0.23 | 0.0220 | 0.0220 | |||||
| BMY / Bristol-Myers Squibb Company | 0.00 | 0.00 | 0.21 | -24.19 | 0.0199 | -0.0113 | |||
| CAG / Conagra Brands, Inc. | 0.01 | 0.21 | 0.0195 | 0.0195 |