Mga Batayang Estadistika
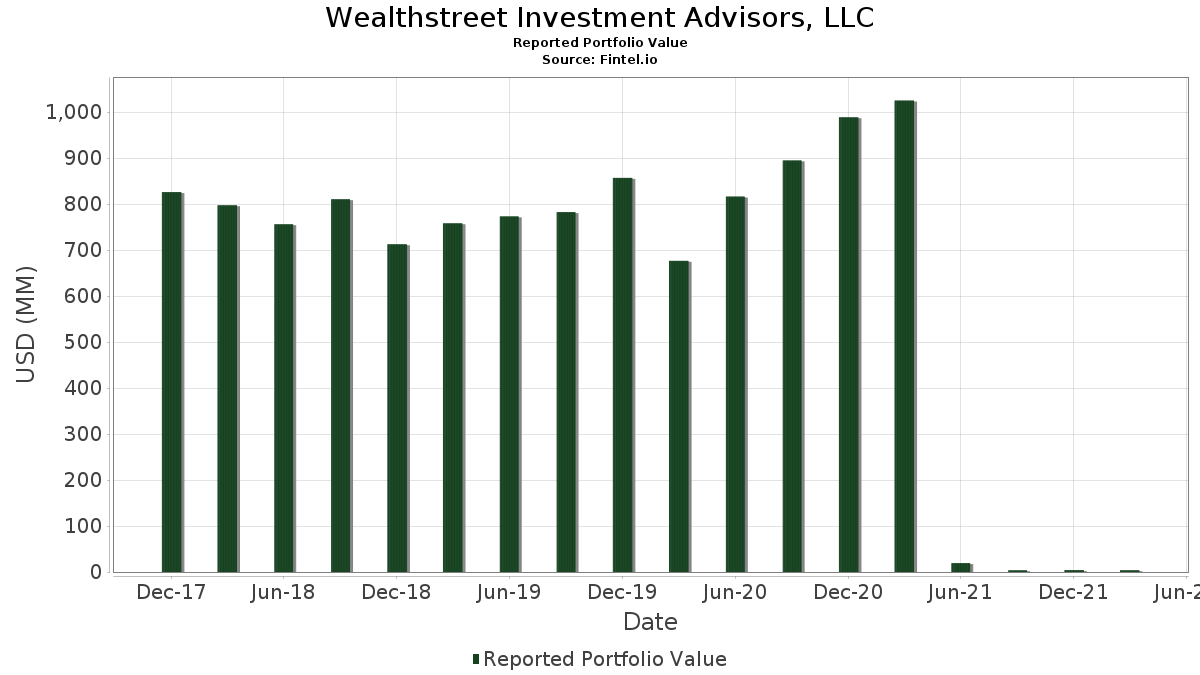
| Nilai Portofolio | $ 3,714,000 |
| Posisi Saat Ini | 71 |
Kepemilikan Terbaru, Kinerja, AUM (dari 13F, 13D)
Wealthstreet Investment Advisors, LLC telah mengungkapkan total kepemilikan 71 dalam pengajuan SEC terbaru mereka. Nilai portofolio terbaru dihitung sebesar $ 3,714,000 USD. Aset yang Dikelola (AUM) sebenarnya adalah nilai ini ditambah kas (yang tidak diungkapkan). Aset-aset utama Wealthstreet Investment Advisors, LLC adalah NVIDIA Corporation (US:NVDA) , Amazon.com, Inc. (US:AMZN) , Advanced Micro Devices, Inc. (US:AMD) , Intel Corporation (US:INTC) , and Apple Inc. (US:AAPL) .
Peningkatan Tertinggi Kuartal Ini
Kami menggunakan perubahan dalam alokasi portofolio karena ini adalah metrik yang paling bermakna. Perubahan dapat disebabkan oleh perdagangan atau perubahan harga saham.
| Keamanan | Saham (MM) |
Nilai (Juta Dolar AS) |
Portfolio % | ΔPorsyento ng Portfolio |
|---|---|---|---|---|
| 0.00 | 0.02 | 0.4308 | 0.4308 | |
| 0.00 | 0.23 | 6.1389 | 0.3901 | |
| 0.00 | 0.17 | 4.6042 | 0.3111 | |
| 0.00 | 0.06 | 1.6694 | 0.2877 | |
| 0.00 | 0.20 | 5.3312 | 0.2485 | |
| 0.00 | 0.15 | 4.0657 | 0.2414 | |
| 0.00 | 0.17 | 4.4965 | 0.2034 | |
| 0.00 | 0.02 | 0.6462 | 0.2021 | |
| 0.00 | 0.07 | 1.7771 | 0.1980 | |
| 0.00 | 0.06 | 1.6424 | 0.1374 |
Penurunan Tertinggi Kuartal Ini
Kami menggunakan perubahan dalam alokasi portofolio karena ini adalah metrik yang paling bermakna. Perubahan dapat disebabkan oleh perdagangan atau perubahan harga saham.
| Keamanan | Saham (MM) |
Nilai (Juta Dolar AS) |
Portfolio % | ΔPorsyento ng Portfolio |
|---|---|---|---|---|
| 0.00 | 0.21 | 5.7351 | -0.4826 | |
| 0.00 | 0.12 | 3.1502 | -0.4274 | |
| 0.00 | 0.12 | 3.2849 | -0.3914 | |
| 0.00 | 0.00 | -0.3454 | ||
| 0.00 | 0.04 | 1.0232 | -0.3339 | |
| 0.00 | 0.07 | 1.7501 | -0.2237 | |
| 0.00 | 0.14 | 3.7695 | -0.2028 | |
| 0.00 | 0.09 | 2.4502 | -0.1898 | |
| 0.00 | 0.06 | 1.6694 | -0.1564 | |
| 0.00 | 0.03 | 0.8347 | -0.1522 |
Pengajuan 13F dan Dana
Formulir ini diajukan pada 2022-04-25 untuk periode pelaporan 2022-03-31. Klik ikon tautan untuk melihat riwayat transaksi selengkapnya.
Tingkatkan ke versi premium untuk membuka data premium dan ekspor ke Excel. ![]() .
.
| Keamanan | Ketik | Harga Saham Rata-rata | Saham (MM) |
ΔSaham (%) |
ΔSaham (%) |
Nilai ($MM) |
Portpolyo (%) |
ΔPortofolio (%) |
|
|---|---|---|---|---|---|---|---|---|---|
| NVDA / NVIDIA Corporation | 0.00 | 0.00 | 0.43 | -7.31 | 11.6047 | 0.1318 | |||
| AMZN / Amazon.com, Inc. | 0.00 | 0.00 | 0.23 | -2.15 | 6.1389 | 0.3901 | |||
| AMD / Advanced Micro Devices, Inc. | 0.00 | 11.20 | 0.21 | -15.48 | 5.7351 | -0.4826 | |||
| INTC / Intel Corporation | 0.00 | 0.00 | 0.20 | -3.88 | 5.3312 | 0.2485 | |||
| AAPL / Apple Inc. | 0.00 | 0.00 | 0.17 | -1.72 | 4.6042 | 0.3111 | |||
| GOOGL / Alphabet Inc. | 0.00 | 0.00 | 0.17 | -4.02 | 4.4965 | 0.2034 | |||
| IBM / International Business Machines Corporation | 0.00 | 0.00 | 0.15 | -2.58 | 4.0657 | 0.2414 | |||
| QQQ / Invesco QQQ Trust, Series 1 | 0.00 | 0.00 | 0.14 | -8.50 | 3.7695 | -0.0055 | |||
| SMH / VanEck ETF Trust - VanEck Semiconductor ETF | 0.00 | 0.00 | 0.14 | -13.04 | 3.7695 | -0.2028 | |||
| MRVL / Marvell Technology, Inc. | 0.00 | 0.00 | 0.12 | -18.12 | 3.2849 | -0.3914 | |||
| NKE / NIKE, Inc. | 0.00 | 0.00 | 0.12 | -19.31 | 3.1502 | -0.4274 | |||
| VUG / Vanguard Index Funds - Vanguard Growth ETF | 0.00 | 0.00 | 0.10 | -11.21 | 2.5579 | -0.0821 | |||
| IBB / iShares Trust - iShares Biotechnology ETF | 0.00 | 0.00 | 0.09 | -14.95 | 2.4502 | -0.1898 | |||
| BA / The Boeing Company | 0.00 | 0.00 | 0.08 | -4.94 | 2.0732 | 0.0747 | |||
| BABA / Alibaba Group Holding Limited - Depositary Receipt (Common Stock) | 0.00 | 0.00 | 0.07 | -7.69 | 1.9386 | 0.0141 | |||
| LVS / Las Vegas Sands Corp. | 0.00 | 0.00 | 0.07 | 3.13 | 1.7771 | 0.1980 | |||
| T / AT&T Inc. | 0.00 | -15.38 | 0.07 | -18.75 | 1.7501 | -0.2237 | |||
| CRM / Salesforce, Inc. | 0.00 | 0.00 | 0.06 | -16.22 | 1.6694 | -0.1564 | |||
| PANW / Palo Alto Networks, Inc. | 0.00 | 0.00 | 0.06 | 10.71 | 1.6694 | 0.2877 | |||
| VTV / Vanguard Index Funds - Vanguard Value ETF | 0.00 | 0.00 | 0.06 | 0.00 | 1.6424 | 0.1374 | |||
| GMF / SPDR Index Shares Funds - SPDR S&P Emerging Asia Pacific ETF | 0.00 | 0.00 | 0.06 | -9.84 | 1.4809 | -0.0242 | |||
| EPI / WisdomTree Trust - WisdomTree India Earnings Fund | 0.00 | 0.00 | 0.05 | -1.82 | 1.4540 | 0.0969 | |||
| QCOM / QUALCOMM Incorporated | 0.00 | 0.00 | 0.05 | -17.19 | 1.4270 | -0.1520 | |||
| MSFT / Microsoft Corporation | 0.00 | 0.00 | 0.05 | -7.55 | 1.3193 | 0.0117 | |||
| IWF / iShares Trust - iShares Russell 1000 Growth ETF | 0.00 | 0.00 | 0.04 | -10.20 | 1.1847 | -0.0243 | |||
| FXI / iShares Trust - iShares China Large-Cap ETF | 0.00 | -20.00 | 0.04 | -30.91 | 1.0232 | -0.3339 | |||
| LQD / iShares Trust - iShares iBoxx $ Investment Grade Corporate Bond ETF | 0.00 | 0.00 | 0.04 | -10.00 | 0.9693 | -0.0176 | |||
| CSCO / Cisco Systems, Inc. | 0.00 | 0.00 | 0.04 | -12.50 | 0.9424 | -0.0445 | |||
| TGT / Target Corporation | 0.00 | 0.00 | 0.03 | -8.11 | 0.9155 | 0.0026 | |||
| MU / Micron Technology, Inc. | 0.00 | 0.00 | 0.03 | -16.22 | 0.8347 | -0.0782 | |||
| VFC / V.F. Corporation | 0.00 | 0.00 | 0.03 | -22.50 | 0.8347 | -0.1522 | |||
| IHF / iShares Trust - iShares U.S. Healthcare Providers ETF | 0.00 | 0.00 | 0.03 | -3.45 | 0.7539 | 0.0384 | |||
| DIS / The Walt Disney Company | 0.00 | 0.00 | 0.03 | -12.90 | 0.7270 | -0.0379 | |||
| RTX / RTX Corporation | 0.00 | 0.00 | 0.03 | 13.64 | 0.6731 | 0.1303 | |||
| CVX / Chevron Corporation | 0.00 | 0.00 | 0.02 | 33.33 | 0.6462 | 0.2021 | |||
| STZ / Constellation Brands, Inc. | 0.00 | 0.00 | 0.02 | -8.00 | 0.6193 | 0.0025 | |||
| SPEM / SPDR Index Shares Funds - SPDR Portfolio Emerging Markets ETF | 0.00 | 0.00 | 0.02 | -8.00 | 0.6193 | 0.0025 | |||
| AMJ / JPMorgan Alerian MLP Index ETN - Corporate Bond/Note | 0.00 | 0.00 | 0.02 | -11.54 | 0.6193 | -0.0222 | |||
| TTWO / Take-Two Interactive Software, Inc. | 0.00 | 0.00 | 0.02 | -14.81 | 0.6193 | -0.0469 | |||
| MCD / McDonald's Corporation | 0.00 | 0.00 | 0.02 | -4.76 | 0.5385 | 0.0204 | |||
| AGG / iShares Trust - iShares Core U.S. Aggregate Bond ETF | 0.00 | 0.00 | 0.02 | -9.09 | 0.5385 | -0.0043 | |||
| EXPE / Expedia Group, Inc. | 0.00 | 0.00 | 0.02 | 11.11 | 0.5385 | 0.0944 | |||
| CI / The Cigna Group | 0.00 | 0.00 | 0.02 | 6.25 | 0.4577 | 0.0630 | |||
| F / Ford Motor Company | 0.00 | 0.00 | 0.02 | -19.05 | 0.4577 | -0.0604 | |||
| WYNN / Wynn Resorts, Limited | 0.00 | 0.02 | 0.4308 | 0.4308 | |||||
| ZTS / Zoetis Inc. | 0.00 | 0.00 | 0.01 | -25.00 | 0.4039 | -0.0896 | |||
| SBUX / Starbucks Corporation | 0.00 | 0.00 | 0.01 | -22.22 | 0.3770 | -0.0672 | |||
| UNH / UnitedHealth Group Incorporated | 0.00 | 0.00 | 0.01 | 0.00 | 0.3770 | 0.0315 | |||
| VEA / Vanguard Tax-Managed Funds - Vanguard FTSE Developed Markets ETF | 0.00 | 0.00 | 0.01 | -6.67 | 0.3770 | 0.0069 | |||
| UNP / Union Pacific Corporation | 0.00 | 0.00 | 0.01 | 8.33 | 0.3500 | 0.0539 | |||
| AVGO / Broadcom Inc. | 0.00 | 0.00 | 0.01 | -7.69 | 0.3231 | 0.0024 | |||
| V / Visa Inc. | 0.00 | 0.00 | 0.01 | 9.09 | 0.3231 | 0.0517 | |||
| PPA / Invesco Exchange-Traded Fund Trust - Invesco Aerospace & Defense ETF | 0.00 | 0.00 | 0.01 | 9.09 | 0.3231 | 0.0517 | |||
| VBK / Vanguard Index Funds - Vanguard Small-Cap Growth ETF | 0.00 | 0.00 | 0.01 | -14.29 | 0.3231 | -0.0223 | |||
| BMY / Bristol-Myers Squibb Company | 0.00 | 0.00 | 0.01 | 22.22 | 0.2962 | 0.0741 | |||
| CB / Chubb Limited | 0.00 | 0.00 | 0.01 | 11.11 | 0.2693 | 0.0472 | |||
| LMT / Lockheed Martin Corporation | 0.00 | 0.00 | 0.01 | 25.00 | 0.2693 | 0.0719 | |||
| GM / General Motors Company | 0.00 | 0.00 | 0.01 | -25.00 | 0.2423 | -0.0538 | |||
| CCI / Crown Castle Inc. | 0.00 | 0.00 | 0.01 | -11.11 | 0.2154 | -0.0067 | |||
| WMT / Walmart Inc. | 0.00 | 0.00 | 0.01 | 0.00 | 0.1885 | 0.0158 | |||
| PEP / PepsiCo, Inc. | 0.00 | 0.00 | 0.01 | -12.50 | 0.1885 | -0.0089 | |||
| MRK / Merck & Co., Inc. | 0.00 | 0.00 | 0.01 | 0.00 | 0.1885 | 0.0158 | |||
| PFE / Pfizer Inc. | 0.00 | 0.00 | 0.01 | -14.29 | 0.1616 | -0.0112 | |||
| AEP / American Electric Power Company, Inc. | 0.00 | 0.00 | 0.01 | 0.00 | 0.1616 | 0.0135 | |||
| VZ / Verizon Communications Inc. | 0.00 | 0.00 | 0.00 | 0.00 | 0.1077 | 0.0090 | |||
| AMGN / Amgen Inc. | 0.00 | 0.00 | 0.00 | 0.00 | 0.1077 | 0.0090 | |||
| DUK / Duke Energy Corporation | 0.00 | 0.00 | 0.00 | 0.00 | 0.1077 | 0.0090 | |||
| CARR / Carrier Global Corporation | 0.00 | 0.00 | 0.00 | 0.00 | 0.0539 | 0.0045 | |||
| MMM / 3M Company | 0.00 | 0.00 | 0.00 | 0.00 | 0.0539 | 0.0045 | |||
| KD / Kyndryl Holdings, Inc. | 0.00 | -28.45 | 0.00 | -50.00 | 0.0539 | -0.0448 | |||
| ANGL / VanEck ETF Trust - VanEck Fallen Angel High Yield Bond ETF | 0.00 | 0.00 | 0.00 | 0.00 | 0.0539 | 0.0045 | |||
| EMB / iShares Trust - iShares J.P. Morgan USD Emerging Markets Bond ETF | 0.00 | -100.00 | 0.00 | -100.00 | -0.3454 |