Mga Batayang Estadistika
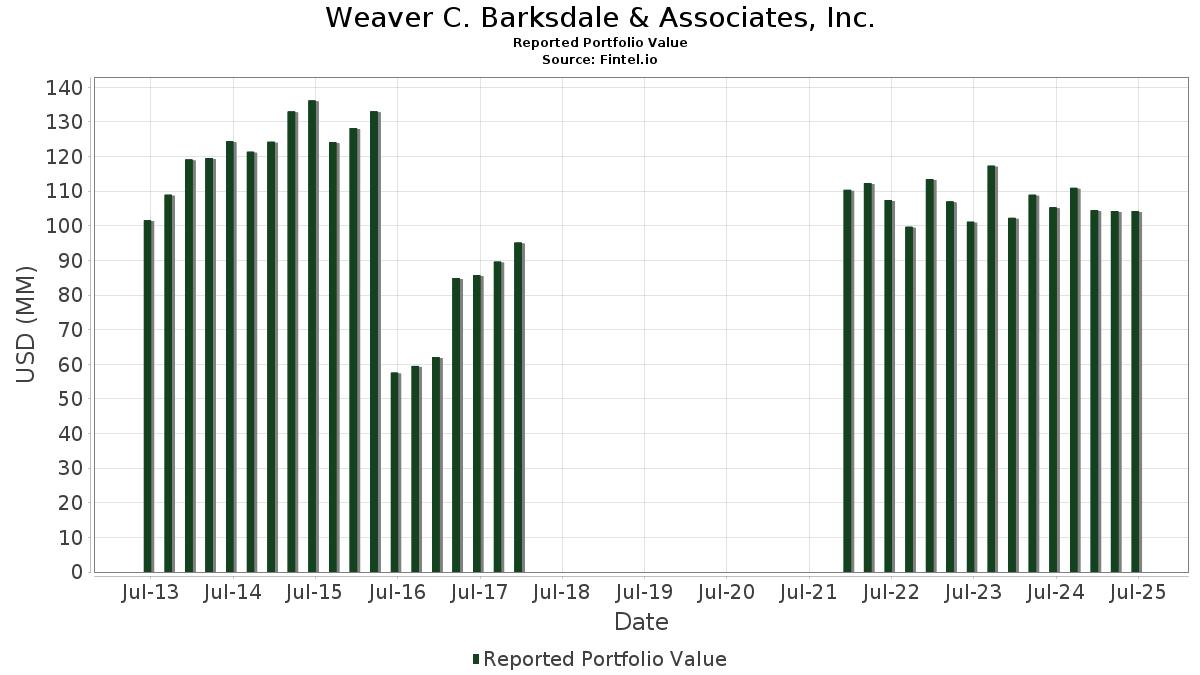
| Nilai Portofolio | $ 104,270,878 |
| Posisi Saat Ini | 62 |
Kepemilikan Terbaru, Kinerja, AUM (dari 13F, 13D)
Weaver C. Barksdale & Associates, Inc. telah mengungkapkan total kepemilikan 62 dalam pengajuan SEC terbaru mereka. Nilai portofolio terbaru dihitung sebesar $ 104,270,878 USD. Aset yang Dikelola (AUM) sebenarnya adalah nilai ini ditambah kas (yang tidak diungkapkan). Aset-aset utama Weaver C. Barksdale & Associates, Inc. adalah Microsoft Corporation (US:MSFT) , Broadcom Inc. (US:AVGO) , Old Republic International Corporation (US:ORI) , JPMorgan Chase & Co. (US:JPM) , and Gilead Sciences, Inc. (US:GILD) .
Peningkatan Tertinggi Kuartal Ini
Kami menggunakan perubahan dalam alokasi portofolio karena ini adalah metrik yang paling bermakna. Perubahan dapat disebabkan oleh perdagangan atau perubahan harga saham.
| Keamanan | Saham (MM) |
Nilai (Juta Dolar AS) |
Portfolio % | ΔPorsyento ng Portfolio |
|---|---|---|---|---|
| 0.03 | 1.86 | 1.7802 | 1.7802 | |
| 0.19 | 2.01 | 1.9298 | 1.2575 | |
| 0.01 | 2.48 | 2.3758 | 0.6579 | |
| 0.01 | 2.55 | 2.4454 | 0.5837 | |
| 0.02 | 1.83 | 1.7510 | 0.3078 | |
| 0.01 | 1.80 | 1.7257 | 0.2165 | |
| 0.05 | 1.11 | 1.0637 | 0.2021 | |
| 0.03 | 1.96 | 1.8801 | 0.1907 | |
| 0.00 | 2.30 | 2.2051 | 0.1874 | |
| 0.01 | 2.37 | 2.2737 | 0.1760 |
Penurunan Tertinggi Kuartal Ini
Kami menggunakan perubahan dalam alokasi portofolio karena ini adalah metrik yang paling bermakna. Perubahan dapat disebabkan oleh perdagangan atau perubahan harga saham.
| Keamanan | Saham (MM) |
Nilai (Juta Dolar AS) |
Portfolio % | ΔPorsyento ng Portfolio |
|---|---|---|---|---|
| 0.03 | 1.17 | 1.1247 | -0.3720 | |
| 0.02 | 1.50 | 1.4389 | -0.3016 | |
| 0.01 | 1.61 | 1.5488 | -0.2740 | |
| 0.01 | 2.06 | 1.9725 | -0.2736 | |
| 0.00 | 1.81 | 1.7328 | -0.2250 | |
| 0.01 | 1.84 | 1.7618 | -0.2207 | |
| 0.02 | 0.98 | 0.9356 | -0.2120 | |
| 0.01 | 1.01 | 0.9658 | -0.1844 | |
| 0.01 | 1.72 | 1.6493 | -0.1806 | |
| 0.01 | 2.03 | 1.9452 | -0.1787 |
Pengajuan 13F dan Dana
Formulir ini diajukan pada 2025-08-12 untuk periode pelaporan 2025-06-30. Klik ikon tautan untuk melihat riwayat transaksi selengkapnya.
Tingkatkan ke versi premium untuk membuka data premium dan ekspor ke Excel. ![]() .
.
| Keamanan | Ketik | Harga Saham Rata-rata | Saham (MM) |
ΔSaham (%) |
ΔSaham (%) |
Nilai ($MM) |
Portpolyo (%) |
ΔPortofolio (%) |
|
|---|---|---|---|---|---|---|---|---|---|
| MSFT / Microsoft Corporation | 0.01 | -0.85 | 2.55 | 31.39 | 2.4454 | 0.5837 | |||
| AVGO / Broadcom Inc. | 0.01 | -15.91 | 2.48 | 38.38 | 2.3758 | 0.6579 | |||
| ORI / Old Republic International Corporation | 0.06 | -0.81 | 2.42 | -2.77 | 2.3194 | -0.0675 | |||
| JPM / JPMorgan Chase & Co. | 0.01 | -8.28 | 2.37 | 8.42 | 2.2737 | 0.1760 | |||
| GILD / Gilead Sciences, Inc. | 0.02 | -0.38 | 2.34 | -1.35 | 2.2406 | -0.0322 | |||
| CINF / Cincinnati Financial Corporation | 0.02 | -0.75 | 2.30 | 0.13 | 2.2060 | 0.0014 | |||
| AMP / Ameriprise Financial, Inc. | 0.00 | -0.83 | 2.30 | 9.32 | 2.2051 | 0.1874 | |||
| AFL / Aflac Incorporated | 0.02 | -0.84 | 2.29 | -5.96 | 2.1938 | -0.1403 | |||
| KR / The Kroger Co. | 0.03 | -11.62 | 2.22 | -6.44 | 2.1337 | -0.1468 | |||
| CMI / Cummins Inc. | 0.01 | -0.96 | 2.22 | 3.63 | 2.1331 | 0.0738 | |||
| SCHW / The Charles Schwab Corporation | 0.02 | -18.34 | 2.17 | -4.82 | 2.0837 | -0.1058 | |||
| GD / General Dynamics Corporation | 0.01 | -0.85 | 2.16 | 6.15 | 2.0681 | 0.1191 | |||
| UNM / Unum Group | 0.03 | -0.81 | 2.07 | -1.71 | 1.9858 | -0.0353 | |||
| ABBV / AbbVie Inc. | 0.01 | -0.90 | 2.06 | -12.17 | 1.9725 | -0.2736 | |||
| SNA / Snap-on Incorporated | 0.01 | -0.85 | 2.03 | -8.36 | 1.9452 | -0.1787 | |||
| PKG / Packaging Corporation of America | 0.01 | -0.81 | 2.02 | -5.56 | 1.9407 | -0.1146 | |||
| AES / The AES Corporation | 0.19 | 237.93 | 2.01 | 187.43 | 1.9298 | 1.2575 | |||
| MET / MetLife, Inc. | 0.02 | -0.97 | 2.01 | -0.84 | 1.9247 | -0.0164 | |||
| PRU / Prudential Financial, Inc. | 0.02 | -0.84 | 1.97 | -4.56 | 1.8879 | -0.0911 | |||
| CSCO / Cisco Systems, Inc. | 0.03 | -1.01 | 1.96 | 11.36 | 1.8801 | 0.1907 | |||
| NEE / NextEra Energy, Inc. | 0.03 | -0.83 | 1.92 | -2.84 | 1.8402 | -0.0541 | |||
| AOS / A. O. Smith Corporation | 0.03 | -0.79 | 1.92 | -0.42 | 1.8367 | -0.0088 | |||
| ENB / Enbridge Inc. | 0.04 | -0.90 | 1.88 | 1.35 | 1.8022 | 0.0226 | |||
| LMT / Lockheed Martin Corporation | 0.00 | -0.81 | 1.88 | 2.68 | 1.7999 | 0.0470 | |||
| ARE / Alexandria Real Estate Equities, Inc. | 0.03 | 1.86 | 1.7802 | 1.7802 | |||||
| LOW / Lowe's Companies, Inc. | 0.01 | -0.85 | 1.84 | -5.64 | 1.7671 | -0.1063 | |||
| AMGN / Amgen Inc. | 0.01 | -0.89 | 1.84 | -11.08 | 1.7618 | -0.2207 | |||
| TD / The Toronto-Dominion Bank | 0.02 | -0.88 | 1.83 | 21.34 | 1.7510 | 0.3078 | |||
| ITW / Illinois Tool Works Inc. | 0.01 | -0.92 | 1.81 | -1.20 | 1.7356 | -0.0212 | |||
| ELV / Elevance Health, Inc. | 0.00 | -0.83 | 1.81 | -11.47 | 1.7328 | -0.2250 | |||
| TXN / Texas Instruments Incorporated | 0.01 | -0.98 | 1.80 | 14.37 | 1.7257 | 0.2165 | |||
| QCOM / QUALCOMM Incorporated | 0.01 | -0.50 | 1.79 | 3.11 | 1.7154 | 0.0513 | |||
| WTRG / Essential Utilities, Inc. | 0.05 | -0.79 | 1.78 | -6.85 | 1.7088 | -0.1259 | |||
| NXST / Nexstar Media Group, Inc. | 0.01 | -0.94 | 1.76 | -4.18 | 1.6918 | -0.0751 | |||
| PFG / Principal Financial Group, Inc. | 0.02 | -0.93 | 1.76 | -6.63 | 1.6872 | -0.1209 | |||
| O / Realty Income Corporation | 0.03 | -0.79 | 1.72 | -1.49 | 1.6500 | -0.0256 | |||
| KMB / Kimberly-Clark Corporation | 0.01 | -0.58 | 1.72 | -9.86 | 1.6493 | -0.1806 | |||
| CVX / Chevron Corporation | 0.01 | -0.88 | 1.61 | -15.01 | 1.5488 | -0.2740 | |||
| PSX / Phillips 66 | 0.01 | -0.84 | 1.60 | -4.08 | 1.5351 | -0.0654 | |||
| EOG / EOG Resources, Inc. | 0.01 | -0.89 | 1.56 | -7.43 | 1.4933 | -0.1209 | |||
| SJM / The J. M. Smucker Company | 0.02 | -0.36 | 1.50 | -17.31 | 1.4389 | -0.3016 | |||
| HSY / The Hershey Company | 0.01 | -0.38 | 1.45 | -3.20 | 1.3911 | -0.0470 | |||
| MPC / Marathon Petroleum Corporation | 0.01 | -0.34 | 1.40 | 13.74 | 1.3423 | 0.1613 | |||
| UPS / United Parcel Service, Inc. | 0.01 | -0.88 | 1.33 | -9.01 | 1.2784 | -0.1276 | |||
| TGT / Target Corporation | 0.01 | -0.16 | 1.32 | -5.57 | 1.2696 | -0.0752 | |||
| GPC / Genuine Parts Company | 0.01 | -0.40 | 1.23 | 1.48 | 1.1812 | 0.0167 | |||
| VZ / Verizon Communications Inc. | 0.03 | -0.80 | 1.22 | -5.34 | 1.1735 | -0.0669 | |||
| CMCSA / Comcast Corporation | 0.03 | -0.95 | 1.22 | -4.23 | 1.1734 | -0.0519 | |||
| MDT / Medtronic plc | 0.01 | -0.86 | 1.19 | -3.81 | 1.1402 | -0.0451 | |||
| BMY / Bristol-Myers Squibb Company | 0.03 | -1.08 | 1.17 | -24.87 | 1.1247 | -0.3720 | |||
| MRK / Merck & Co., Inc. | 0.01 | -0.92 | 1.16 | -12.61 | 1.1101 | -0.1603 | |||
| SIRI / Sirius XM Holdings Inc. | 0.05 | -0.39 | 1.12 | 1.45 | 1.0774 | 0.0151 | |||
| BEN / Franklin Resources, Inc. | 0.05 | -0.34 | 1.11 | 23.50 | 1.0637 | 0.2021 | |||
| JNJ / Johnson & Johnson | 0.01 | -1.22 | 1.08 | -8.89 | 1.0323 | -0.1012 | |||
| OHI / Omega Healthcare Investors, Inc. | 0.03 | -1.03 | 1.04 | -4.70 | 0.9929 | -0.0496 | |||
| EMN / Eastman Chemical Company | 0.01 | -0.95 | 1.01 | -16.03 | 0.9658 | -0.1844 | |||
| BBY / Best Buy Co., Inc. | 0.01 | -0.89 | 1.00 | -9.51 | 0.9583 | -0.1017 | |||
| LYB / LyondellBasell Industries N.V. | 0.02 | -0.91 | 0.98 | -18.48 | 0.9356 | -0.2120 | |||
| TFC / Truist Financial Corporation | 0.02 | -1.03 | 0.95 | 3.48 | 0.9139 | 0.0303 | |||
| CAH / Cardinal Health, Inc. | 0.00 | -21.99 | 0.76 | -4.91 | 0.7254 | -0.0374 | |||
| TROW / T. Rowe Price Group, Inc. | 0.01 | -0.98 | 0.73 | 4.17 | 0.6955 | 0.0270 | |||
| CI / The Cigna Group | 0.00 | 11.62 | 0.69 | 12.11 | 0.6579 | 0.0711 | |||
| CCI / Crown Castle Inc. | 0.00 | -100.00 | 0.00 | 0.0000 |