Mga Batayang Estadistika
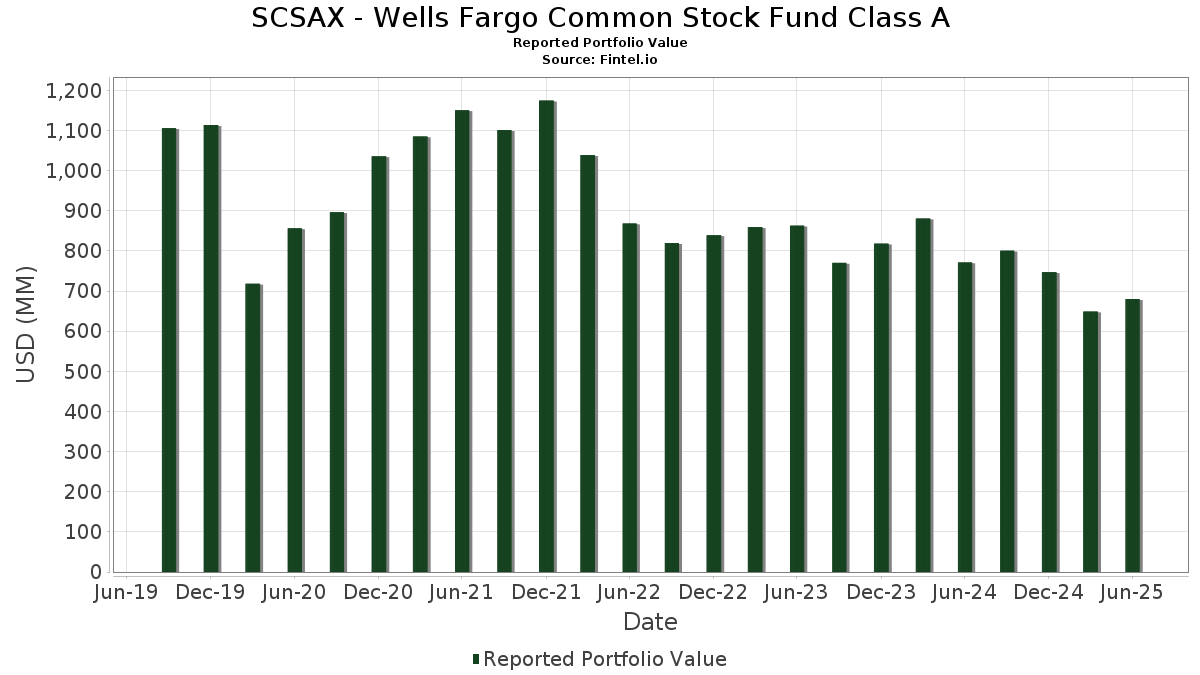
| Nilai Portofolio | $ 680,216,007 |
| Posisi Saat Ini | 74 |
Kepemilikan Terbaru, Kinerja, AUM (dari 13F, 13D)
SCSAX - Wells Fargo Common Stock Fund Class A telah mengungkapkan total kepemilikan 74 dalam pengajuan SEC terbaru mereka. Nilai portofolio terbaru dihitung sebesar $ 680,216,007 USD. Aset yang Dikelola (AUM) sebenarnya adalah nilai ini ditambah kas (yang tidak diungkapkan). Aset-aset utama SCSAX - Wells Fargo Common Stock Fund Class A adalah Marvell Technology, Inc. (US:MRVL) , Air Lease Corporation (US:AL) , National Vision Holdings, Inc. (US:EYE) , Carlisle Companies Incorporated (US:CSL) , and APi Group Corporation (US:APG) . Posisi baru SCSAX - Wells Fargo Common Stock Fund Class A meliputi: Antero Resources Corporation (US:AR) , BWX Technologies, Inc. (US:BWXT) , AZZ Inc. (US:AZZ) , Chewy, Inc. (US:CHWY) , and DraftKings Inc. (US:DKNG) .
Peningkatan Tertinggi Kuartal Ini
Kami menggunakan perubahan dalam alokasi portofolio karena ini adalah metrik yang paling bermakna. Perubahan dapat disebabkan oleh perdagangan atau perubahan harga saham.
| Keamanan | Saham (MM) |
Nilai (Juta Dolar AS) |
Portfolio % | ΔPorsyento ng Portfolio |
|---|---|---|---|---|
| 0.62 | 13.41 | 1.9726 | 1.9726 | |
| 0.25 | 10.17 | 1.4960 | 1.4960 | |
| 0.07 | 9.95 | 1.4626 | 1.4626 | |
| 0.09 | 8.62 | 1.2676 | 1.2676 | |
| 0.20 | 8.56 | 1.2594 | 1.2594 | |
| 0.18 | 7.53 | 1.1079 | 1.1079 | |
| 0.28 | 7.12 | 1.0473 | 1.0473 | |
| 6.61 | 6.61 | 0.9714 | 0.9714 | |
| 0.23 | 17.70 | 2.6023 | 0.9290 | |
| 0.65 | 15.06 | 2.2151 | 0.8029 |
Penurunan Tertinggi Kuartal Ini
Kami menggunakan perubahan dalam alokasi portofolio karena ini adalah metrik yang paling bermakna. Perubahan dapat disebabkan oleh perdagangan atau perubahan harga saham.
| Keamanan | Saham (MM) |
Nilai (Juta Dolar AS) |
Portfolio % | ΔPorsyento ng Portfolio |
|---|---|---|---|---|
| 0.11 | 8.14 | 1.1964 | -0.7643 | |
| 0.09 | 4.34 | 0.6386 | -0.5922 | |
| 0.18 | 8.40 | 1.2359 | -0.5455 | |
| 0.08 | 8.70 | 1.2800 | -0.5391 | |
| 0.04 | 5.53 | 0.8131 | -0.5369 | |
| 0.10 | 8.98 | 1.3211 | -0.5204 | |
| 0.07 | 5.15 | 0.7568 | -0.4062 | |
| 0.04 | 6.28 | 0.9238 | -0.3656 | |
| 0.06 | 4.49 | 0.6601 | -0.3638 | |
| 0.04 | 8.85 | 1.3019 | -0.3464 |
Pengajuan 13F dan Dana
Formulir ini diajukan pada 2025-08-26 untuk periode pelaporan 2025-06-30. Klik ikon tautan untuk melihat riwayat transaksi selengkapnya.
Tingkatkan ke versi premium untuk membuka data premium dan ekspor ke Excel. ![]() .
.
| Keamanan | Ketik | Harga Saham Rata-rata | Saham (MM) |
ΔSaham (%) |
ΔSaham (%) |
Nilai ($MM) |
Portpolyo (%) |
ΔPortofolio (%) |
|
|---|---|---|---|---|---|---|---|---|---|
| MRVL / Marvell Technology, Inc. | 0.23 | 29.66 | 17.70 | 63.01 | 2.6023 | 0.9290 | |||
| AL / Air Lease Corporation | 0.29 | -2.24 | 17.01 | 18.36 | 2.5020 | 0.2864 | |||
| EYE / National Vision Holdings, Inc. | 0.65 | -8.69 | 15.06 | 64.39 | 2.2151 | 0.8029 | |||
| CSL / Carlisle Companies Incorporated | 0.04 | 2.31 | 15.05 | 12.19 | 2.2136 | 0.1457 | |||
| QXO INC PIPE DEAL / EC (000000000) | 0.62 | 13.41 | 1.9726 | 1.9726 | |||||
| APG / APi Group Corporation | 0.25 | -12.95 | 12.91 | 24.27 | 1.8985 | 0.2973 | |||
| DT / Dynatrace, Inc. | 0.23 | 0.78 | 12.83 | 18.01 | 1.8866 | 0.2110 | |||
| WNS / WNS (Holdings) Limited | 0.20 | 3.03 | 12.74 | 5.96 | 1.8735 | 0.0205 | |||
| HQY / HealthEquity, Inc. | 0.12 | -9.32 | 12.72 | 7.50 | 1.8703 | 0.0467 | |||
| TDY / Teledyne Technologies Incorporated | 0.02 | -3.10 | 12.38 | -0.26 | 1.8211 | -0.0925 | |||
| PLNT / Planet Fitness, Inc. | 0.11 | 16.50 | 12.37 | 31.51 | 1.8190 | 0.3692 | |||
| SBAC / SBA Communications Corporation | 0.05 | 4.22 | 12.22 | 11.25 | 1.7964 | 0.1040 | |||
| 27M / Melrose Industries PLC | 1.67 | -22.23 | 12.18 | -8.21 | 1.7906 | -0.2540 | |||
| CCK / Crown Holdings, Inc. | 0.12 | -1.86 | 11.87 | 13.22 | 1.7451 | 0.1298 | |||
| RGA / Reinsurance Group of America, Incorporated | 0.06 | -0.32 | 11.73 | 0.42 | 1.7246 | -0.0753 | |||
| OKTA / Okta, Inc. | 0.12 | 10.77 | 11.52 | 5.23 | 1.6941 | 0.0069 | |||
| KEX / Kirby Corporation | 0.10 | 17.69 | 11.34 | 32.14 | 1.6668 | 0.3447 | |||
| RJF / Raymond James Financial, Inc. | 0.07 | 6.81 | 11.30 | 17.93 | 1.6616 | 0.1849 | |||
| UNM / Unum Group | 0.14 | 8.20 | 11.28 | 7.27 | 1.6585 | 0.0381 | |||
| AR / Antero Resources Corporation | 0.25 | 10.17 | 1.4960 | 1.4960 | |||||
| SUI / Sun Communities, Inc. | 0.08 | -3.68 | 10.14 | -5.28 | 1.4917 | -0.1590 | |||
| ALNT / Allient Inc. | 0.28 | 14.16 | 10.13 | 88.60 | 1.4890 | 0.6615 | |||
| BWXT / BWX Technologies, Inc. | 0.07 | 9.95 | 1.4626 | 1.4626 | |||||
| RRX / Regal Rexnord Corporation | 0.07 | -24.55 | 9.89 | -3.93 | 1.4549 | -0.1323 | |||
| CCCS / CCC Intelligent Solutions Holdings Inc. | 1.05 | 2.03 | 9.89 | 6.32 | 1.4544 | 0.0207 | |||
| TRU / TransUnion | 0.11 | 0.70 | 9.88 | 6.79 | 1.4529 | 0.0269 | |||
| RSG / Republic Services, Inc. | 0.04 | 2.84 | 9.79 | 4.72 | 1.4396 | -0.0011 | |||
| ABCB / Ameris Bancorp | 0.15 | 9.10 | 9.77 | 22.62 | 1.4373 | 0.2088 | |||
| CUBE / CubeSmart | 0.23 | 10.62 | 9.71 | 10.08 | 1.4276 | 0.0684 | |||
| LPX / Louisiana-Pacific Corporation | 0.11 | 12.78 | 9.56 | 5.43 | 1.4051 | 0.0083 | |||
| SPSC / SPS Commerce, Inc. | 0.07 | 13.34 | 9.49 | 16.20 | 1.3959 | 0.1369 | |||
| WTFC / Wintrust Financial Corporation | 0.08 | 10.59 | 9.42 | 21.92 | 1.3845 | 0.1943 | |||
| BIO / Bio-Rad Laboratories, Inc. | 0.04 | -7.37 | 9.35 | -8.22 | 1.3751 | -0.1953 | |||
| AN / AutoNation, Inc. | 0.05 | -8.01 | 9.34 | 12.85 | 1.3741 | 0.0979 | |||
| ALGM / Allegro MicroSystems, Inc. | 0.27 | 1.28 | 9.31 | 37.79 | 1.3695 | 0.3278 | |||
| ACGL / Arch Capital Group Ltd. | 0.10 | -20.57 | 8.98 | -24.81 | 1.3211 | -0.5204 | |||
| WBS / Webster Financial Corporation | 0.16 | -7.46 | 8.86 | -1.98 | 1.3026 | -0.0903 | |||
| BURL / Burlington Stores, Inc. | 0.04 | -15.20 | 8.85 | -17.22 | 1.3019 | -0.3464 | |||
| TRNO / Terreno Realty Corporation | 0.16 | -5.58 | 8.77 | -16.26 | 1.2903 | -0.3245 | |||
| AXV / AXIS Capital Holdings Limited | 0.08 | -28.80 | 8.70 | -26.26 | 1.2800 | -0.5391 | |||
| EG0 / Essent Group Ltd. | 0.14 | -3.49 | 8.68 | 1.54 | 1.2768 | -0.0410 | |||
| AZZ / AZZ Inc. | 0.09 | 8.62 | 1.2676 | 1.2676 | |||||
| QTWO / Q2 Holdings, Inc. | 0.09 | -7.52 | 8.60 | 8.19 | 1.2652 | 0.0394 | |||
| CHWY / Chewy, Inc. | 0.20 | 8.56 | 1.2594 | 1.2594 | |||||
| CHD / Church & Dwight Co., Inc. | 0.09 | 13.30 | 8.56 | -1.10 | 1.2590 | -0.0751 | |||
| FAF / First American Financial Corporation | 0.14 | 11.11 | 8.46 | 3.94 | 1.2445 | -0.0105 | |||
| ON / ON Semiconductor Corporation | 0.16 | -34.09 | 8.44 | -15.10 | 1.2408 | -0.2910 | |||
| IP / International Paper Company | 0.18 | -17.16 | 8.40 | -27.29 | 1.2359 | -0.5455 | |||
| XBI / SPDR Series Trust - SPDR S&P Biotech ETF | 0.10 | -3.21 | 8.20 | -1.03 | 1.2063 | -0.0712 | |||
| HAE / Haemonetics Corporation | 0.11 | -4.74 | 8.16 | 11.83 | 1.1994 | 0.0754 | |||
| WLK / Westlake Corporation | 0.11 | -15.75 | 8.14 | -36.04 | 1.1964 | -0.7643 | |||
| AZTA / Azenta, Inc. | 0.26 | 30.31 | 8.13 | 15.79 | 1.1958 | 0.1134 | |||
| PNFP / Pinnacle Financial Partners, Inc. | 0.07 | -18.87 | 7.82 | -15.53 | 1.1504 | -0.2769 | |||
| LFUS / Littelfuse, Inc. | 0.03 | -28.32 | 7.76 | -17.40 | 1.1410 | -0.3067 | |||
| DKNG / DraftKings Inc. | 0.18 | 7.53 | 1.1079 | 1.1079 | |||||
| RVLV / Revolve Group, Inc. | 0.37 | -0.19 | 7.44 | -6.88 | 1.0941 | -0.1374 | |||
| LIVN / LivaNova PLC | 0.16 | -17.62 | 7.36 | -5.58 | 1.0819 | -0.1191 | |||
| CBOE / Cboe Global Markets, Inc. | 0.03 | 18.18 | 7.28 | 21.81 | 1.0702 | 0.1493 | |||
| CTRA / Coterra Energy Inc. | 0.28 | 7.12 | 1.0473 | 1.0473 | |||||
| CMC / Commercial Metals Company | 0.14 | -23.07 | 6.84 | -18.23 | 1.0059 | -0.2833 | |||
| HRI / Herc Holdings Inc. | 0.05 | -13.36 | 6.74 | -15.02 | 0.9908 | -0.2313 | |||
| ALLSPRING GOVERNMENT MONEY MAR / STIV (000000000) | 6.61 | 6.61 | 0.9714 | 0.9714 | |||||
| PB / Prosperity Bancshares, Inc. | 0.09 | -18.09 | 6.53 | -19.40 | 0.9600 | -0.2882 | |||
| HCI / HCI Group, Inc. | 0.04 | -26.37 | 6.28 | -24.90 | 0.9238 | -0.3656 | |||
| BRKR / Bruker Corporation | 0.14 | -10.45 | 5.77 | -11.61 | 0.8489 | -0.1577 | |||
| HUM / Humana Inc. | 0.02 | 6.92 | 5.67 | -1.20 | 0.8339 | -0.0508 | |||
| ITGR / Integer Holdings Corporation | 0.04 | -39.42 | 5.53 | -36.87 | 0.8131 | -0.5369 | |||
| AAON / AAON, Inc. | 0.07 | -27.74 | 5.15 | -31.80 | 0.7568 | -0.4062 | |||
| PTLO / Portillo's Inc. | 0.41 | 4.81 | 0.7075 | 0.7075 | |||||
| SCI / Service Corporation International | 0.06 | -33.43 | 4.49 | -32.44 | 0.6601 | -0.3638 | |||
| ASH / Ashland Inc. | 0.09 | -35.88 | 4.34 | -45.63 | 0.6386 | -0.5922 | |||
| RSKD / Riskified Ltd. | 0.82 | 20.41 | 4.07 | 30.06 | 0.5982 | 0.1161 | |||
| THRM / Gentherm Incorporated | 0.12 | -24.61 | 3.46 | -20.24 | 0.5088 | -0.1598 | |||
| SDGR / Schrödinger, Inc. | 0.15 | 20.21 | 3.04 | 22.52 | 0.4472 | 0.0646 |