Mga Batayang Estadistika
| Profil Orang Dalam | WEST COAST ASSET MANAGEMENT INC |
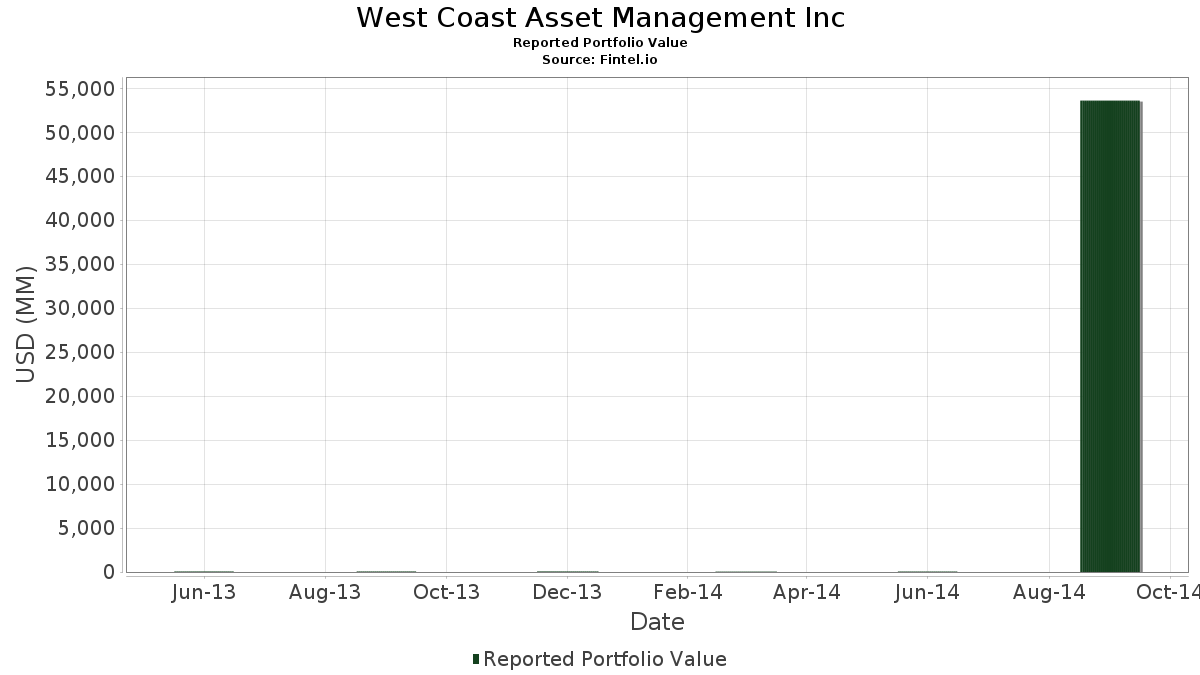
| Nilai Portofolio | $ 53,600,189,000 |
| Posisi Saat Ini | 33 |
Kepemilikan Terbaru, Kinerja, AUM (dari 13F, 13D)
West Coast Asset Management Inc telah mengungkapkan total kepemilikan 33 dalam pengajuan SEC terbaru mereka. Nilai portofolio terbaru dihitung sebesar $ 53,600,189,000 USD. Aset yang Dikelola (AUM) sebenarnya adalah nilai ini ditambah kas (yang tidak diungkapkan). Aset-aset utama West Coast Asset Management Inc adalah Johnson & Johnson (US:JNJ) , Kimberly-Clark Corporation (US:KMB) , Microsoft Corporation (US:MSFT) , Apple Inc. (US:AAPL) , and The Clorox Company (US:CLX) . Posisi baru West Coast Asset Management Inc meliputi: Yum! Brands, Inc. (US:YUM) , The Southern Company (US:SO) , .
Peningkatan Tertinggi Kuartal Ini
Kami menggunakan perubahan dalam alokasi portofolio karena ini adalah metrik yang paling bermakna. Perubahan dapat disebabkan oleh perdagangan atau perubahan harga saham.
| Keamanan | Saham (MM) |
Nilai (Juta Dolar AS) |
Portfolio % | ΔPorsyento ng Portfolio |
|---|---|---|---|---|
| 0.11 | 4,876.29 | 9.0975 | 1.2083 | |
| 0.05 | 4,629.39 | 8.6369 | 0.9445 | |
| 0.06 | 6,168.19 | 11.5078 | 0.8231 | |
| 0.04 | 4,228.24 | 7.8885 | 0.6468 | |
| 0.05 | 3,874.63 | 7.2288 | 0.6444 | |
| 0.08 | 2,276.78 | 4.2477 | 0.2904 | |
| 0.09 | 3,638.69 | 6.7886 | 0.2766 | |
| 0.05 | 5,052.18 | 9.4257 | 0.1214 | |
| 0.00 | 35.99 | 0.0671 | 0.0671 | |
| 0.00 | 30.99 | 0.0578 | 0.0578 |
Penurunan Tertinggi Kuartal Ini
Kami menggunakan perubahan dalam alokasi portofolio karena ini adalah metrik yang paling bermakna. Perubahan dapat disebabkan oleh perdagangan atau perubahan harga saham.
| Keamanan | Saham (MM) |
Nilai (Juta Dolar AS) |
Portfolio % | ΔPorsyento ng Portfolio |
|---|---|---|---|---|
| 0.06 | 4,189.21 | 7.8157 | -3.6485 | |
| 0.04 | 3,441.38 | 6.4205 | -0.4899 | |
| 0.09 | 3,184.33 | 5.9409 | -0.3421 | |
| 0.00 | 0.00 | -0.2169 | ||
| 0.08 | 2,642.77 | 4.9305 | -0.1542 | |
| 0.03 | 2,339.92 | 4.3655 | -0.1277 | |
| 0.04 | 2,392.56 | 4.4637 | -0.1172 | |
| 0.00 | 0.00 | -0.0376 | ||
| 0.00 | 13.04 | 0.0243 | -0.0032 | |
| 0.01 | 35.40 | 0.0660 | -0.0003 |
Pengajuan 13F dan Dana
Formulir ini diajukan pada 2014-10-14 untuk periode pelaporan 2014-09-30. Klik ikon tautan untuk melihat riwayat transaksi selengkapnya.
Tingkatkan ke versi premium untuk membuka data premium dan ekspor ke Excel. ![]() .
.
| Keamanan | Ketik | Harga Saham Rata-rata | Saham (MM) |
ΔSaham (%) |
ΔSaham (%) |
Nilai ($MM) |
Portpolyo (%) |
ΔPortofolio (%) |
|
|---|---|---|---|---|---|---|---|---|---|
| JNJ / Johnson & Johnson | 57.87 | 99,617.40 | 6,168.19 | 101,500.82 | 11.5078 | 0.8231 | |||
| KMB / Kimberly-Clark Corporation | 46.97 | 98,700.91 | 5,052.18 | 95,476.67 | 9.4257 | 0.1214 | |||
| MSFT / Microsoft Corporation | 105.18 | 97,741.01 | 4,876.29 | 108,697.23 | 9.0975 | 1.2083 | |||
| AAPL / Apple Inc. | 45.95 | 97,589.00 | 4,629.39 | 105,811.51 | 8.6369 | 0.9445 | |||
| CLX / The Clorox Company | 44.03 | 97,689.92 | 4,228.24 | 102,676.81 | 7.8885 | 0.6468 | |||
| TAP / Molson Coors Beverage Company | 56.28 | 63,965.76 | 4,189.21 | 64,210.90 | 7.8157 | -3.6485 | |||
| ADP / Automatic Data Processing, Inc. | 46.64 | 98,721.86 | 3,874.63 | 103,471.93 | 7.2288 | 0.6444 | |||
| BR / Broadridge Financial Solutions, Inc. | 87.41 | 98,258.18 | 3,638.69 | 98,243.08 | 6.7886 | 0.2766 | |||
| COP / ConocoPhillips | 44.97 | 98,090.07 | 3,441.38 | 87,556.04 | 6.4205 | -0.4899 | |||
| MDLZ / Mondelez International, Inc. | 92.93 | 97,800.47 | 3,184.33 | 89,097.00 | 5.9409 | -0.3421 | |||
| EXC / Exelon Corporation | 77.52 | 97,780.10 | 2,642.77 | 91,376.95 | 4.9305 | -0.1542 | |||
| KRFT / | 42.42 | 97,601.47 | 2,392.56 | 91,850.77 | 4.4637 | -0.1172 | |||
| MKC / McCormick & Company, Incorporated | 34.98 | 97,970.88 | 2,339.92 | 91,553.66 | 4.3655 | -0.1277 | |||
| DMND / Diamond Foods, Inc. | 79.58 | 99,699.35 | 2,276.78 | 101,180.43 | 4.2477 | 0.2904 | |||
| GE / General Electric Company | 3.60 | 99,900.00 | 92.23 | 98,019.15 | 0.1721 | 0.0056 | |||
| QCOM / QUALCOMM Incorporated | 1.00 | 99,900.00 | 74.77 | 94,545.57 | 0.1395 | 0.0001 | |||
| MO / Altria Group, Inc. | 1.50 | 101,455.10 | 69.01 | 111,201.61 | 0.1287 | 0.0196 | |||
| ACWX / iShares Trust - iShares MSCI ACWI ex U.S. ETF | 1.35 | 99,900.00 | 61.40 | 95,834.38 | 0.1145 | 0.0005 | |||
| BRK.B / Berkshire Hathaway Inc. | 0.40 | 99,900.00 | 55.26 | 110,412.00 | 0.1031 | 0.0140 | |||
| VWO / Vanguard International Equity Index Funds - Vanguard FTSE Emerging Markets ETF | 1.26 | 99,900.00 | 52.76 | 97,609.26 | 0.0984 | 0.0024 | |||
| GIM / Templeton Global Income Fund | 6.00 | 99,900.00 | 47.70 | 97,246.94 | 0.0890 | 0.0018 | |||
| YUM / Yum! Brands, Inc. | 0.50 | 35.99 | 0.0671 | 0.0671 | |||||
| FAX / Abrdn Asia-Pacific Income Fund Inc | 6.00 | 99,900.00 | 35.40 | 95,575.68 | 0.0660 | -0.0003 | |||
| COST / Costco Wholesale Corporation | 0.25 | 99,900.00 | 31.33 | 111,792.86 | 0.0585 | 0.0078 | |||
| SO / The Southern Company | 0.71 | 30.99 | 0.0578 | 0.0578 | |||||
| SBUX / Starbucks Corporation | 0.40 | 99,900.00 | 30.18 | 100,513.33 | 0.0563 | 0.0018 | |||
| HOG / Harley-Davidson, Inc. | 0.22 | 99,900.00 | 13.04 | 86,813.33 | 0.0243 | -0.0032 | |||
| VMW / Vmware Inc. - Class A | 0.10 | 99,900.00 | 9.38 | 104,166.67 | 0.0175 | 0.0005 | |||
| VZ / Verizon Communications Inc. | 0.14 | 99,900.00 | 7.00 | 116,550.00 | 0.0131 | 0.0010 | |||
| XLV / The Select Sector SPDR Trust - The Health Care Select Sector SPDR Fund | 0.10 | 99,900.00 | 6.58 | 109,616.67 | 0.0123 | 0.0013 | |||
| WFC / Wells Fargo & Company | 0.10 | 99,900.00 | 5.39 | 107,780.00 | 0.0101 | 0.0004 | |||
| ARE / Alexandria Real Estate Equities, Inc. | 0.06 | 99,900.00 | 4.57 | 114,225.00 | 0.0085 | 0.0001 | |||
| CMCSA / Comcast Corporation | 0.05 | 99,900.00 | 2.63 | 131,650.00 | 0.0049 | 0.0003 | |||
| CVX / Chevron Corporation | 0.00 | -100.00 | 0.00 | -100.00 | -0.2169 | ||||
| T / AT&T Inc. | 0.00 | -100.00 | 0.00 | -100.00 | -0.0376 |